In today’s fast-evolving technology landscape, Snowflake Inc. and Asana, Inc. stand out as influential players in the software application sector. Snowflake specializes in cloud-based data platforms, while Asana focuses on work management solutions, both addressing critical business needs. Their innovation strategies and market overlap make them compelling for comparison. Join me as we explore which company offers the most promising investment potential for your portfolio.

Table of contents
Companies Overview
I will begin the comparison between Snowflake Inc. and Asana, Inc. by providing an overview of these two companies and their main differences.
Snowflake Inc. Overview
Snowflake Inc. operates a cloud-based data platform that enables customers to consolidate data into a single source of truth for business insights, application building, and data sharing. Founded in 2012 and headquartered in Bozeman, Montana, Snowflake serves a broad range of industries with its Data Cloud offering. The company is a significant player in the software application industry with a market cap of approximately 70.4B USD.
Asana, Inc. Overview
Asana, Inc. provides a work management platform designed to help individuals and teams organize tasks and strategic initiatives across various industries, including technology and healthcare. Incorporated in 2008 and based in San Francisco, California, Asana supports collaboration across organizational levels. The company operates in the software application sector with a market cap near 2.6B USD.
Key similarities and differences
Both Snowflake and Asana are U.S.-based technology companies listed on the NYSE, specializing in software applications. Snowflake focuses on cloud data platforms facilitating data consolidation and analytics, while Asana centers on work management and team collaboration tools. Snowflake’s market capitalization is substantially larger, reflecting its broader industry reach and product scope, whereas Asana targets operational productivity in diverse sectors with a smaller workforce.
Income Statement Comparison
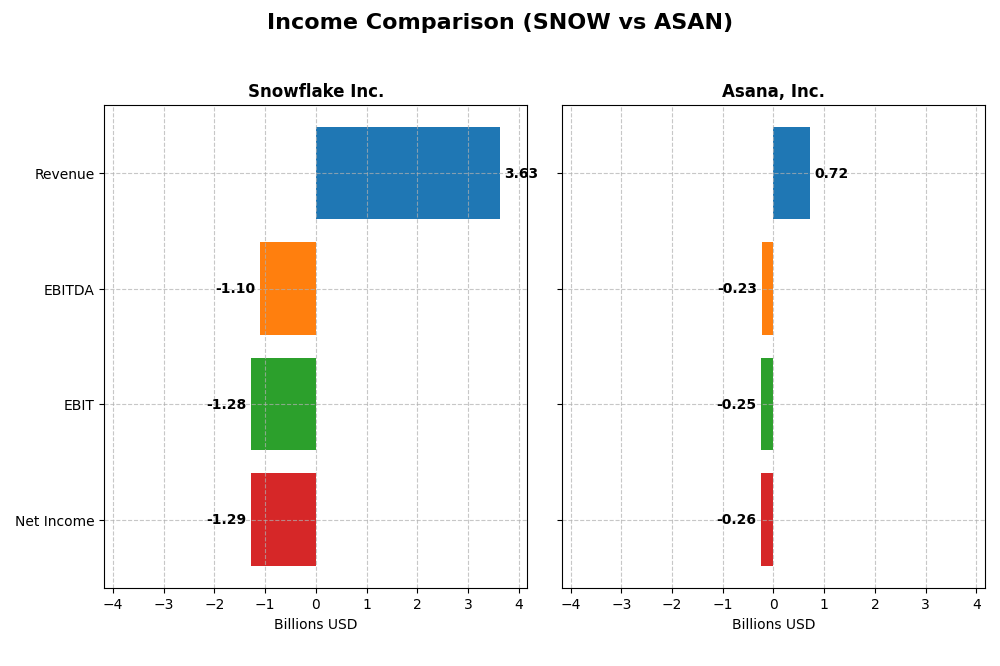
The table below presents a side-by-side comparison of the most recent fiscal year income statement metrics for Snowflake Inc. and Asana, Inc., highlighting key financial performance indicators.
| Metric | Snowflake Inc. (SNOW) | Asana, Inc. (ASAN) |
|---|---|---|
| Market Cap | 70.4B | 2.6B |
| Revenue | 3.63B | 724M |
| EBITDA | -1.10B | -230M |
| EBIT | -1.28B | -247M |
| Net Income | -1.29B | -256M |
| EPS | -3.86 | -1.11 |
| Fiscal Year | 2025 | 2025 |
Income Statement Interpretations
Snowflake Inc.
Snowflake Inc. experienced strong revenue growth of 512.52% from 2021 to 2025, reaching $3.63B in 2025. However, net income declined by 138.48% over the same period, with a net loss of $1.29B in 2025. Gross margins remained favorable at 66.5%, but EBIT and net margins were negative and deteriorated in 2025. The most recent year showed slowing EBIT and net margin growth, signaling profitability challenges despite revenue gains.
Asana, Inc.
Asana’s revenue grew steadily by 218.88% over 2021-2025, hitting $724M in 2025, while net income decreased by 20.7% overall, with a net loss of $256M in 2025. Gross margin was very strong at 89.34%, but EBIT and net margins remained negative. In 2025, Asana posted modest improvements in EBIT and net margin growth, reflecting some operational stabilization alongside continued top-line expansion.
Which one has the stronger fundamentals?
Asana displays a more favorable overall income statement profile, with higher gross margins and positive trends in EBIT and net margin growth in the latest year. Snowflake shows robust revenue expansion but continues to struggle with deep and worsening losses, despite stable gross margins. Asana’s combination of margin strength and improving profitability metrics suggests relatively stronger fundamentals compared to Snowflake’s ongoing net losses and margin pressures.
Financial Ratios Comparison
The table below presents a side-by-side comparison of key financial ratios for Snowflake Inc. and Asana, Inc. based on their most recent fiscal year data (2025).
| Ratios | Snowflake Inc. (SNOW) | Asana, Inc. (ASAN) |
|---|---|---|
| ROE | -42.9% | -112.3% |
| ROIC | -25.2% | -53.0% |
| P/E | -47.0 | -19.2 |
| P/B | 20.1 | 21.5 |
| Current Ratio | 1.75 | 1.44 |
| Quick Ratio | 1.75 | 1.44 |
| D/E (Debt-to-Equity) | 0.90 | 1.18 |
| Debt-to-Assets | 29.7% | 30.1% |
| Interest Coverage | -528.0 | -72.4 |
| Asset Turnover | 0.40 | 0.81 |
| Fixed Asset Turnover | 5.53 | 2.76 |
| Payout Ratio | 0 | 0 |
| Dividend Yield | 0 | 0 |
Interpretation of the Ratios
Snowflake Inc.
Snowflake shows a mixed set of financial ratios with 35.71% favorable and 50% unfavorable. Key concerns include negative net margin (-35.45%) and return on equity (-42.86%), reflecting profitability challenges. The company maintains a solid current ratio (1.75) and manageable debt to assets (29.72%). Snowflake does not pay dividends, likely focusing on growth and reinvestment, without share buybacks.
Asana, Inc.
Asana also exhibits 50% unfavorable ratios with a notably negative return on equity (-112.31%) and net margin (-35.3%), signaling similar profitability issues. It has a weaker current ratio (1.44) but a favorable quick ratio, indicating some liquidity strength. Asana does not pay dividends, suggesting a reinvestment strategy during a high growth phase, with no indication of buybacks.
Which one has the best ratios?
Both Snowflake and Asana have slightly unfavorable overall ratios, sharing profitability weaknesses and zero dividend yields. Snowflake offers better liquidity and lower debt concerns, while Asana shows a more aggressive debt profile and weaker returns. Neither stands out decisively; each presents risks with some favorable aspects.
Strategic Positioning
This section compares the strategic positioning of Snowflake Inc. and Asana, Inc., including their market position, key segments, and exposure to technological disruption:
Snowflake Inc.
- Leading cloud-based data platform with significant market cap and moderate competitive pressure.
- Focused on cloud data consolidation and analytics, driven by product revenues exceeding $3.4B in 2025.
- Operates in advanced cloud software, with potential exposure to rapid technological evolution.
Asana, Inc.
- Work management platform targeting teams and executives across diverse industries.
- Concentrated on workflow orchestration and project management without disclosed product revenue.
- Exposure to technology shifts in collaborative software, serving various sectors internationally.
Snowflake Inc. vs Asana, Inc. Positioning
Snowflake’s approach centers on a diversified cloud data platform generating substantial product revenue, while Asana concentrates on work management software without detailed segment revenues. Snowflake’s scale offers broad industry reach; Asana’s focus targets team collaboration.
Which has the best competitive advantage?
Both companies exhibit very unfavorable MOAT evaluations with declining ROIC trends, indicating value destruction and weak competitive advantages; neither currently demonstrates a sustainable economic moat based on the provided data.
Stock Comparison
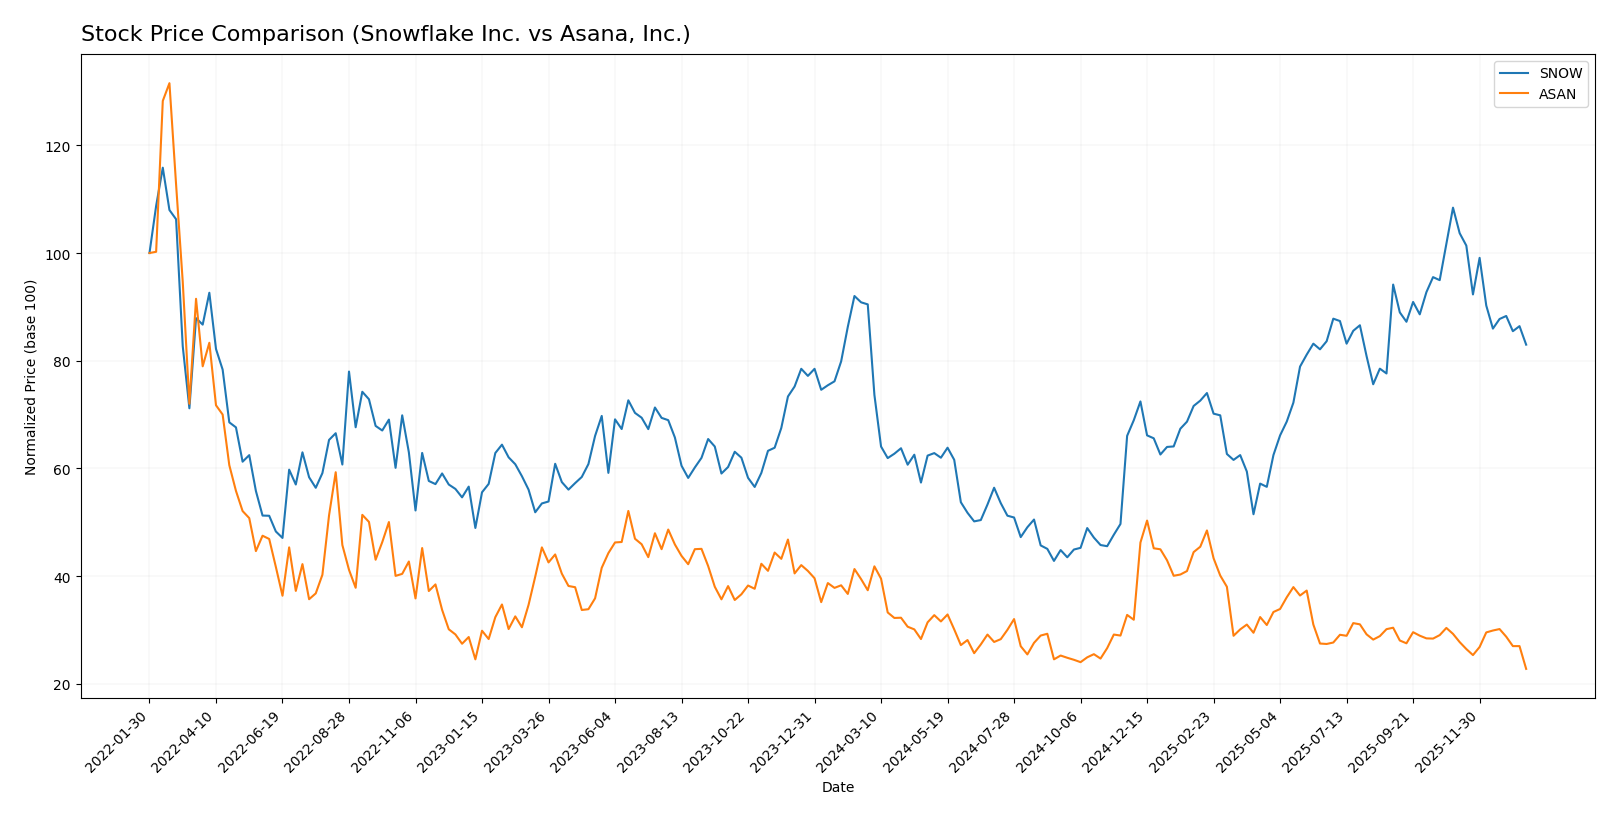
The past year has seen both Snowflake Inc. (SNOW) and Asana, Inc. (ASAN) experience significant bearish trends, with notable price declines and decelerating momentum impacting their trading dynamics.
Trend Analysis
Snowflake Inc. posted an 8.27% price decline over the past 12 months, reflecting a bearish trend with deceleration. The stock showed a high volatility level with a 42.6 standard deviation, peaking at 274.88 and bottoming at 108.56.
Asana, Inc. recorded a sharper 39.07% decrease over the same period, also bearish with deceleration. Its volatility was much lower, with a 2.87 standard deviation, and prices ranged between 24.15 and 10.93.
Comparing trends, Snowflake’s smaller decline indicates better market performance than Asana’s significantly larger loss over the past year.
Target Prices
Analysts present a mixed but generally optimistic target price consensus for Snowflake Inc. and Asana, Inc.
| Company | Target High | Target Low | Consensus |
|---|---|---|---|
| Snowflake Inc. | 325 | 237 | 281.86 |
| Asana, Inc. | 18 | 14 | 15.75 |
The consensus target prices for Snowflake and Asana suggest upside potential of approximately 34% and 44% respectively from their current prices of $210.38 and $10.93, indicating analyst confidence in their growth prospects.
Analyst Opinions Comparison
This section compares analysts’ ratings and grades for Snowflake Inc. and Asana, Inc.:
Rating Comparison
Snowflake Inc. Rating
- Rating: C- with a Very Favorable status
- Discounted Cash Flow Score: 3, considered Moderate
- ROE Score: 1, considered Very Unfavorable
- ROA Score: 1, considered Very Unfavorable
- Debt To Equity Score: 1, considered Very Unfavorable
- Overall Score: 1, considered Very Unfavorable
Asana, Inc. Rating
- Rating: D+ with a Very Favorable status
- Discounted Cash Flow Score: 1, considered Very Unfavorable
- ROE Score: 1, considered Very Unfavorable
- ROA Score: 1, considered Very Unfavorable
- Debt To Equity Score: 1, considered Very Unfavorable
- Overall Score: 1, considered Very Unfavorable
Which one is the best rated?
Snowflake holds a higher rating of C- compared to Asana’s D+, with a moderate discounted cash flow score, while both share equally low scores in other financial metrics and overall score.
Scores Comparison
Here is a comparison of the Altman Z-Score and Piotroski Score for Snowflake Inc. and Asana, Inc.:
SNOW Scores
- Altman Z-Score: 5.36, indicating a safe zone status
- Piotroski Score: 4, categorized as average
ASAN Scores
- Altman Z-Score: -0.27, indicating a distress zone
- Piotroski Score: 4, categorized as average
Which company has the best scores?
Snowflake shows a significantly stronger Altman Z-Score, placing it in the safe zone, while Asana is in the distress zone. Both companies have identical average Piotroski Scores of 4.
Grades Comparison
The following section presents the recent grades issued by reputable financial institutions for Snowflake Inc. and Asana, Inc.:
Snowflake Inc. Grades
This table summarizes the latest grades given by recognized financial firms for Snowflake Inc.:
| Grading Company | Action | New Grade | Date |
|---|---|---|---|
| Barclays | Downgrade | Equal Weight | 2026-01-12 |
| Argus Research | Upgrade | Buy | 2026-01-08 |
| Citigroup | Maintain | Buy | 2025-12-08 |
| Wells Fargo | Maintain | Overweight | 2025-12-04 |
| Keybanc | Maintain | Overweight | 2025-12-04 |
| Piper Sandler | Maintain | Overweight | 2025-12-04 |
| Morgan Stanley | Maintain | Overweight | 2025-12-04 |
| Wedbush | Maintain | Outperform | 2025-12-04 |
| Deutsche Bank | Maintain | Buy | 2025-12-04 |
| Cantor Fitzgerald | Maintain | Overweight | 2025-12-04 |
Snowflake’s grades predominantly show strong buy-side support with several Overweight and Buy ratings, alongside a recent downgrade by Barclays to Equal Weight.
Asana, Inc. Grades
This table summarizes the latest grades given by recognized financial firms for Asana, Inc.:
| Grading Company | Action | New Grade | Date |
|---|---|---|---|
| Citigroup | Upgrade | Buy | 2026-01-15 |
| RBC Capital | Maintain | Underperform | 2026-01-05 |
| Keybanc | Upgrade | Overweight | 2025-12-15 |
| DA Davidson | Maintain | Neutral | 2025-12-04 |
| Citigroup | Maintain | Neutral | 2025-12-03 |
| RBC Capital | Maintain | Underperform | 2025-12-03 |
| UBS | Maintain | Neutral | 2025-12-03 |
| Baird | Maintain | Neutral | 2025-09-04 |
| Morgan Stanley | Maintain | Underweight | 2025-09-04 |
| Piper Sandler | Maintain | Overweight | 2025-09-04 |
Asana’s ratings are more mixed, with a recent upgrade to Buy by Citigroup but several Neutral and Underperform ratings persisting across firms.
Which company has the best grades?
Snowflake Inc. holds a generally stronger consensus with multiple Buy and Overweight ratings, while Asana, Inc. displays a more cautious outlook featuring mixed Neutral and Underperform grades. Investors might interpret Snowflake’s higher grade consistency as reflecting comparatively greater confidence.
Strengths and Weaknesses
Below is a comparative overview of Snowflake Inc. and Asana, Inc. based on key financial and strategic criteria:
| Criterion | Snowflake Inc. (SNOW) | Asana, Inc. (ASAN) |
|---|---|---|
| Diversification | Revenue mainly from cloud data platform products; growing product revenue from $554M in 2021 to $3.46B in 2025 | Narrower product range focused on work management software; limited diversification |
| Profitability | Negative net margin (-35.45%) and ROIC (-25.24%); shedding value; declining profitability | Negative net margin (-35.3%) and ROIC (-53.03%); also shedding value with worsening profitability |
| Innovation | High innovation in cloud data warehousing and analytics, strong product growth | Innovative in workflow management but slower growth and less scale |
| Global presence | Significant global expansion with large enterprise clients | Growing international footprint but smaller scale compared to Snowflake |
| Market Share | Strong presence in cloud data platform market but facing intense competition | Smaller market share in SaaS workflow tools; competitive market |
Key takeaways: Both Snowflake and Asana currently face challenges in profitability and value creation, exhibiting declining ROIC trends. Snowflake benefits from rapid product revenue growth and a broader global presence, while Asana’s narrower diversification and smaller scale limit its competitive position. Caution and risk management are advised when considering investments in these companies.
Risk Analysis
Below is a comparative table of key risks affecting Snowflake Inc. (SNOW) and Asana, Inc. (ASAN) based on the most recent 2025 data:
| Metric | Snowflake Inc. (SNOW) | Asana, Inc. (ASAN) |
|---|---|---|
| Market Risk | Beta 1.14 – moderately volatile | Beta 0.92 – less volatile |
| Debt level | Debt-to-Equity 0.9 – neutral | Debt-to-Equity 1.18 – unfavorable |
| Regulatory Risk | Moderate – US tech regulations | Moderate – US tech regulations |
| Operational Risk | High – negative ROE & margins | High – negative ROE & margins |
| Environmental Risk | Low – software sector typical | Low – software sector typical |
| Geopolitical Risk | Moderate – US and global data policies | Moderate – US and global data policies |
Both companies face significant operational risk due to continued negative profitability and efficiency indicators. Asana’s higher debt level and distress-zone bankruptcy risk elevate its financial vulnerability. Snowflake shows stronger liquidity and a safe zone Altman Z-score but suffers from unfavorable profitability and valuation metrics. Investors should weigh these risks carefully in portfolio decisions.
Which Stock to Choose?
Snowflake Inc. (SNOW) shows strong revenue growth of 29.2% in 2025 and a solid gross margin at 66.5%, but faces unfavorable profitability with a -35.45% net margin and negative returns on equity (-42.86%). Its debt level is moderate and current ratio favorable, yet its overall rating is very favorable despite some weak financial ratios, reflecting mixed financial health.
Asana, Inc. (ASAN) reports slower revenue growth at 10.9% in 2025, but a higher gross margin of 89.3%. Profitability remains weak with a -35.3% net margin and a deeply negative return on equity (-112.31%). Debt metrics are less favorable, and the rating is very favorable overall, though financial ratios indicate challenges similar to SNOW’s.
For investors, SNOW might appear more suitable for those prioritizing growth due to stronger revenue expansion and better financial stability, while ASAN could appeal to investors with tolerance for volatility and a focus on high gross margins. Both companies show value destruction and declining profitability, suggesting cautious interpretation of their ratings and income trends.
Disclaimer: Investment carries a risk of loss of initial capital. The past performance is not a reliable indicator of future results. Be sure to understand risks before making an investment decision.
Go Further
I encourage you to read the complete analyses of Snowflake Inc. and Asana, Inc. to enhance your investment decisions: