In the evolving landscape of software applications, Shopify Inc. and Asana, Inc. stand out as innovators driving digital transformation in commerce and work management. Both companies operate in the technology sector, offering platforms that streamline complex processes for businesses worldwide. Their overlapping markets and distinct innovation strategies make them compelling candidates for comparison. In this article, I will help you identify which company presents the most attractive opportunity for your investment portfolio.
Table of contents
Companies Overview
I will begin the comparison between Shopify and Asana by providing an overview of these two companies and their main differences.
Shopify Overview
Shopify Inc. is a commerce company headquartered in Ottawa, Canada, operating a comprehensive platform that enables merchants to manage, market, and sell products across multiple sales channels worldwide. Its services include inventory management, order processing, payments, fulfillment, and merchant solutions such as financing and shipping. Founded in 2004, Shopify is a key player in the software application industry, with a market cap of 205B USD and over 8,100 employees.
Asana Overview
Asana, Inc., based in San Francisco, USA, offers a work management platform designed to help teams coordinate tasks and strategic initiatives. Serving industries like technology, healthcare, and finance, Asana supports daily task management through to organization-wide goal setting. Established in 2008, the company operates in the software application sector, with a market cap of 2.7B USD and approximately 1,819 employees.
Key similarities and differences
Both Shopify and Asana operate in the software application industry, providing platforms that enhance business operations through technology. Shopify focuses on commerce solutions enabling product sales and merchant services, while Asana specializes in workflow and project management for diverse organizational needs. The companies differ significantly in scale, with Shopify’s market cap and employee count far exceeding Asana’s, reflecting distinct market positions and business scopes.
Income Statement Comparison
This table compares the key income statement metrics of Shopify Inc. and Asana, Inc. for their most recent fiscal years, offering a snapshot of their financial performance.

| Metric | Shopify Inc. (SHOP) | Asana, Inc. (ASAN) |
|---|---|---|
| Market Cap | 205.2B | 2.67B |
| Revenue | 8.88B | 724M |
| EBITDA | 1.34B | -230M |
| EBIT | 1.30B | -247M |
| Net Income | 2.02B | -256M |
| EPS | 1.56 | -1.11 |
| Fiscal Year | 2024 | 2025 |
Income Statement Interpretations
Shopify Inc.
Shopify Inc. has demonstrated strong revenue growth, increasing from $2.9B in 2020 to $8.9B in 2024, with net income rising significantly from $320M to $2.0B over the same period. Margins have improved notably, with a gross margin of 50.36% and net margin of 22.74% in 2024, reflecting operational efficiency. The recent year showed robust growth with revenue up 25.8% and net income surging over 1100%, indicating a strong rebound and margin expansion.
Asana, Inc.
Asana’s revenue grew steadily from $227M in 2021 to $724M in 2025, with a 10.9% increase in the latest year, but net losses persisted, totaling -$256M in 2025. The gross margin remains high at 89.3%, yet EBIT and net margins are negative at -34.1% and -35.3%, respectively, signaling ongoing profitability challenges. Despite these losses, Asana has managed modest improvements in net margin and EPS growth recently.
Which one has the stronger fundamentals?
Shopify shows stronger fundamentals with consistent positive net income growth, expanding margins, and favorable income statement metrics across the board. Asana, while exhibiting solid revenue and gross margin growth, continues to report net losses and negative operating margins, reflecting higher risk. Shopify’s scale, profitability, and margin improvements present a more favorable income statement profile compared to Asana’s current financial performance.
Financial Ratios Comparison
The table below presents a side-by-side comparison of key financial ratios for Shopify Inc. (SHOP) and Asana, Inc. (ASAN) based on their most recent fiscal year data.
| Ratios | Shopify Inc. (2024) | Asana, Inc. (2025) |
|---|---|---|
| ROE | 17.47% | -112.31% |
| ROIC | 7.55% | -53.03% |
| P/E | 68.18 | -19.16 |
| P/B | 11.91 | 21.52 |
| Current Ratio | 3.71 | 1.44 |
| Quick Ratio | 3.70 | 1.44 |
| D/E (Debt-to-Equity) | 0.10 | 1.18 |
| Debt-to-Assets | 8.09% | 30.11% |
| Interest Coverage | 0 | -72.42 |
| Asset Turnover | 0.64 | 0.81 |
| Fixed Asset Turnover | 63.43 | 2.76 |
| Payout ratio | 0 | 0 |
| Dividend yield | 0 | 0 |
Interpretation of the Ratios
Shopify Inc.
Shopify’s financial ratios reveal a generally solid performance with a favorable net margin of 22.74% and return on equity at 17.47%, indicating efficient profitability and shareholder value creation. However, concerns arise from an elevated price-to-earnings ratio of 68.18 and a high price-to-book ratio of 11.91, suggesting the stock may be overvalued. The company does not pay dividends, reflecting a reinvestment strategy focused on growth and innovation rather than immediate shareholder returns.
Asana, Inc.
Asana’s ratios point to ongoing financial challenges, with a deeply negative net margin of -35.3% and an unfavorable return on equity of -112.31%, highlighting significant losses and capital inefficiency. The company shows a low current ratio of 1.44, indicating moderate liquidity, but carries a high debt-to-equity ratio of 1.18, which may raise solvency concerns. Asana does not pay dividends, consistent with its current negative profitability and prioritization of reinvestment in research and development.
Which one has the best ratios?
Evaluating the two, Shopify exhibits a more favorable ratio profile with higher profitability and stronger returns despite some valuation concerns. Asana’s ratios are mostly unfavorable, reflecting its ongoing losses and higher financial risk. Overall, Shopify’s financial metrics are stronger and suggest more stability compared to Asana’s current operating and financial performance.
Strategic Positioning
This section compares the strategic positioning of Shopify Inc. and Asana, Inc., focusing on market position, key segments, and exposure to technological disruption:
Shopify Inc.
- Leading commerce platform with significant global scale; faces competitive pressure in e-commerce software.
- Key segments include Merchant Solutions and Subscription Solutions driving revenue growth.
- Exposure to technological disruption through evolving e-commerce platforms and payment solutions.
Asana, Inc.
- Operates a work management platform serving diverse industries; competes in productivity software market.
- Focuses on work orchestration for teams, covering tasks to strategic initiatives across industries.
- Faces disruption risks in work management tools and integration with enterprise software ecosystems.
Shopify Inc. vs Asana, Inc. Positioning
Shopify exhibits a diversified revenue base with services and subscription products across global commerce channels, while Asana concentrates on work management software for varied sectors. Shopify’s broad platform reach contrasts with Asana’s focused team collaboration tools, reflecting different strategic scopes.
Which has the best competitive advantage?
Both companies are currently shedding value relative to their cost of capital. Shopify shows a slightly unfavorable moat with improving profitability, while Asana faces a very unfavorable moat with declining returns, indicating Shopify currently holds a relatively stronger competitive advantage.
Stock Comparison
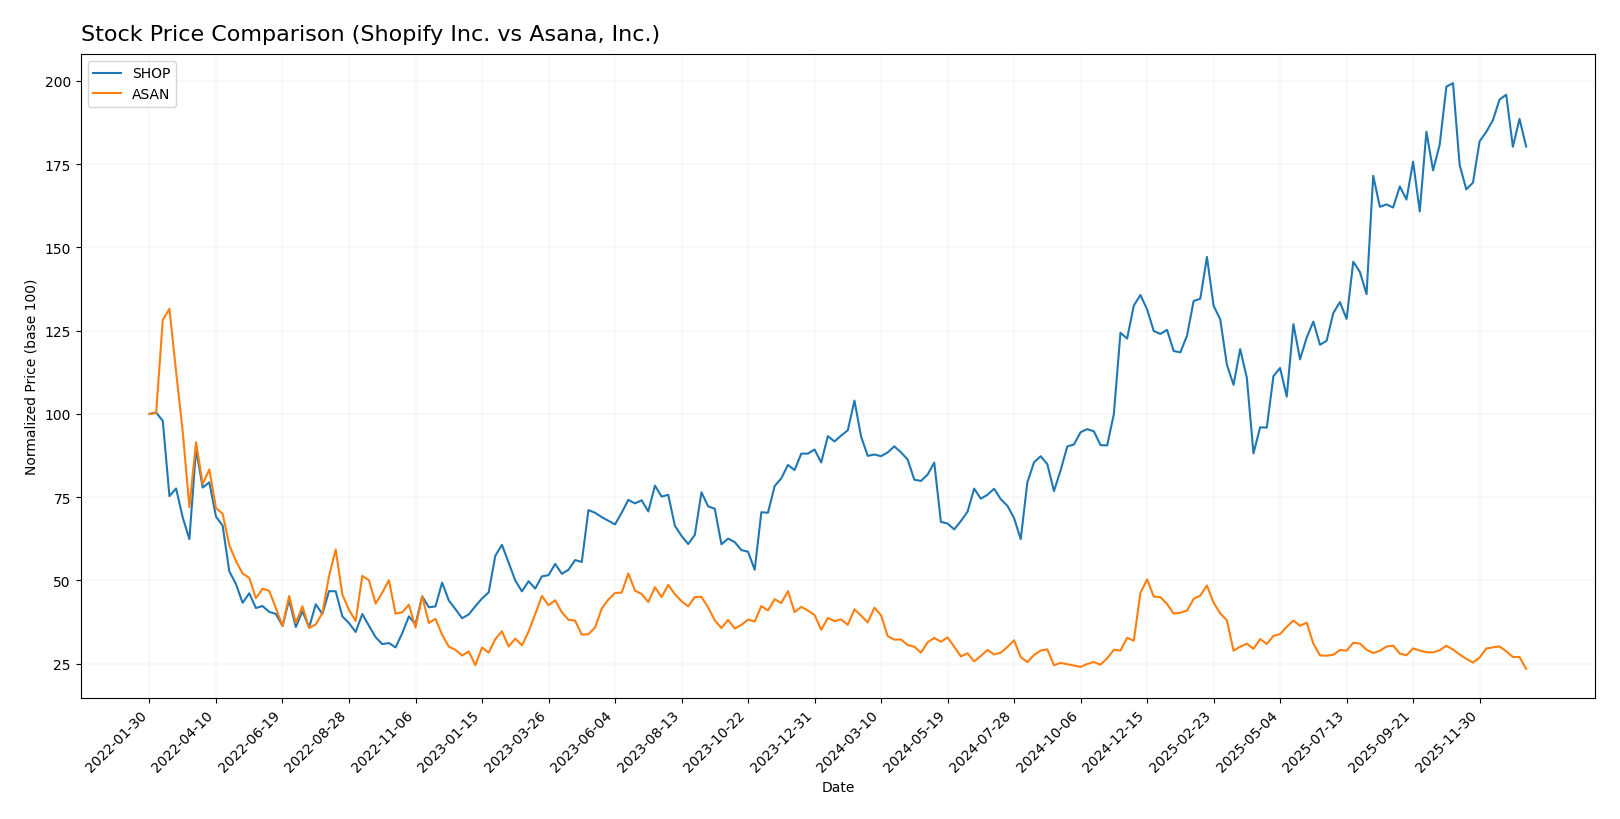
The stock price chart captures significant divergences in trading performance over the past 12 months, with Shopify Inc. exhibiting a strong upward momentum despite recent deceleration, while Asana, Inc. has shown a marked downward trajectory.
Trend Analysis
Shopify Inc. demonstrated a bullish trend over the past year with a 106.27% price increase, although the momentum has decelerated recently amid a 9.55% drop from November 2025 to January 2026. The stock’s volatility is notable, with a standard deviation of 33.7.
Asana, Inc. experienced a bearish trend overall, falling 37.29% in the year analyzed, with continued deceleration. Its recent performance worsened by 19.93%, reflecting a slight increase in downward pressure and lower volatility at 2.86 standard deviation.
Comparing both stocks, Shopify has delivered the highest market performance with a substantial price gain, contrasting sharply with Asana’s sustained losses and weaker volume dynamics.
Target Prices
The current analyst consensus provides clear target price ranges for Shopify Inc. and Asana, Inc.
| Company | Target High | Target Low | Consensus |
|---|---|---|---|
| Shopify Inc. | 200 | 140 | 186.24 |
| Asana, Inc. | 18 | 14 | 15.75 |
Analysts expect Shopify’s stock to appreciate from its current price of $157.6 toward the consensus of $186.24, indicating moderate upside potential. Asana’s consensus target of $15.75 also suggests a positive outlook compared to its current price of $11.28.
Analyst Opinions Comparison
This section compares analysts’ ratings and grades for Shopify Inc. and Asana, Inc.:
Rating Comparison
Shopify Inc. Rating
- Rating: B, indicating a very favorable overall evaluation by analysts.
- Discounted Cash Flow Score: Moderate score of 3, suggesting a balanced valuation view.
- ROE Score: Favorable score of 4, showing efficient profit generation from equity.
- ROA Score: Very favorable score of 5, reflecting effective asset utilization.
- Debt To Equity Score: Moderate score of 3, indicating a reasonable financial risk.
Asana, Inc. Rating
- Rating: D+, reflecting a very unfavorable evaluation by analysts.
- Discounted Cash Flow Score: Very unfavorable score of 1, indicating overvaluation concerns.
- ROE Score: Very unfavorable score of 1, indicating poor equity profitability.
- ROA Score: Very unfavorable score of 1, showing weak asset earnings.
- Debt To Equity Score: Very unfavorable score of 1, suggesting high financial risk.
Which one is the best rated?
Based on the provided data, Shopify Inc. is clearly the better rated company, with generally moderate to very favorable scores across key financial metrics, whereas Asana, Inc. shows consistently very unfavorable ratings and scores.
Scores Comparison
The following table compares the Altman Z-Score and Piotroski Score for Shopify Inc. and Asana, Inc.:
SHOP Scores
- Altman Z-Score: 50.42, indicating a strong safe zone rating.
- Piotroski Score: 6, reflecting an average financial strength.
ASAN Scores
- Altman Z-Score: -0.27, placing the company in distress zone.
- Piotroski Score: 4, also indicating average financial strength.
Which company has the best scores?
Based on the provided data, Shopify has a significantly higher Altman Z-Score, placing it in a safe financial zone versus Asana’s distress zone. Both companies have average Piotroski Scores, with Shopify slightly higher than Asana.
Grades Comparison
I compare the recent grades and rating consensus from recognized grading companies for Shopify Inc. and Asana, Inc.:
Shopify Inc. Grades
This table summarizes recent actionable grades assigned by reputable financial institutions for Shopify Inc.
| Grading Company | Action | New Grade | Date |
|---|---|---|---|
| Scotiabank | Upgrade | Sector Outperform | 2026-01-08 |
| Wolfe Research | Downgrade | Peer Perform | 2026-01-06 |
| Wells Fargo | Maintain | Overweight | 2025-12-17 |
| Truist Securities | Maintain | Hold | 2025-11-05 |
| CIBC | Maintain | Outperform | 2025-11-05 |
| Cantor Fitzgerald | Maintain | Neutral | 2025-11-05 |
| DA Davidson | Maintain | Buy | 2025-11-05 |
| Scotiabank | Maintain | Sector Perform | 2025-11-05 |
| Needham | Maintain | Buy | 2025-11-05 |
| JP Morgan | Maintain | Overweight | 2025-11-05 |
Shopify’s grades predominantly range from Hold to Outperform, with recent upgrades and a consensus rating of Buy.
Asana, Inc. Grades
This table summarizes recent actionable grades assigned by reputable financial institutions for Asana, Inc.
| Grading Company | Action | New Grade | Date |
|---|---|---|---|
| Citigroup | Upgrade | Buy | 2026-01-15 |
| RBC Capital | Maintain | Underperform | 2026-01-05 |
| Keybanc | Upgrade | Overweight | 2025-12-15 |
| DA Davidson | Maintain | Neutral | 2025-12-04 |
| Citigroup | Maintain | Neutral | 2025-12-03 |
| RBC Capital | Maintain | Underperform | 2025-12-03 |
| UBS | Maintain | Neutral | 2025-12-03 |
| Baird | Maintain | Neutral | 2025-09-04 |
| Morgan Stanley | Maintain | Underweight | 2025-09-04 |
| Piper Sandler | Maintain | Overweight | 2025-09-04 |
Asana’s grades show mixed opinions, with upgrades to Buy and Overweight contrasting maintained Underperform and Neutral ratings; the consensus rating is Buy.
Which company has the best grades?
Shopify holds a stronger overall grade profile, with multiple Outperform and Overweight ratings and a stable Buy consensus, whereas Asana presents a more mixed outlook with underperformance ratings offset by some upgrades. This divergence may influence investor confidence differently depending on risk tolerance and portfolio strategy.
Strengths and Weaknesses
Below is a comparison of key strengths and weaknesses of Shopify Inc. and Asana, Inc. based on the most recent financial and strategic data.
| Criterion | Shopify Inc. | Asana, Inc. |
|---|---|---|
| Diversification | Strong revenue streams: Services (6.53B USD), Subscriptions (2.35B USD) | Limited product diversification, focused on collaborative work software |
| Profitability | Favorable net margin (22.74%) and ROE (17.47%), but ROIC below WACC (7.55% vs 17.1%) | Negative net margin (-35.3%) and ROE (-112.31%), ROIC highly negative (-53.03%) |
| Innovation | Growing ROIC trend indicates improving efficiency and innovation | Declining ROIC trend signals challenges in innovation and value creation |
| Global presence | Significant global footprint through merchant and subscription solutions | More niche market presence, less global scale than Shopify |
| Market Share | Strong in e-commerce platform market, expanding merchant solutions | Smaller share in project management software, facing intense competition |
Key takeaways: Shopify demonstrates strong profitability and diversification with improving efficiency despite current value destruction, suggesting potential for recovery. Asana struggles with declining profitability and value loss, signaling higher investment risk and need for substantial operational improvements.
Risk Analysis
Below is a comparative table highlighting key risks for Shopify Inc. (SHOP) and Asana, Inc. (ASAN) based on the most recent data available in 2026:
| Metric | Shopify Inc. (SHOP) | Asana, Inc. (ASAN) |
|---|---|---|
| Market Risk | High beta at 2.84 indicating significant price volatility | Moderate beta at 0.92 indicating lower volatility |
| Debt level | Low debt-to-equity ratio of 0.1, low debt-to-assets 8.1% | High debt-to-equity ratio at 1.18, moderate debt-to-assets 30.1% |
| Regulatory Risk | Moderate, operating globally with exposure to multiple jurisdictions | Moderate, US-based but serving multiple industries with regulatory scrutiny |
| Operational Risk | Medium; platform complexity with 8.1K employees and global operations | Medium; smaller scale with 1.8K employees but reliant on continuous innovation |
| Environmental Risk | Low; primarily software business with limited physical footprint | Low; software-based with minimal direct environmental impact |
| Geopolitical Risk | Moderate; global presence exposes it to geopolitical tensions | Low to moderate; primarily US operations but international clients |
Synthesizing these risks, Shopify’s most impactful risks are market volatility and regulatory exposure due to its global footprint, although it maintains a very strong balance sheet with low debt and a high Altman Z-Score indicating financial stability. Asana faces higher financial risk with its elevated debt levels and is currently in the distress zone per Altman Z-Score, making its financial health more vulnerable. Its market risk is lower but operational and debt risks are significant concerns for investors.
Which Stock to Choose?
Shopify Inc. (SHOP) has shown a strong income evolution with 25.78% revenue growth in 2024, favorable profitability ratios like 22.74% net margin, and a solid return on equity of 17.47%. Its debt levels are low with a debt-to-equity ratio of 0.1, and it holds a very favorable B rating, reflecting solid financial health despite some unfavorable valuation ratios.
Asana, Inc. (ASAN) exhibits moderate revenue growth of 10.94% in 2025 but suffers from unfavorable profitability with a net margin of -35.3% and negative returns on equity and invested capital. Its debt is higher with a debt-to-equity ratio of 1.18, and it carries a D+ rating indicating significant financial challenges and risk.
Investors focused on growth and financial stability may find Shopify’s favorable rating and improving income statement more appealing, while those with higher risk tolerance or seeking turnaround potential might consider Asana’s profile, despite its unfavorable ratios and weaker rating.
Disclaimer: Investment carries a risk of loss of initial capital. The past performance is not a reliable indicator of future results. Be sure to understand risks before making an investment decision.
Go Further
I encourage you to read the complete analyses of Shopify Inc. and Asana, Inc. to enhance your investment decisions: