In today’s dynamic tech landscape, Salesforce, Inc. (CRM) and Asana, Inc. (ASAN) stand out as influential players in the software application industry. Both companies specialize in tools that enhance organizational efficiency and collaboration, yet they differ significantly in scale, market presence, and innovation approaches. This comparison will help investors understand which company offers the most compelling opportunity in 2026. Let’s explore which stock deserves a place in your portfolio.
Table of contents
Companies Overview
I will begin the comparison between Salesforce and Asana by providing an overview of these two companies and their main differences.
Salesforce Overview
Salesforce, Inc. is a leading provider of customer relationship management (CRM) technology that connects companies with their customers globally. Its comprehensive Customer 360 platform supports sales, service, marketing, commerce, and analytics, with solutions designed for various industries. Headquartered in San Francisco, Salesforce employs over 76K staff and integrates tools like Slack, Tableau, and MuleSoft to enhance enterprise connectivity and customer engagement.
Asana Overview
Asana, Inc. operates a work management platform that helps teams coordinate tasks and strategic initiatives across multiple industries, including technology and healthcare. Founded in 2008 and based in San Francisco, Asana focuses on improving team productivity and goal alignment through its software. The company has a smaller workforce of around 1.8K employees and serves diverse sectors with solutions for managing everything from daily tasks to complex projects.
Key similarities and differences
Both Salesforce and Asana are US-based technology firms listed on the NYSE, specializing in software applications aimed at improving business operations. Salesforce has a significantly larger market cap and a broader product suite encompassing CRM, marketing, and analytics, while Asana concentrates on work management and team collaboration. Salesforce’s extensive scale and multi-industry reach contrast with Asana’s more focused platform and smaller organizational size.
Income Statement Comparison
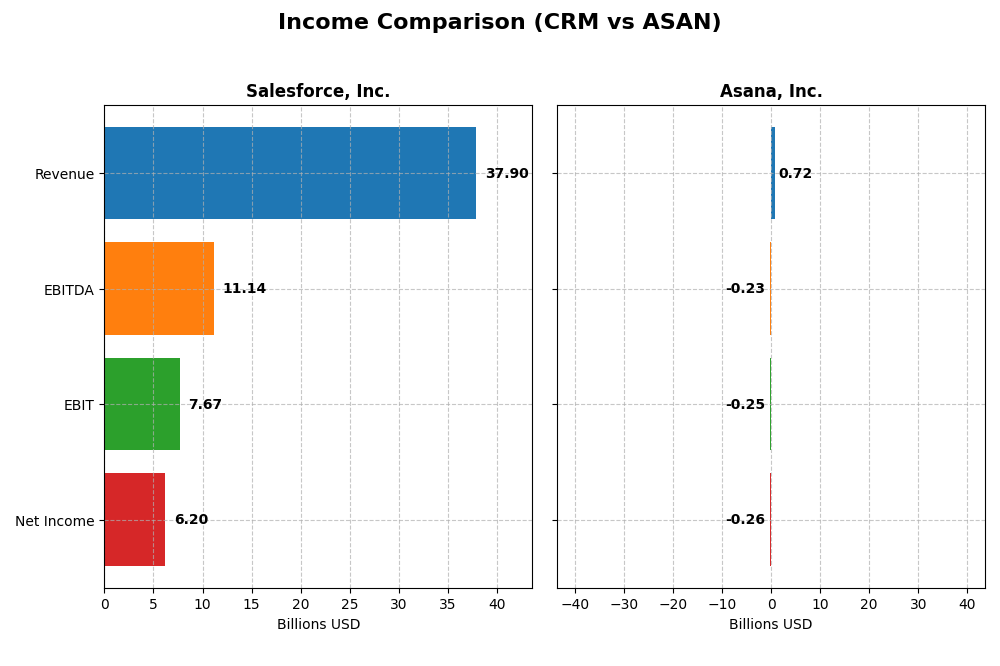
This table compares key income statement metrics for Salesforce, Inc. and Asana, Inc. for the fiscal year 2025, illustrating differences in scale and profitability.
| Metric | Salesforce, Inc. (CRM) | Asana, Inc. (ASAN) |
|---|---|---|
| Market Cap | 219B | 2.7B |
| Revenue | 37.9B | 724M |
| EBITDA | 11.1B | -230M |
| EBIT | 7.67B | -247M |
| Net Income | 6.20B | -256M |
| EPS | 6.44 | -1.11 |
| Fiscal Year | 2025 | 2025 |
Income Statement Interpretations
Salesforce, Inc.
Salesforce experienced consistent revenue growth from 21B in 2021 to 37.9B in 2025, with net income rising from 4.07B to 6.2B over the same period. Gross and EBIT margins remained favorable, with the net margin near 16% in 2025. The latest year showed revenue growth of 8.7%, EBIT up 27.8%, and EPS growth exceeding 50%, indicating improved profitability despite a slight net margin contraction over five years.
Asana, Inc.
Asana’s revenue expanded rapidly from 227M in 2021 to 724M in 2025, but net income remained negative, though losses narrowed from -212M to -256M. The company maintained a high gross margin near 89%, but EBIT and net margins were significantly negative at -34.1% and -35.3%, respectively. In 2025, revenue and gross profit grew nearly 11%, with modest EPS improvement, reflecting ongoing investment in growth despite persistent losses.
Which one has the stronger fundamentals?
Salesforce demonstrates stronger fundamentals with sustained revenue and net income growth, favorable margins, and significant earnings improvements, despite a slight decline in net margin over five years. Asana shows impressive top-line expansion and gross margin strength but continues to report losses and negative operating margins. Salesforce’s overall income statement profile is more robust and stable compared to Asana’s growth-focused yet unprofitable performance.
Financial Ratios Comparison
Below is a comparison of key financial ratios for Salesforce, Inc. (CRM) and Asana, Inc. (ASAN) for the fiscal year 2025, reflecting their latest reported data.
| Ratios | Salesforce, Inc. (CRM) | Asana, Inc. (ASAN) |
|---|---|---|
| ROE | 10.13% | -112.31% |
| ROIC | 7.95% | -53.03% |
| P/E | 53.04 | -19.16 |
| P/B | 5.37 | 21.52 |
| Current Ratio | 1.06 | 1.44 |
| Quick Ratio | 1.06 | 1.44 |
| D/E (Debt-to-Equity) | 0.19 | 1.18 |
| Debt-to-Assets | 11.07% | 30.11% |
| Interest Coverage | 26.49 | -72.42 |
| Asset Turnover | 0.37 | 0.81 |
| Fixed Asset Turnover | 7.03 | 2.76 |
| Payout Ratio | 24.80% | 0% |
| Dividend Yield | 0.47% | 0% |
Interpretation of the Ratios
Salesforce, Inc.
Salesforce shows a slight overall favorability in its financial ratios, with strong interest coverage (28.18) and low debt-to-equity (0.19), indicating sound financial stability. However, its high price-to-earnings ratio (53.04) and price-to-book ratio (5.37) are less favorable, suggesting valuation concerns. The dividend yield is low at 0.47%, reflecting a modest shareholder return in dividends.
Asana, Inc.
Asana’s ratios reveal significant challenges, with unfavorable net margin (-35.3%) and return on equity (-112.31%), evidencing poor profitability and efficiency. Debt-to-equity is high at 1.18, signaling greater leverage risk. The company does not pay dividends, likely due to its negative earnings and focus on growth and reinvestment, as seen in its unfavorable dividend yield of 0%.
Which one has the best ratios?
Salesforce exhibits a more balanced and stable financial profile, with several favorable ratios and moderate risks, while Asana struggles with profitability and leverage issues. Salesforce’s overall ratio evaluation is slightly favorable versus Asana’s slightly unfavorable, indicating Salesforce currently presents stronger financial metrics.
Strategic Positioning
This section compares the strategic positioning of Salesforce, Inc. and Asana, Inc., focusing on their market position, key segments, and exposure to technological disruption:
Salesforce, Inc.
- Leading market position with significant competitive pressure in software applications.
- Diverse revenue streams from Sales, Service, Marketing, Commerce, Integration, and Analytics.
- Exposed to technological disruption with evolving cloud, analytics, and integration services.
Asana, Inc.
- Smaller market cap, facing competition in work management platforms.
- Focused on work management platform for teams and executives.
- Exposure to disruption in collaborative work software and project management tools.
Salesforce, Inc. vs Asana, Inc. Positioning
Salesforce has a diversified business model across multiple cloud-based segments, offering broad industry solutions. Asana concentrates on work management software with a narrower product focus, limiting its market reach but specializing in team collaboration.
Which has the best competitive advantage?
Salesforce’s moat is slightly unfavorable with growing profitability, indicating improving efficiency despite value shedding. Asana’s moat is very unfavorable with declining profitability, showing greater challenges in sustaining a competitive advantage.
Stock Comparison
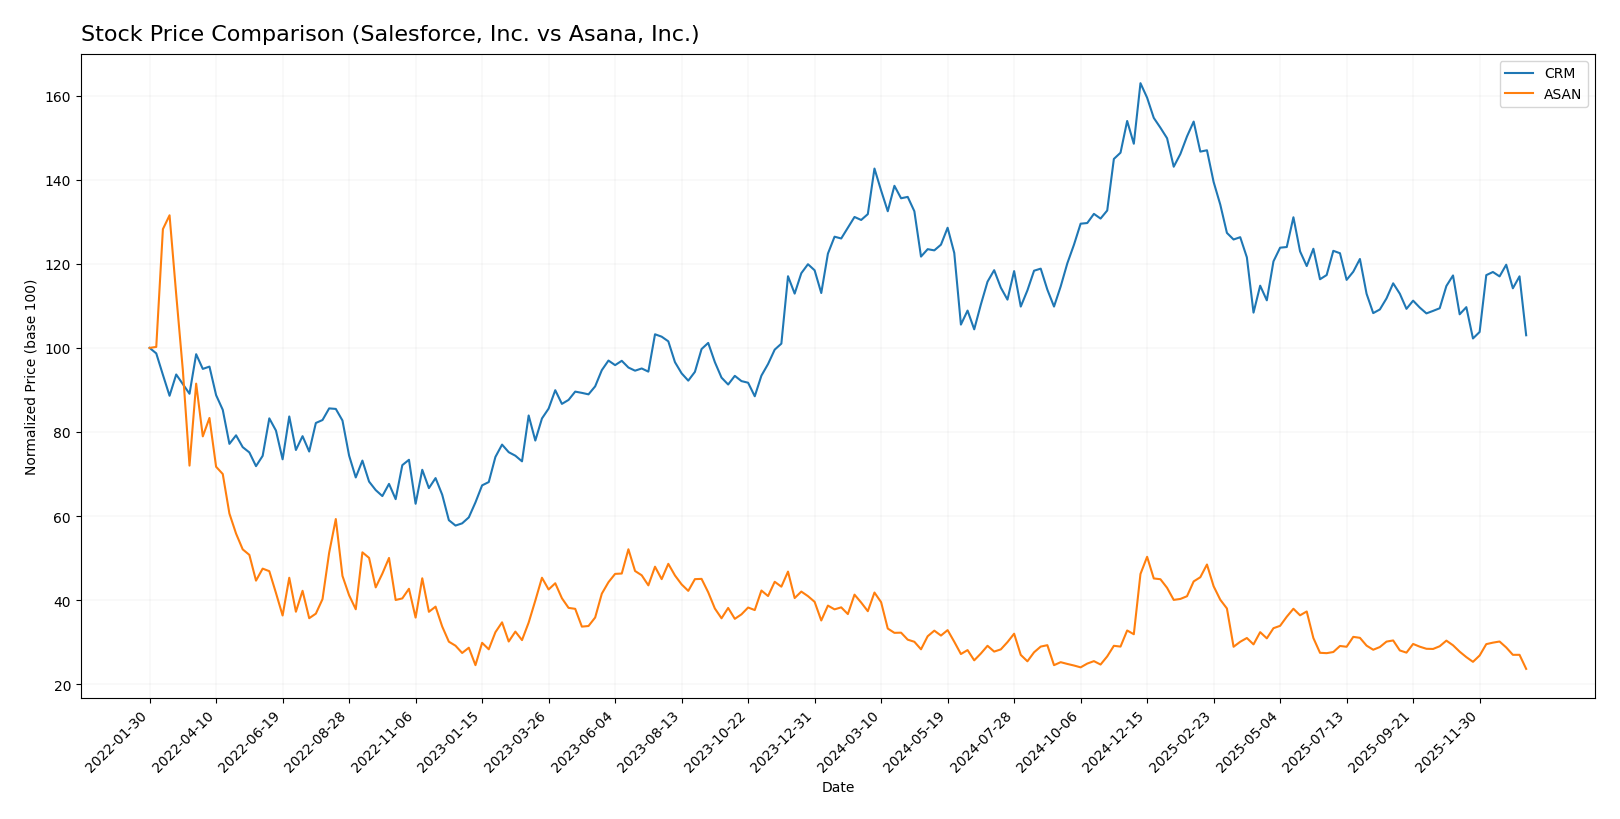
The stock price chart highlights notable bearish trends for both Salesforce, Inc. and Asana, Inc. over the past 12 months, with significant price declines and distinct trading volume dynamics shaping their performance.
Trend Analysis
Salesforce, Inc. (CRM) experienced a bearish trend over the last 12 months with a price decline of -21.86%, showing trend acceleration and high volatility with a standard deviation of 31.79. The recent period shows some deceleration with a -12.14% drop.
Asana, Inc. (ASAN) showed a more pronounced bearish trend, losing -36.71% over the same period, but with deceleration and low volatility at 2.86 standard deviation. Its recent trend remains negative at -19.18%.
Comparing both stocks, Salesforce delivered the higher market performance despite its bearish trend, with a smaller percentage decline compared to Asana’s steeper losses in the past year.
Target Prices
The current target price consensus for Salesforce, Inc. and Asana, Inc. reflects a generally bullish outlook from analysts.
| Company | Target High | Target Low | Consensus |
|---|---|---|---|
| Salesforce, Inc. | 400 | 250 | 324.17 |
| Asana, Inc. | 18 | 14 | 15.75 |
Analysts expect Salesforce’s stock to appreciate significantly from its current price of 228.77, while Asana’s consensus target price of 15.75 suggests moderate upside from its current 11.36.
Analyst Opinions Comparison
This section compares analysts’ ratings and grades for Salesforce, Inc. and Asana, Inc.:
Rating Comparison
Salesforce, Inc. Rating
- Rating: B+, classified as Very Favorable.
- Discounted Cash Flow Score: 4, a Favorable score.
- ROE Score: 4, indicating strong profit efficiency.
- ROA Score: 4, showing effective asset utilization.
- Debt to Equity Score: 3, reflecting moderate financial risk.
- Overall Score: 3, a Moderate rating overall.
Asana, Inc. Rating
- Rating: D+, classified as Very Unfavorable.
- Discounted Cash Flow Score: 1, Very Unfavorable.
- ROE Score: 1, indicating poor profit efficiency.
- ROA Score: 1, showing ineffective asset use.
- Debt to Equity Score: 1, indicating high financial risk.
- Overall Score: 1, a Very Unfavorable rating overall.
Which one is the best rated?
Salesforce holds a significantly stronger position with a B+ rating and multiple Favorable scores, while Asana’s D+ rating and uniformly Very Unfavorable scores indicate weaker financial health and higher risk.
Scores Comparison
Here is a comparison of the Altman Z-Score and Piotroski Score for Salesforce, Inc. and Asana, Inc.:
Salesforce Scores
- Altman Z-Score: 5.26, indicating a safe zone with low bankruptcy risk.
- Piotroski Score: 7, reflecting strong financial health.
Asana Scores
- Altman Z-Score: -0.27, indicating distress zone and high bankruptcy risk.
- Piotroski Score: 4, reflecting average financial health.
Which company has the best scores?
Salesforce shows a significantly higher Altman Z-Score and a stronger Piotroski Score compared to Asana. Based strictly on these scores, Salesforce demonstrates better financial stability and health.
Grades Comparison
Here is a comparison of the latest available grades from verified grading companies for Salesforce, Inc. and Asana, Inc.:
Salesforce, Inc. Grades
The following table summarizes recent grades assigned to Salesforce, Inc. by reputable financial institutions:
| Grading Company | Action | New Grade | Date |
|---|---|---|---|
| Barclays | Maintain | Overweight | 2026-01-12 |
| RBC Capital | Maintain | Sector Perform | 2026-01-05 |
| Morgan Stanley | Maintain | Overweight | 2025-12-09 |
| Citigroup | Maintain | Neutral | 2025-12-08 |
| DA Davidson | Maintain | Neutral | 2025-12-05 |
| Citizens | Maintain | Market Outperform | 2025-12-04 |
| Deutsche Bank | Maintain | Buy | 2025-12-04 |
| Wedbush | Maintain | Outperform | 2025-12-04 |
| Northland Capital Markets | Maintain | Market Perform | 2025-12-04 |
| Canaccord Genuity | Maintain | Buy | 2025-12-04 |
Salesforce’s grades consistently range from Neutral to Buy/Outperform, reflecting a stable and generally positive analyst outlook.
Asana, Inc. Grades
Here is a summary of recent grades assigned to Asana, Inc. by recognized financial analysts:
| Grading Company | Action | New Grade | Date |
|---|---|---|---|
| Citigroup | Upgrade | Buy | 2026-01-15 |
| RBC Capital | Maintain | Underperform | 2026-01-05 |
| Keybanc | Upgrade | Overweight | 2025-12-15 |
| DA Davidson | Maintain | Neutral | 2025-12-04 |
| Citigroup | Maintain | Neutral | 2025-12-03 |
| RBC Capital | Maintain | Underperform | 2025-12-03 |
| UBS | Maintain | Neutral | 2025-12-03 |
| Baird | Maintain | Neutral | 2025-09-04 |
| Morgan Stanley | Maintain | Underweight | 2025-09-04 |
| Piper Sandler | Maintain | Overweight | 2025-09-04 |
Asana’s grades show a mixed picture with recent upgrades but also several Underperform and Neutral ratings, indicating a more cautious analyst stance.
Which company has the best grades?
Salesforce, Inc. holds the stronger and more consistent grades compared to Asana, Inc., which exhibits a wider range of opinions including some underperform ratings. This suggests Salesforce is viewed more favorably by the analyst community, potentially offering investors greater confidence but still requiring careful evaluation of market conditions.
Strengths and Weaknesses
Below is a comparative overview of key strengths and weaknesses for Salesforce, Inc. (CRM) and Asana, Inc. (ASAN) based on the most recent financial and operational data.
| Criterion | Salesforce, Inc. (CRM) | Asana, Inc. (ASAN) |
|---|---|---|
| Diversification | Highly diversified revenue streams across multiple cloud services and professional services | Limited product segmentation, mainly focused on workflow management software |
| Profitability | Positive net margin (16.35%), neutral ROIC (7.95%), slightly favorable overall ratios | Negative net margin (-35.3%), negative ROIC (-53.03%), unfavorable overall financial health |
| Innovation | Strong innovation evidenced by growing ROIC trend and expanding product segments | Declining ROIC trend suggests struggles in innovation and profitability |
| Global presence | Extensive global presence supported by broad cloud service offerings | More limited global footprint and market penetration |
| Market Share | Leading market share in CRM and cloud services with significant revenue growth | Smaller market share with slower growth and financial challenges |
Key takeaways: Salesforce demonstrates strong diversification and growing profitability despite slightly unfavorable value creation, whereas Asana faces significant profitability challenges and declining returns. Salesforce’s broader global presence and product innovation provide a more stable and attractive investment profile, while Asana requires caution due to its weak financial metrics and value destruction.
Risk Analysis
Below is a comparative table of key risks for Salesforce, Inc. (CRM) and Asana, Inc. (ASAN) based on the most recent 2025 data:
| Metric | Salesforce, Inc. (CRM) | Asana, Inc. (ASAN) |
|---|---|---|
| Market Risk | Moderate (Beta 1.27) | Lower (Beta 0.92) |
| Debt Level | Low (Debt/Equity 0.19) | High (Debt/Equity 1.18) |
| Regulatory Risk | Moderate (US Tech sector sensitive) | Moderate (US Tech sector sensitive) |
| Operational Risk | Moderate (Large scale operations, 76K employees) | Higher (Smaller scale, 1.8K employees, growth phase) |
| Environmental Risk | Low (Tech industry, proactive ESG policies) | Low (Tech industry, emerging policies) |
| Geopolitical Risk | Moderate (Global presence) | Moderate (Global presence) |
Salesforce’s moderate market risk and low debt reduce financial distress risks, with a strong Altman Z-score indicating solid stability. Asana faces higher operational and financial risks, reflected in its distress zone Altman Z-score and significant debt, making it more vulnerable to market fluctuations and financial stress. Investors should weigh Salesforce’s stability against Asana’s growth potential tempered by elevated risks.
Which Stock to Choose?
Salesforce, Inc. (CRM) shows a favorable income evolution with strong revenue and net income growth over 2021-2025. Its financial ratios are slightly favorable, highlighting good profitability and low debt, supported by a very favorable B+ rating. However, its economic moat status is slightly unfavorable, indicating some value destruction despite increasing profitability.
Asana, Inc. (ASAN) experiences favorable revenue growth but negative net income trends and low profitability metrics. Its financial ratios are slightly unfavorable with significant debt and poor returns, reflected in a very unfavorable overall rating of D+. The company’s economic moat is very unfavorable, showing declining profitability and consistent value destruction.
Investors seeking stability and moderate profitability might find Salesforce’s profile more aligned with their goals, given its solid rating and favorable income metrics. Conversely, those with a higher risk tolerance and a growth focus could interpret Asana’s rapid revenue growth as a potential opportunity despite its current financial challenges.
Disclaimer: Investment carries a risk of loss of initial capital. The past performance is not a reliable indicator of future results. Be sure to understand risks before making an investment decision.
Go Further
I encourage you to read the complete analyses of Salesforce, Inc. and Asana, Inc. to enhance your investment decisions: