In the dynamic world of technology, PTC Inc. and Asana, Inc. stand out as influential players in the software application industry. PTC focuses on advanced product lifecycle management and digital transformation solutions, while Asana specializes in work management platforms that streamline team collaboration. Their overlapping market presence and innovation-driven strategies make this comparison essential. Join me as we explore which company offers the most compelling investment opportunity today.
Table of contents
Companies Overview
I will begin the comparison between PTC Inc. and Asana, Inc. by providing an overview of these two companies and their main differences.
PTC Inc. Overview
PTC Inc. is a software and services company headquartered in Boston, MA, operating mainly in the Americas, Europe, and Asia Pacific. It offers a range of digital transformation solutions including the ThingWorx platform for IoT, Vuforia for augmented reality, and various product lifecycle management and CAD software. The company focuses on scalable, easy-to-implement innovation to accelerate enterprise value.
Asana, Inc. Overview
Asana, Inc., based in San Francisco, CA, provides a work management platform designed to help individuals and teams coordinate tasks and strategic initiatives. Serving diverse sectors such as technology, healthcare, and finance, Asana supports collaboration on projects like product launches and goal setting. Founded in 2008, it emphasizes orchestrating work across organizations with a cloud-based approach.
Key similarities and differences
Both PTC and Asana operate in the software application industry, focusing on enhancing organizational productivity and collaboration. PTC’s model centers on advanced digital transformation tools and product lifecycle management, while Asana targets work orchestration and team task management across industries. PTC has a broader international presence and more diverse software offerings, whereas Asana specializes in cloud-based work management platforms primarily for team collaboration.
Income Statement Comparison
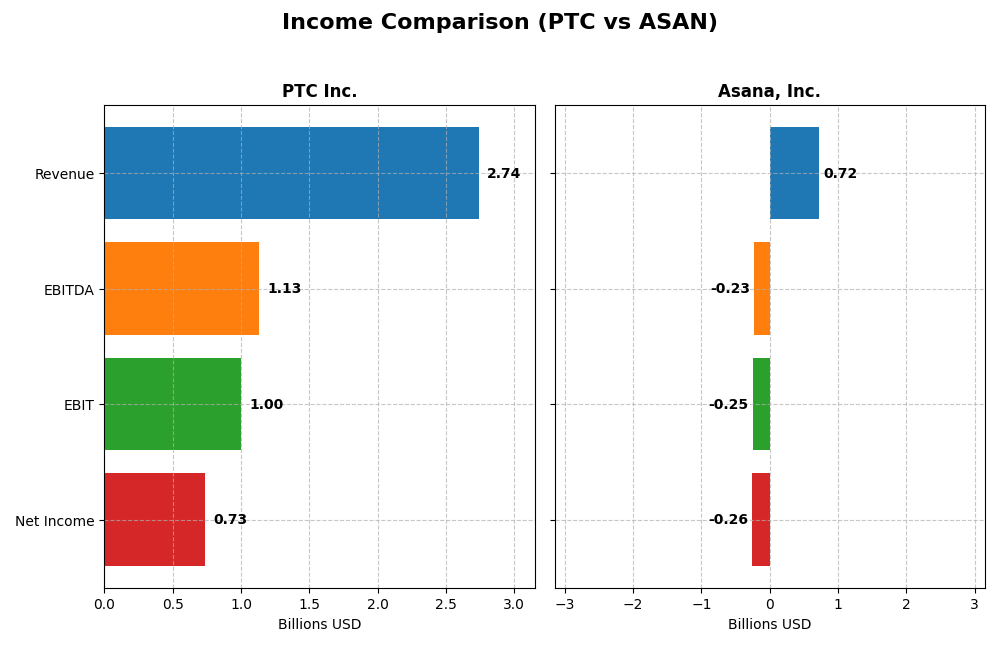
The table below presents a side-by-side comparison of key income statement metrics for PTC Inc. and Asana, Inc. for their most recent fiscal years, illustrating their financial performance.
| Metric | PTC Inc. | Asana, Inc. |
|---|---|---|
| Market Cap | 19.9B | 2.59B |
| Revenue | 2.74B | 724M |
| EBITDA | 1.13B | -230M |
| EBIT | 997M | -247M |
| Net Income | 734M | -256M |
| EPS | 6.18 | -1.11 |
| Fiscal Year | 2025 | 2025 |
Income Statement Interpretations
PTC Inc.
PTC Inc. exhibited consistent growth in revenue and net income from 2021 to 2025, with revenue rising from $1.81B to $2.74B and net income increasing from $477M to $734M. Margins remained stable and favorable, with a gross margin of 83.76% and a net margin of 26.8% in 2025. The latest year showed robust growth, with net income nearly doubling and EPS up by 96.79%.
Asana, Inc.
Asana, Inc. demonstrated strong revenue growth, expanding from $227M in 2021 to $724M in 2025, representing a 219% increase overall. However, net income remained negative throughout, with a net loss of $256M in 2025 despite improvements in net margin and EPS growth. Gross margin stayed high at 89.34%, but EBIT and net margins were significantly negative, reflecting ongoing operating losses.
Which one has the stronger fundamentals?
PTC Inc. displays stronger fundamentals with consistently positive net income, solid and improving margins, and substantial earnings growth. Asana shows impressive revenue expansion but continues to post losses and negative margins, signaling higher risk. PTC’s stable profitability and margin improvements contrast with Asana’s ongoing net losses despite growth in revenue and margins.
Financial Ratios Comparison
The table below presents a comparison of key financial ratios for PTC Inc. and Asana, Inc. based on the most recent fiscal year data available.
| Ratios | PTC Inc. (2025) | Asana, Inc. (2025) |
|---|---|---|
| ROE | 19.2% | -112.3% |
| ROIC | 14.4% | -53.0% |
| P/E | 33.2 | -19.2 |
| P/B | 6.37 | 21.52 |
| Current Ratio | 1.12 | 1.44 |
| Quick Ratio | 1.12 | 1.44 |
| D/E (Debt-to-Equity) | 0.36 | 1.18 |
| Debt-to-Assets | 20.7% | 30.1% |
| Interest Coverage | 12.8 | -72.4 |
| Asset Turnover | 0.41 | 0.81 |
| Fixed Asset Turnover | 15.58 | 2.76 |
| Payout Ratio | 0 | 0 |
| Dividend Yield | 0 | 0 |
Interpretation of the Ratios
PTC Inc.
PTC Inc. shows mostly strong financial ratios with favorable metrics in net margin (26.8%), return on equity (19.18%), and return on invested capital (14.43%). However, valuation ratios such as price-to-earnings (33.19) and price-to-book (6.37) are less attractive, suggesting potential overvaluation risks. The company does not pay dividends, reflecting a focus on reinvestment and growth rather than shareholder payouts.
Asana, Inc.
Asana’s financial ratios reveal significant challenges, with negative net margin (-35.3%), return on equity (-112.31%), and return on invested capital (-53.03%), indicating operational and profitability struggles. Although it maintains a solid current ratio (1.44) and quick ratio (1.44), high debt-to-equity (1.18) and negative interest coverage highlight financial stress. Asana does not distribute dividends, likely due to ongoing investment in growth and development.
Which one has the best ratios?
PTC Inc. presents a more favorable overall ratio profile, with a majority of metrics rated positively and solid profitability measures. In contrast, Asana faces numerous unfavorable ratios, particularly in profitability and leverage, reflecting higher risk. Consequently, PTC’s financial health appears stronger based on the available ratio analysis.
Strategic Positioning
This section compares the strategic positioning of PTC Inc. and Asana, Inc., including market position, key segments, and exposure to technological disruption:
PTC Inc.
- Established software company with $19.9B market cap facing typical tech sector competition.
- Diverse software segments: licenses, support/cloud services, and technology services drive growth.
- Invests in digital transformation platforms, AR, SaaS, and lifecycle management software mitigating disruption risk.
Asana, Inc.
- Smaller, newer software firm with $2.6B market cap in a competitive application software space.
- Focuses on work management platform serving diverse industries including tech, retail, and healthcare.
- Provides cloud work management solutions; exposure to SaaS innovation and competitive pressure in task management.
PTC vs Asana Positioning
PTC’s diversified software product portfolio contrasts with Asana’s concentrated focus on work management platforms. PTC benefits from multiple revenue streams, while Asana targets specific market niches, which may limit scale but allows specialization.
Which has the best competitive advantage?
PTC demonstrates a very favorable moat with growing ROIC above WACC, indicating durable competitive advantage. In contrast, Asana shows a very unfavorable moat with declining ROIC below WACC, reflecting challenges in creating value and sustaining profitability.
Stock Comparison
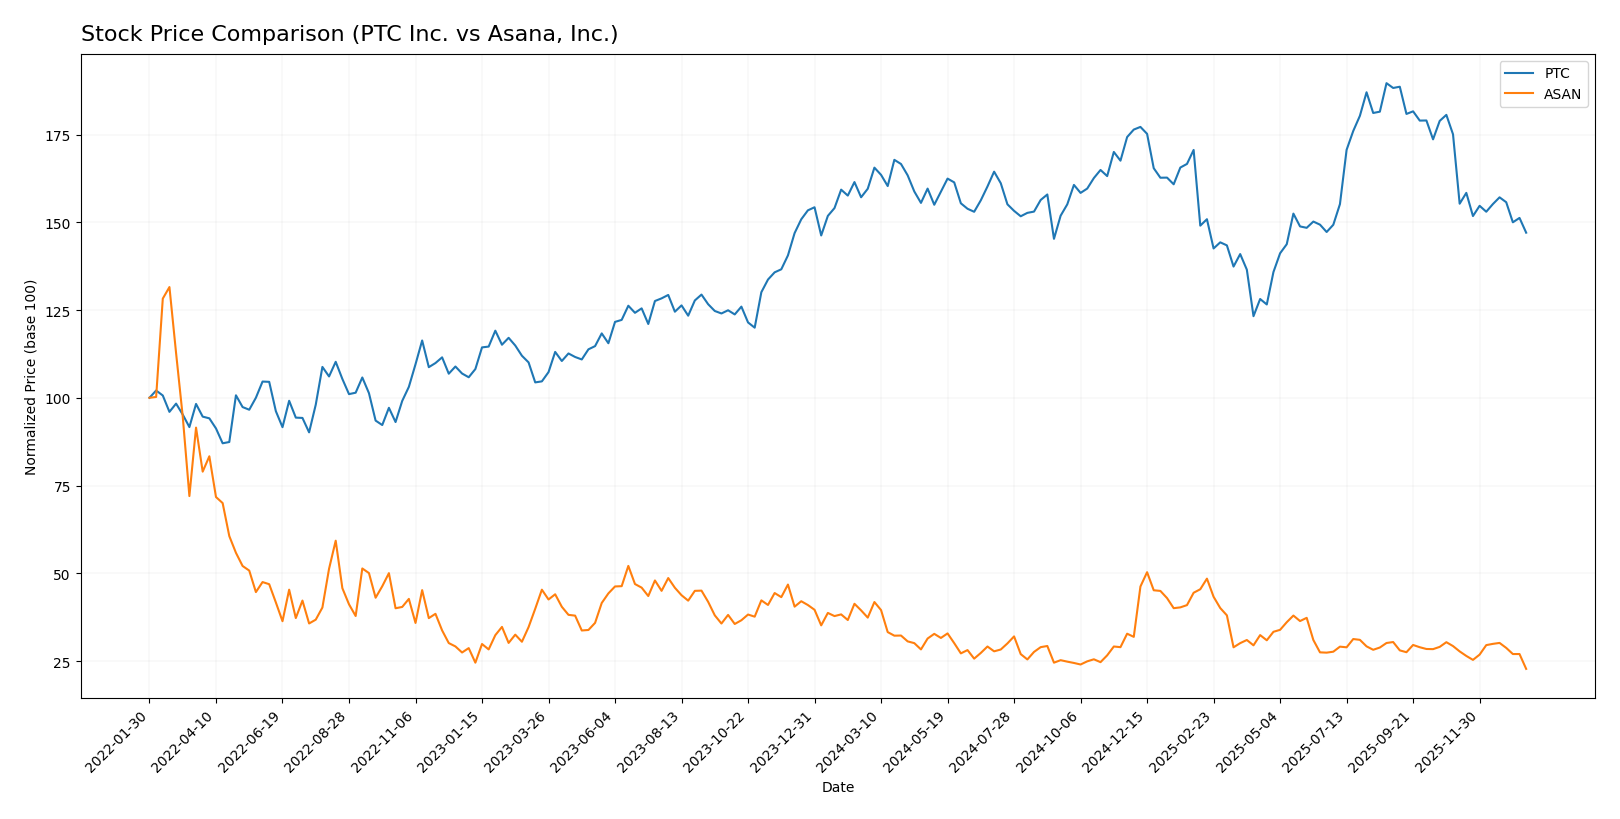
The stock price movements of PTC Inc. and Asana, Inc. over the past 12 months reveal notable bearish trends with varying degrees of price decline and trading volume dynamics.
Trend Analysis
PTC Inc. experienced a 7.84% price decline over the past year, indicating a bearish trend with deceleration. The stock’s price fluctuated between a high of 215.05 and a low of 139.77, showing moderate volatility with a standard deviation of 15.47.
Asana, Inc. showed a stronger bearish trend with a 39.07% price drop over the same period and deceleration in trend. Its price ranged from 24.15 at the high to 10.93 at the low, with lower volatility reflected in a 2.87 standard deviation.
Comparing both stocks, PTC Inc. delivered a less severe market decline than Asana, Inc., indicating relatively better performance despite both following bearish trajectories.
Target Prices
Analyst consensus presents a mixed but generally optimistic outlook for these software companies.
| Company | Target High | Target Low | Consensus |
|---|---|---|---|
| PTC Inc. | 255 | 120 | 213.25 |
| Asana, Inc. | 18 | 14 | 15.75 |
For PTC Inc., the consensus target of 213.25 suggests upside potential versus the current price of 166.75. Asana’s consensus target of 15.75 also indicates expected growth from its current 10.93 price, reflecting cautious optimism in their respective markets.
Analyst Opinions Comparison
This section compares analysts’ ratings and grades for PTC Inc. and Asana, Inc.:
Rating Comparison
PTC Rating
- Rating: B+, considered very favorable by analysts.
- Discounted Cash Flow Score: 4, indicating a favorable valuation outlook.
- ROE Score: 4, showing efficient profit generation from shareholders’ equity.
- ROA Score: 5, very favorable asset utilization to generate earnings.
- Debt To Equity Score: 2, moderate financial risk with some leverage.
ASAN Rating
- Rating: D+, considered very unfavorable by analysts.
- Discounted Cash Flow Score: 1, indicating a very unfavorable valuation.
- ROE Score: 1, showing very unfavorable profit generation efficiency.
- ROA Score: 1, very unfavorable asset utilization.
- Debt To Equity Score: 1, very unfavorable financial risk due to high debt.
Which one is the best rated?
Based strictly on the provided data, PTC Inc. is better rated with a B+ rating and stronger scores in discounted cash flow, ROE, ROA, and debt-to-equity metrics, compared to Asana, Inc.’s D+ rating and uniformly low scores.
Scores Comparison
Here is a comparison of the financial scores for PTC and Asana, indicating their risk and financial strength:
PTC Scores
- Altman Z-Score: 5.67, indicating a safe zone status, low bankruptcy risk.
- Piotroski Score: 8, classified as very strong financial health.
Asana Scores
- Altman Z-Score: -0.27, indicating distress zone status, high bankruptcy risk.
- Piotroski Score: 4, reflecting average financial strength.
Which company has the best scores?
Based strictly on the provided data, PTC shows a safer financial position with a high Altman Z-Score and a very strong Piotroski Score, whereas Asana is in distress with lower scores.
Grades Comparison
The following presents the recent grade updates from recognized grading firms for PTC Inc. and Asana, Inc.:
PTC Inc. Grades
This table summarizes recent analyst grades and actions for PTC Inc. from established grading companies.
| Grading Company | Action | New Grade | Date |
|---|---|---|---|
| Piper Sandler | Maintain | Neutral | 2025-11-07 |
| Rosenblatt | Maintain | Buy | 2025-11-06 |
| Rosenblatt | Maintain | Buy | 2025-10-30 |
| Oppenheimer | Maintain | Outperform | 2025-07-31 |
| Rosenblatt | Maintain | Buy | 2025-07-31 |
| Barclays | Maintain | Overweight | 2025-07-31 |
| Stifel | Maintain | Buy | 2025-07-31 |
| Keybanc | Maintain | Overweight | 2025-07-31 |
| RBC Capital | Maintain | Outperform | 2025-07-31 |
| Piper Sandler | Maintain | Neutral | 2025-07-31 |
The grades for PTC show consistent positive ratings, predominantly Buy and Outperform, with some Neutral assessments.
Asana, Inc. Grades
This table summarizes recent analyst grades and actions for Asana, Inc. from established grading companies.
| Grading Company | Action | New Grade | Date |
|---|---|---|---|
| Citigroup | Upgrade | Buy | 2026-01-15 |
| RBC Capital | Maintain | Underperform | 2026-01-05 |
| Keybanc | Upgrade | Overweight | 2025-12-15 |
| DA Davidson | Maintain | Neutral | 2025-12-04 |
| Citigroup | Maintain | Neutral | 2025-12-03 |
| RBC Capital | Maintain | Underperform | 2025-12-03 |
| UBS | Maintain | Neutral | 2025-12-03 |
| Baird | Maintain | Neutral | 2025-09-04 |
| Morgan Stanley | Maintain | Underweight | 2025-09-04 |
| Piper Sandler | Maintain | Overweight | 2025-09-04 |
Asana’s grades present a more mixed picture with upgrades to Buy and Overweight but also several Underperform and Neutral ratings.
Which company has the best grades?
PTC Inc. has received more uniformly positive grades with multiple Buy and Outperform ratings, while Asana, Inc. shows a wider spread including Underperform assessments. This contrast may influence investor sentiment and risk perception differently for each stock.
Strengths and Weaknesses
Below is a comparison table highlighting key strengths and weaknesses of PTC Inc. and Asana, Inc. based on their recent financial and operational data.
| Criterion | PTC Inc. | Asana, Inc. |
|---|---|---|
| Diversification | Strong product mix: licenses, cloud services, tech services with growing cloud revenue (1.47B in 2025) | Limited diversification; mainly workflow management software |
| Profitability | High net margin (26.8%), ROIC (14.43%), and ROE (19.18%) | Negative margins and returns: net margin -35.3%, ROIC -53%, ROE -112% |
| Innovation | Consistent investment in technology services with increasing ROIC (+42%) | Struggling with declining ROIC (-74%) and value destruction |
| Global presence | Established global footprint with durable competitive advantage | Smaller scale and less proven global reach |
| Market Share | Significant market share in PLM and IoT software markets | Niche player in collaboration/work management, facing strong competition |
PTC demonstrates a strong and growing competitive moat with solid profitability and diversified revenue streams, particularly in cloud services. Conversely, Asana is currently facing significant financial challenges, showing negative returns and declining profitability, which raises caution for risk-conscious investors.
Risk Analysis
The following table summarizes key risks for PTC Inc. and Asana, Inc. based on their latest financial and operational data from 2025:
| Metric | PTC Inc. | Asana, Inc. |
|---|---|---|
| Market Risk | Moderate (Beta ~1.01) | Moderate (Beta ~0.92) |
| Debt level | Low (D/E = 0.36) | High (D/E = 1.18) |
| Regulatory Risk | Low | Low |
| Operational Risk | Moderate (asset turnover low) | High (negative profitability) |
| Environmental Risk | Low | Low |
| Geopolitical Risk | Moderate (global presence) | Moderate (global presence) |
PTC shows stable financial health with low debt and strong profitability, though moderate operational risks exist due to asset utilization efficiency. Asana faces higher risks from elevated debt levels, sustained losses, and poor profitability metrics, placing it in financial distress. Market risks are moderate for both given their industry exposure and beta values near 1.
Which Stock to Choose?
PTC Inc. shows a favorable income evolution with strong revenue and net income growth over 2021–2025, supported by robust profitability and manageable debt levels. Its financial ratios reflect a generally favorable profile, with solid returns on equity and invested capital, and a very favorable overall rating.
Asana, Inc. exhibits revenue growth but negative net income trends and profitability challenges, with unfavorable returns on equity and invested capital. Its financial ratios indicate a slightly unfavorable position, accompanied by a very unfavorable rating and higher debt relative to equity.
Investors prioritizing financial stability and durable value creation might view PTC’s favorable rating and strong income statement performance as indicative of quality. Conversely, those with a higher risk tolerance and focus on growth potential could interpret Asana’s dynamic revenue growth despite current profitability issues as an opportunity.
Disclaimer: Investment carries a risk of loss of initial capital. The past performance is not a reliable indicator of future results. Be sure to understand risks before making an investment decision.
Go Further
I encourage you to read the complete analyses of PTC Inc. and Asana, Inc. to enhance your investment decisions: