Asana, Inc. and Perfect Corp. are two dynamic players in the software application industry, each carving a niche through innovative solutions. Asana focuses on work management platforms that enhance team productivity across multiple sectors, while Perfect Corp. leads in AI-driven augmented reality for beauty and fashion tech. Their shared emphasis on cutting-edge technology and SaaS models makes this comparison particularly relevant. In this article, I will help you decide which company presents the most compelling investment opportunity.

Table of contents
Companies Overview
I will begin the comparison between Asana and Perfect Corp. by providing an overview of these two companies and their main differences.
Asana Overview
Asana, Inc. operates a work management platform designed for individuals, team leads, and executives to streamline tasks and strategic initiatives. Serving diverse industries such as technology, retail, education, and healthcare, Asana helps manage product launches, marketing campaigns, and organizational goals. Founded in 2008 and headquartered in San Francisco, it holds a strong position in the application software industry with a market cap of 2.6B USD.
Perfect Corp. Overview
Perfect Corp. specializes in SaaS artificial intelligence and augmented reality solutions tailored to the beauty and fashion tech sectors. Its offerings include virtual try-on technologies, AI-powered skin and face analysis, and various YouCam apps. Established in 2015 and based in New Taipei City, Taiwan, Perfect Corp. has positioned itself as a niche player in software applications with a market cap of 179M USD.
Key similarities and differences
Both Asana and Perfect Corp. operate in the technology sector under the software application industry, leveraging SaaS models to deliver their services. Asana focuses on work management across multiple industries, while Perfect Corp. targets beauty and fashion tech with AI and AR innovations. Market capitalization and employee count also distinguish them, with Asana significantly larger in scale and workforce.
Income Statement Comparison
The table below compares the key income statement figures for Asana, Inc. and Perfect Corp. for their most recent fiscal years, providing a snapshot of their financial performance.
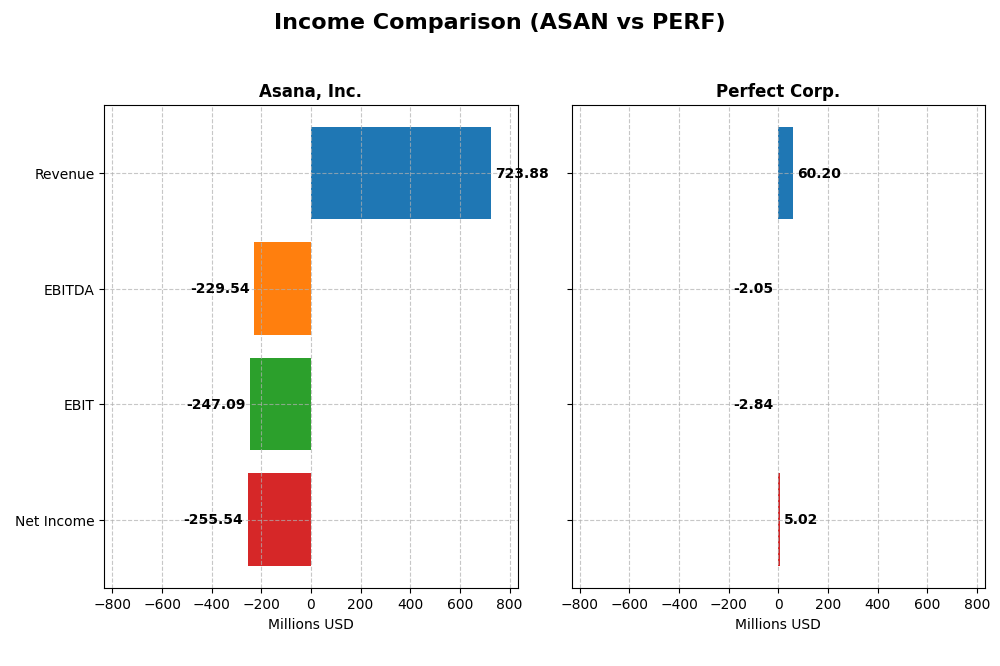
| Metric | Asana, Inc. (ASAN) | Perfect Corp. (PERF) |
|---|---|---|
| Market Cap | 2.59B | 179M |
| Revenue | 724M | 60.2M |
| EBITDA | -230M | -2.05M |
| EBIT | -247M | -2.84M |
| Net Income | -256M | 5.02M |
| EPS | -1.11 | 0.05 |
| Fiscal Year | 2025 | 2024 |
Income Statement Interpretations
Asana, Inc.
Asana’s revenue exhibited strong growth from 2021 to 2025, increasing by 219% overall, with a favorable 11% rise in the most recent year. Despite this, net income remained negative, though losses narrowed, improving net margin by 62%. Gross margin stayed high at 89.3%, while EBIT margin remained unfavorable. The 2025 performance showed continued revenue expansion and margin improvement, though profitability challenges persist.
Perfect Corp.
Perfect Corp. demonstrated steady revenue growth of 102% over 2020-2024, with a favorable 12.5% increase in the latest year. Net income grew substantially, driving an 8.3% positive net margin by 2024. Gross margin was favorable at 78%, but EBIT margin remained slightly negative. The recent year showed improved top-line growth, though EBIT declined and net margin contracted, indicating mixed signals on operational efficiency.
Which one has the stronger fundamentals?
Both companies show favorable revenue growth and gross margins, yet Asana struggles with deeper operating losses and negative net income despite margin improvements. Perfect Corp. reports positive net income and net margin, albeit with a recent EBIT decline. Perfect’s overall net income growth and positive margins suggest relatively stronger profitability fundamentals compared to Asana’s continuing net losses.
Financial Ratios Comparison
The table below presents a side-by-side comparison of key financial ratios for Asana, Inc. and Perfect Corp. based on their most recent fiscal year data, highlighting operational efficiency, profitability, and financial stability.
| Ratios | Asana, Inc. (2025) | Perfect Corp. (2024) |
|---|---|---|
| ROE | -112.3% | 3.42% |
| ROIC | -53.0% | -2.10% |
| P/E | -19.2 | 56.6 |
| P/B | 21.5 | 1.93 |
| Current Ratio | 1.44 | 5.52 |
| Quick Ratio | 1.44 | 5.52 |
| D/E | 1.18 | 0.0035 |
| Debt-to-Assets | 30.1% | 0.28% |
| Interest Coverage | -72.4 | -449 |
| Asset Turnover | 0.81 | 0.33 |
| Fixed Asset Turnover | 2.76 | 57.9 |
| Payout ratio | 0 | 0 |
| Dividend yield | 0 | 0 |
Interpretation of the Ratios
Asana, Inc.
Asana’s ratios reveal several weaknesses, notably negative net margin (-35.3%), negative return on equity (-112.31%), and unfavorable interest coverage, signaling profitability and operational efficiency challenges. Its current ratio of 1.44 is neutral, indicating moderate short-term liquidity. The company does not pay dividends, likely reflecting its ongoing investment in growth and R&D, as well as the absence of free cash flow coverage for distributions.
Perfect Corp.
Perfect Corp. shows a mixed ratio profile with a modest positive net margin (8.34%) but weak returns on equity (3.42%) and invested capital (-2.1%), suggesting profitability issues despite operational progress. The company has a strong quick ratio (5.52) and no debt, but unfavorable asset turnover and interest coverage ratios. It also does not pay dividends, consistent with a focus on reinvestment and expansion rather than shareholder payouts.
Which one has the best ratios?
Both companies face significant challenges, reflected in their “slightly unfavorable” overall ratio evaluations. Asana struggles more with profitability and leverage ratios, while Perfect Corp. benefits from strong liquidity and low debt but has weaker efficiency metrics. Neither company pays dividends, emphasizing growth and reinvestment priorities, making it difficult to clearly favor one solely on ratio strength.
Strategic Positioning
This section compares the strategic positioning of Asana and Perfect Corp., focusing on Market position, Key segments, and Exposure to technological disruption:
Asana, Inc.
- Operates a global work management platform facing competition in software applications market.
- Serves diverse industries including tech, retail, healthcare, and finance, driving growth.
- Exposure linked to software application advancements but no explicit disruption details given.
Perfect Corp.
- Provides AI and AR beauty and fashion tech solutions, focusing on niche SaaS and virtual try-on.
- Focused on beauty and fashion segments with AI-powered virtual try-on and related apps.
- Relies heavily on AI and AR technologies, facing disruption risks inherent in fast-evolving tech.
Asana, Inc. vs Perfect Corp. Positioning
Asana pursues a diversified approach serving multiple industries with a broad work management platform, while Perfect Corp. maintains a concentrated focus on AI-driven beauty and fashion tech. This contrast highlights differing scale and market focus advantages and limitations.
Which has the best competitive advantage?
Both companies are currently shedding value, but Perfect Corp.’s improving ROIC trend suggests increasing profitability, whereas Asana shows declining profitability, indicating a weaker competitive moat.
Stock Comparison
The stock prices of Asana, Inc. and Perfect Corp. have both exhibited significant declines over the past 12 months, with persistent bearish trends and decelerating momentum highlighting challenging trading dynamics.
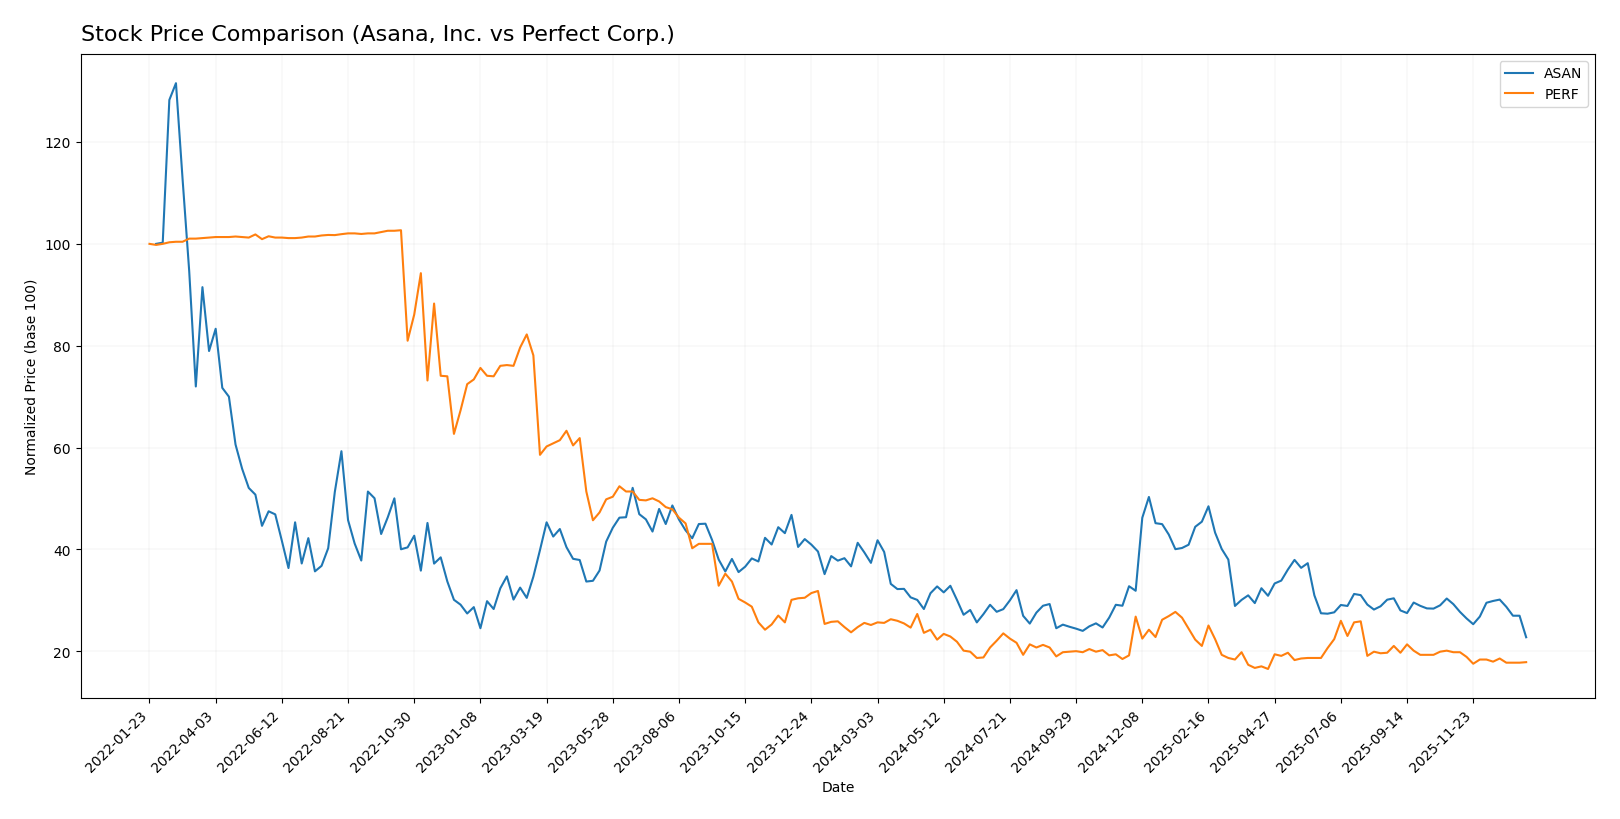
Trend Analysis
Asana, Inc. experienced a bearish trend with a -39.07% price change over the past year, showing deceleration and notable volatility with a standard deviation of 2.87. The stock ranged between a high of 24.15 and a low of 10.93.
Perfect Corp. also showed a bearish trend with a -28.98% price change over the same period, accompanied by deceleration and much lower volatility at 0.27 standard deviation, with a high of 2.7 and a low of 1.61.
Comparing both, Asana’s stock recorded the greater decline and higher volatility, while Perfect Corp. delivered relatively better market performance despite a bearish trend for both.
Target Prices
Analysts present a moderate upside potential for Asana, Inc. and Perfect Corp. based on current consensus.
| Company | Target High | Target Low | Consensus |
|---|---|---|---|
| Asana, Inc. | 18 | 14 | 15.75 |
| Perfect Corp. | 7 | 7 | 7 |
The consensus target for Asana, Inc. at 15.75 USD suggests a potential 44% upside from its current price of 10.93 USD. Perfect Corp.’s target of 7 USD indicates significant expected growth from the current price of 1.74 USD.
Analyst Opinions Comparison
This section compares analysts’ ratings and grades for Asana, Inc. and Perfect Corp.:
Rating Comparison
ASAN Rating
- Rating: D+, considered very favorable
- Discounted Cash Flow Score: 1, very unfavorable
- ROE Score: 1, very unfavorable
- ROA Score: 1, very unfavorable
- Debt To Equity Score: 1, very unfavorable
- Overall Score: 1, very unfavorable
PERF Rating
- Rating: A-, considered very favorable
- Discounted Cash Flow Score: 5, very favorable
- ROE Score: 2, moderate
- ROA Score: 3, moderate
- Debt To Equity Score: 4, favorable
- Overall Score: 4, favorable
Which one is the best rated?
Based strictly on provided data, Perfect Corp. is better rated overall, showing higher scores across discounted cash flow, ROE, ROA, debt to equity, and overall financial health compared to Asana, Inc.
Scores Comparison
The scores comparison between Asana, Inc. and Perfect Corp. is as follows:
Asana Scores
- Altman Z-Score: -0.27, indicating financial distress risk.
- Piotroski Score: 4, reflecting average financial strength.
Perfect Corp. Scores
- Altman Z-Score: 1.31, also in distress zone but higher.
- Piotroski Score: 6, showing average but stronger health.
Which company has the best scores?
Perfect Corp. shows better scores with a higher Altman Z-Score and Piotroski Score than Asana, indicating relatively stronger financial health based on the provided data.
Grades Comparison
Here is a comparison of the recent grades for Asana, Inc. and Perfect Corp.:
Asana, Inc. Grades
The following table summarizes recent grades from reputable financial institutions for Asana, Inc.:
| Grading Company | Action | New Grade | Date |
|---|---|---|---|
| Citigroup | Upgrade | Buy | 2026-01-15 |
| RBC Capital | Maintain | Underperform | 2026-01-05 |
| Keybanc | Upgrade | Overweight | 2025-12-15 |
| DA Davidson | Maintain | Neutral | 2025-12-04 |
| Citigroup | Maintain | Neutral | 2025-12-03 |
| RBC Capital | Maintain | Underperform | 2025-12-03 |
| UBS | Maintain | Neutral | 2025-12-03 |
| Morgan Stanley | Maintain | Underweight | 2025-09-04 |
| Piper Sandler | Maintain | Overweight | 2025-09-04 |
| Baird | Maintain | Neutral | 2025-09-04 |
Asana’s grades show a mix of Buy and Neutral ratings, with some Underperform and Underweight assessments, indicating a varied outlook among analysts.
Perfect Corp. Grades
The following table summarizes recent grades from reputable financial institutions for Perfect Corp.:
| Grading Company | Action | New Grade | Date |
|---|---|---|---|
| Piper Sandler | Maintain | Neutral | 2024-02-29 |
| Goldman Sachs | Maintain | Neutral | 2023-10-26 |
| Piper Sandler | Maintain | Neutral | 2023-10-25 |
| Piper Sandler | Maintain | Neutral | 2023-07-26 |
| Piper Sandler | Maintain | Neutral | 2023-07-25 |
| Piper Sandler | Maintain | Neutral | 2023-04-27 |
| Oppenheimer | Downgrade | Perform | 2023-04-20 |
| Oppenheimer | Downgrade | Perform | 2023-04-19 |
| Oppenheimer | Downgrade | Perform | 2023-04-18 |
| Piper Sandler | Maintain | Neutral | 2023-03-08 |
Perfect Corp.’s grades consistently trend around Neutral, with a few downgrades from Outperform to Perform, indicating cautious analyst sentiment.
Which company has the best grades?
Asana, Inc. has received more favorable grades overall, including recent upgrades to Buy and Overweight, while Perfect Corp. remains mostly Neutral with some downgrades. This disparity may influence investor confidence and portfolio allocation decisions.
Strengths and Weaknesses
The table below summarizes the key strengths and weaknesses of Asana, Inc. (ASAN) and Perfect Corp. (PERF) based on recent financial and operational data.
| Criterion | Asana, Inc. (ASAN) | Perfect Corp. (PERF) |
|---|---|---|
| Diversification | Limited product range, focused on work management tools | Niche focus on beauty tech, limited diversification |
| Profitability | Negative net margin (-35.3%), ROIC -53.0%, value destroying | Slightly positive net margin (8.3%), ROIC -2.1%, improving profitability |
| Innovation | Moderate innovation, but declining ROIC indicates inefficiency | Growing ROIC trend signals improving innovation efficiency |
| Global presence | Established global footprint but with financial challenges | Smaller scale but expanding global reach |
| Market Share | Facing strong competition, losing value | Smaller market share but increasing operational efficiency |
Key takeaways: Both companies are currently shedding value, with Asana showing significant profitability and efficiency challenges. Perfect Corp. demonstrates improving profitability and operational efficiency, suggesting potential for future value creation despite current weaknesses. Caution is warranted when considering investments in either company.
Risk Analysis
Below is a comparison of key risk factors for Asana, Inc. (ASAN) and Perfect Corp. (PERF) based on the most recent financial data from 2025 and 2024 respectively.
| Metric | Asana, Inc. (ASAN) | Perfect Corp. (PERF) |
|---|---|---|
| Market Risk | Beta 0.92 (moderate volatility) | Beta 0.45 (lower volatility) |
| Debt level | D/E 1.18 (high, unfavorable) | D/E 0.0 (very low, favorable) |
| Regulatory Risk | Moderate (US tech sector) | Moderate (Taiwan tech sector) |
| Operational Risk | Scale of 1,819 employees; negative margins indicate challenges | Smaller scale at 342 employees; positive margins but low asset turnover |
| Environmental Risk | Moderate (typical for software firms) | Moderate (typical for software firms) |
| Geopolitical Risk | US-based, subject to US regulations and trade policies | Taiwan-based, exposed to cross-strait tensions |
Asana faces higher financial risk due to significant debt and sustained negative profitability, reflected in its distress zone Altman Z-Score (-0.27) and very unfavorable ratings. Perfect Corp., while modestly profitable, remains in the distress zone (Z-Score 1.31) with limited debt but operational efficiency concerns. The most impactful risks are Asana’s financial instability and Perfect’s geopolitical exposure. Both require cautious risk management.
Which Stock to Choose?
Asana, Inc. (ASAN) has shown a favorable income statement with 71.43% positive metrics including 10.94% revenue growth in 2025, but suffers from unfavorable financial ratios overall, marked by negative profitability and high debt levels. Its rating is very unfavorable with a D+ grade, and the company is destroying value as its ROIC declines sharply below WACC.
Perfect Corp. (PERF) presents a generally favorable income profile with 78.57% favorable income metrics and 12.52% revenue growth in 2024. Its financial ratios are mixed but slightly better balanced, with favorable debt metrics and a moderate level of profitability. The company holds a favorable A- rating, though it also shows value destruction with improving ROIC trends.
Investors focused on growth might see potential in Perfect Corp. given its stronger rating and improving profitability trend, while those prioritizing high revenue growth despite financial challenges may find Asana’s income evolution noteworthy. Risk-averse investors may view the ratings and financial stability concerns as signals to proceed cautiously for both stocks.
Disclaimer: Investment carries a risk of loss of initial capital. The past performance is not a reliable indicator of future results. Be sure to understand risks before making an investment decision.
Go Further
I encourage you to read the complete analyses of Asana, Inc. and Perfect Corp. to enhance your investment decisions: