In the dynamic world of software applications, Pegasystems Inc. (PEGA) and Asana, Inc. (ASAN) stand out as innovative players driving enterprise productivity and customer engagement. Both companies operate in the application software industry, targeting overlapping markets with distinct approaches to automation and work management. This comparison will explore their strategies and growth potential to help you decide which company is the more compelling investment opportunity in 2026.

Table of contents
Companies Overview
I will begin the comparison between Pegasystems Inc. and Asana, Inc. by providing an overview of these two companies and their main differences.
Pegasystems Inc. Overview
Pegasystems Inc. develops and markets enterprise software applications globally, focusing on customer engagement and digital process automation. Its offerings include the Pega Platform for application development and Pega Infinity for unified customer engagement. The company serves diverse sectors such as financial services, healthcare, and manufacturing, leveraging direct sales and partnerships to deliver its software solutions. Pegasystems is headquartered in Waltham, Massachusetts, with a workforce of about 5.4K employees.
Asana, Inc. Overview
Asana, Inc. operates a work management platform designed to help teams and executives coordinate daily tasks and strategic projects. Its software supports various industries including technology, retail, and healthcare, facilitating workflows like product launches and marketing campaigns. Founded in 2008 and based in San Francisco, Asana has approximately 1.8K employees and focuses on enhancing organizational productivity through its platform.
Key similarities and differences
Both Pegasystems and Asana operate in the software application industry, providing platforms that aid business efficiency and collaboration. Pegasystems emphasizes customer engagement and automation across multiple channels, targeting a broad range of industries with complex enterprise solutions. In contrast, Asana specializes in work management and task orchestration, catering to team productivity and project management. Their market caps differ significantly, reflecting distinct scales and focus areas within the technology sector.
Income Statement Comparison
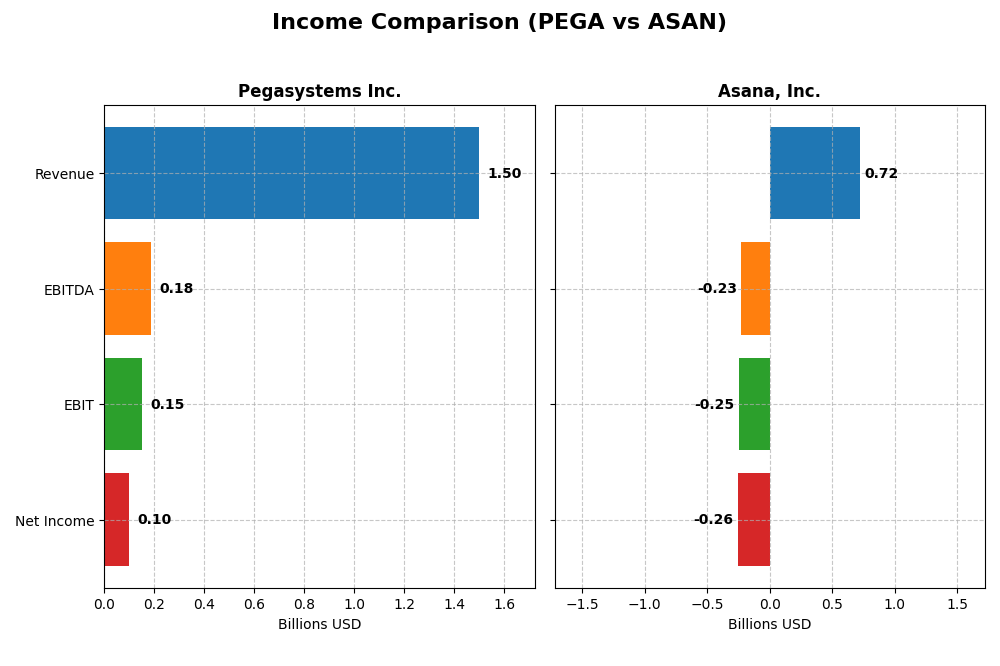
The table below presents the most recent full-year income statement metrics for Pegasystems Inc. and Asana, Inc., providing a clear side-by-side financial performance overview for 2024 and 2025 respectively.
| Metric | Pegasystems Inc. (PEGA) | Asana, Inc. (ASAN) |
|---|---|---|
| Market Cap | 8.9B | 2.6B |
| Revenue | 1.50B | 724M |
| EBITDA | 185M | -230M |
| EBIT | 149M | -247M |
| Net Income | 99M | -256M |
| EPS | 0.58 | -1.11 |
| Fiscal Year | 2024 | 2025 |
Income Statement Interpretations
Pegasystems Inc.
Pegasystems Inc. showed steady revenue growth from 2020 to 2024, increasing by 47.14%, with net income turning positive after previous losses and rising by 261.62% overall. Gross margins remained strong at 73.91%, while net margins improved to 6.63%. The 2024 fiscal year saw a moderate revenue growth of 4.51%, but significant improvements in EBIT and net margin underscored better profitability and operational efficiency.
Asana, Inc.
Asana, Inc. delivered robust revenue growth of 218.88% over 2021-2025, with a 10.94% increase in the last year. Despite favorable gross margin of 89.34%, the company reported negative net margins at -35.3%, though net margin improved by 10.38% in 2025. EBIT margin remained negative at -34.13%, reflecting ongoing operating losses despite incremental progress in profitability metrics.
Which one has the stronger fundamentals?
Pegasystems demonstrates stronger fundamentals with consistent profitability improvements, positive net margins, and favorable margin trends. In contrast, Asana exhibits impressive top-line growth but continues to face significant net losses and unfavorable EBIT margins. Pegasystems’ stable margin expansion and positive net income growth outweigh Asana’s rapid revenue increase but persistent operating deficits.
Financial Ratios Comparison
The table below compares key financial ratios for Pegasystems Inc. and Asana, Inc. based on their most recent fiscal year data, offering a snapshot of their profitability, liquidity, leverage, and valuation metrics.
| Ratios | Pegasystems Inc. (2024) | Asana, Inc. (2025) |
|---|---|---|
| ROE | 16.94% | -112.31% |
| ROIC | 7.40% | -53.03% |
| P/E | 80.12 | -19.16 |
| P/B | 13.57 | 21.52 |
| Current Ratio | 1.23 | 1.44 |
| Quick Ratio | 1.23 | 1.44 |
| D/E | 0.94 | 1.18 |
| Debt-to-Assets | 31.09% | 30.11% |
| Interest Coverage | 18.12 | -72.42 |
| Asset Turnover | 0.85 | 0.81 |
| Fixed Asset Turnover | 14.36 | 2.76 |
| Payout ratio | 10.28% | 0% |
| Dividend yield | 0.13% | 0% |
Interpretation of the Ratios
Pegasystems Inc.
Pegasystems shows a slightly favorable ratio profile, with a strong return on equity at 16.94% and solid interest coverage at 21.87, indicating financial stability. However, its price-to-earnings ratio of 80.12 and price-to-book of 13.57 are unfavorable, suggesting overvaluation risks. The dividend yield is low at 0.13%, reflecting modest shareholder returns.
Asana, Inc.
Asana’s ratios appear slightly unfavorable, with negative net margin (-35.3%) and return on equity (-112.31%) that highlight profitability challenges. While its weighted average cost of capital is favorable at 7.73%, the company carries high debt-to-equity at 1.18 and negative interest coverage, pointing to financial stress. Asana does not pay dividends, consistent with a reinvestment or growth strategy.
Which one has the best ratios?
Pegasystems presents a more balanced and stable financial ratio profile compared to Asana, with favorable profitability and coverage metrics despite valuation concerns. Asana faces considerable profitability and leverage challenges, reflected in several unfavorable ratios. Thus, Pegasystems currently holds the advantage in ratio strength based on the available data.
Strategic Positioning
This section compares the strategic positioning of Pegasystems Inc. and Asana, Inc. by Market position, Key segments, and Exposure to technological disruption:
Pegasystems Inc.
- Established market presence with $8.9B market cap; faces typical competitive pressure in enterprise software.
- Focused on enterprise software with segments in Pega Cloud, Consulting, Maintenance, and Subscription Licenses.
- Positioned in enterprise software with cloud and automation offerings; no explicit disruption exposure noted.
Asana, Inc.
- Smaller market cap of $2.6B; competes in growing work management software with high competition.
- Concentrated on work management platform serving diverse industries without disclosed segment revenue.
- Operates in SaaS work management; no specific data on technological disruption exposure.
Pegasystems Inc. vs Asana, Inc. Positioning
Pegasystems has a diversified revenue base across cloud, consulting, and licenses, while Asana relies on a concentrated platform approach. Pegasystems benefits from broad industry reach, whereas Asana targets team collaboration with less segment detail available.
Which has the best competitive advantage?
Based on MOAT evaluations, Pegasystems shows slightly unfavorable but improving ROIC trends, while Asana has very unfavorable and declining ROIC, indicating Pegasystems currently holds a comparatively better competitive advantage.
Stock Comparison
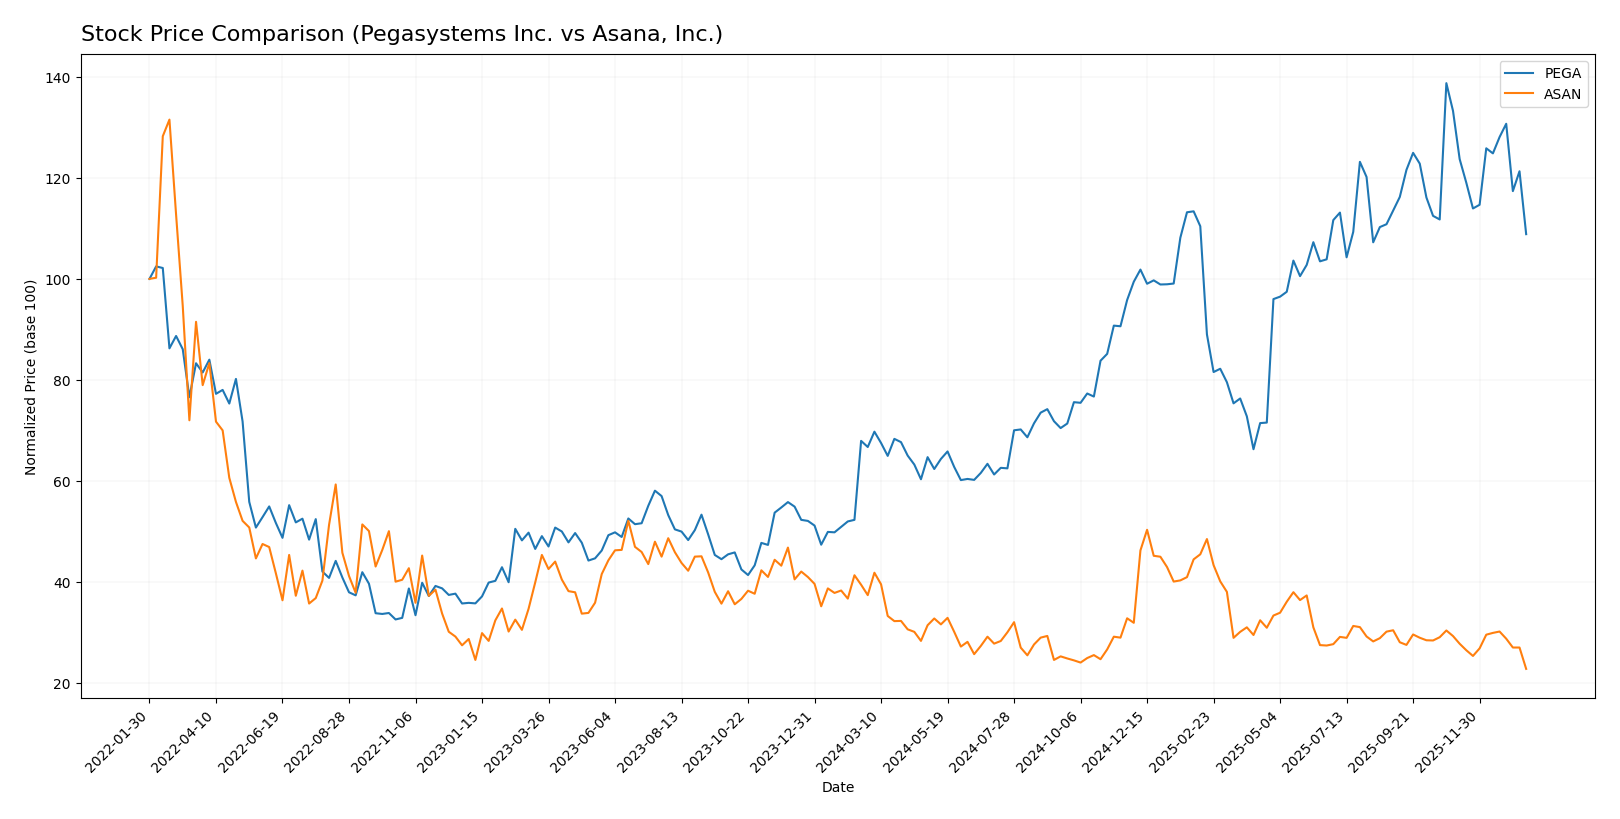
The stock price movements over the past 12 months reveal a strong bullish trend for Pegasystems Inc., contrasted by a pronounced bearish trend for Asana, Inc., with both stocks showing deceleration in momentum towards the end of the period.
Trend Analysis
Pegasystems Inc. (PEGA) showed a bullish trend with a 63.18% price increase over the past year, though recent data indicates an 18.32% decline and deceleration. The stock’s volatility is relatively high with a 10.77 std deviation.
Asana, Inc. (ASAN) experienced a bearish trend with a 39.07% price decrease over the same period. The downtrend continues recently with a further 22.21% drop and reduced volatility at a 2.87 std deviation.
Comparing the two, Pegasystems delivered the highest market performance with a significant positive gain, while Asana showed sustained negative returns and weaker price stability.
Target Prices
The consensus target prices suggest a positive outlook for both Pegasystems Inc. and Asana, Inc.
| Company | Target High | Target Low | Consensus |
|---|---|---|---|
| Pegasystems Inc. | 80 | 67 | 74 |
| Asana, Inc. | 18 | 14 | 15.75 |
Analysts expect Pegasystems’ stock to trade significantly above its current price of $51.99, while Asana’s consensus target of $15.75 suggests moderate upside from its current $10.93 trading level.
Analyst Opinions Comparison
This section compares analysts’ ratings and financial scores for Pegasystems Inc. and Asana, Inc.:
Rating Comparison
PEGA Rating
- Rating: B+ indicating a very favorable evaluation by analysts.
- Discounted Cash Flow Score: Moderate score of 3, reflecting average valuation.
- ROE Score: Very favorable score of 5, showing strong profit generation.
- ROA Score: Very favorable score of 5, demonstrating effective asset use.
- Debt To Equity Score: Moderate score of 3, suggesting average financial risk.
- Overall Score: Moderate score of 3, reflecting average overall financial health.
ASAN Rating
- Rating: D+ indicating a very unfavorable evaluation by analysts.
- Discounted Cash Flow Score: Very unfavorable score of 1, indicating overvaluation.
- ROE Score: Very unfavorable score of 1, showing weak profit generation.
- ROA Score: Very unfavorable score of 1, indicating poor asset utilization.
- Debt To Equity Score: Very unfavorable score of 1, indicating high financial risk.
- Overall Score: Very unfavorable score of 1, reflecting weak overall financial health.
Which one is the best rated?
Based strictly on the provided data, Pegasystems Inc. (PEGA) is better rated than Asana, Inc. (ASAN) across all key financial metrics, showing stronger profitability, asset efficiency, and a more moderate risk profile.
Scores Comparison
Here is a comparison of the Altman Z-Score and Piotroski Score for Pegasystems Inc. and Asana, Inc.:
Pegasystems Inc. Scores
- Altman Z-Score: 10.31, indicating a safe zone with low bankruptcy risk.
- Piotroski Score: 8, classified as very strong financial health.
Asana, Inc. Scores
- Altman Z-Score: -0.27, signaling distress zone and high bankruptcy risk.
- Piotroski Score: 4, reflecting average financial strength.
Which company has the best scores?
Pegasystems Inc. demonstrates significantly stronger financial health with a high Altman Z-Score in the safe zone and a very strong Piotroski Score, unlike Asana, which shows distress and average scores.
Grades Comparison
Here is the comparison of the latest available grades from reputable grading companies for Pegasystems Inc. and Asana, Inc.:
Pegasystems Inc. Grades
The table below summarizes recent grades and actions from major financial institutions for Pegasystems Inc.:
| Grading Company | Action | New Grade | Date |
|---|---|---|---|
| JP Morgan | Maintain | Overweight | 2025-12-05 |
| Wedbush | Maintain | Outperform | 2025-10-23 |
| RBC Capital | Maintain | Outperform | 2025-10-23 |
| Barclays | Maintain | Equal Weight | 2025-10-23 |
| Rosenblatt | Maintain | Buy | 2025-10-23 |
| DA Davidson | Upgrade | Buy | 2025-10-22 |
| Rosenblatt | Maintain | Buy | 2025-10-15 |
| Rosenblatt | Maintain | Buy | 2025-07-24 |
| DA Davidson | Maintain | Neutral | 2025-07-24 |
| Wedbush | Maintain | Outperform | 2025-07-24 |
Overall, Pegasystems shows a positive trend with multiple “Buy” and “Outperform” grades, supplemented by an “Overweight” rating and no downgrades.
Asana, Inc. Grades
The following table presents recent grades and actions by recognized financial firms for Asana, Inc.:
| Grading Company | Action | New Grade | Date |
|---|---|---|---|
| Citigroup | Upgrade | Buy | 2026-01-15 |
| RBC Capital | Maintain | Underperform | 2026-01-05 |
| Keybanc | Upgrade | Overweight | 2025-12-15 |
| DA Davidson | Maintain | Neutral | 2025-12-04 |
| Citigroup | Maintain | Neutral | 2025-12-03 |
| RBC Capital | Maintain | Underperform | 2025-12-03 |
| UBS | Maintain | Neutral | 2025-12-03 |
| Baird | Maintain | Neutral | 2025-09-04 |
| Morgan Stanley | Maintain | Underweight | 2025-09-04 |
| Piper Sandler | Maintain | Overweight | 2025-09-04 |
The ratings for Asana are mixed, with a recent upgrade to “Buy” by Citigroup but persistent “Underperform” and “Underweight” grades from others, indicating varied analyst sentiment.
Which company has the best grades?
Pegasystems Inc. has received generally stronger and more consistent positive grades compared to Asana, Inc., which has a more divided outlook. This stronger consensus for Pegasystems may reflect greater confidence from analysts, potentially affecting investor sentiment and risk perception.
Strengths and Weaknesses
Below is a comparative overview of key strengths and weaknesses for Pegasystems Inc. (PEGA) and Asana, Inc. (ASAN) based on recent financial and operational data.
| Criterion | Pegasystems Inc. (PEGA) | Asana, Inc. (ASAN) |
|---|---|---|
| Diversification | Strong product mix: Cloud (1.13B), Subscription (398M), Consulting and Maintenance segments provide steady revenue streams | Focused on task and workflow management software; limited product diversification |
| Profitability | Moderate profitability with 6.63% net margin and 16.94% ROE; ROIC at 7.4% slightly below WACC (8.58%), indicating slight value destruction but improving profitability trends | Negative profitability with -35.3% net margin, -112% ROE, and sharply declining ROIC at -53%, destroying value with worsening profitability |
| Innovation | Moderate innovation reflected in steady increase in cloud revenues and strong fixed asset turnover (14.36) | Innovation challenged by declining financial metrics and negative returns on capital |
| Global presence | Established global presence through diversified service offerings and cloud platform adoption | Growing but limited global footprint, primarily focused on SaaS market |
| Market Share | Solid positioning in enterprise software and cloud services markets | Niche player in collaboration and workflow software, facing intense competition |
Key takeaways: Pegasystems shows a diversified revenue base with improving profitability despite slight value destruction, suggesting cautious optimism. Asana exhibits severe profitability challenges and value erosion, signaling higher risk for investors.
Risk Analysis
Below is a comparative table outlining key risks for Pegasystems Inc. (PEGA) and Asana, Inc. (ASAN) based on the most recent financial and operational data available for 2025–2026.
| Metric | Pegasystems Inc. (PEGA) | Asana, Inc. (ASAN) |
|---|---|---|
| Market Risk | Moderate (Beta 1.08) | Lower (Beta 0.92) |
| Debt level | Moderate (Debt/Equity 0.94) | High (Debt/Equity 1.18) |
| Regulatory Risk | Standard for software sector | Standard for software sector |
| Operational Risk | Moderate (Stable cash flows, strong operational metrics) | High (Negative margins, operational losses) |
| Environmental Risk | Low | Low |
| Geopolitical Risk | Moderate (Global presence) | Moderate (Global presence) |
The most impactful risk for Asana is its financial distress indicated by a negative Altman Z-Score and weak profitability metrics, signaling higher bankruptcy risk and operational challenges. Pegasystems shows better financial stability with a safe Altman Z-Score and solid profitability, although its valuation multiples are high, which could pose market risk if growth slows. Both companies face moderate geopolitical risks due to their international operations, but environmental and regulatory risks remain low and typical for their industry.
Which Stock to Choose?
Pegasystems Inc. (PEGA) shows a favorable income evolution with a 47% revenue growth over five years and a strong 262% net income increase. Financial ratios are slightly favorable overall, highlighted by a robust 16.9% ROE and solid interest coverage. The company maintains moderate debt levels and holds a very favorable B+ rating.
Asana, Inc. (ASAN) displays a favorable revenue growth of 219% over its period but a net income decline of 21%. Its financial ratios are slightly unfavorable, burdened by negative profitability metrics such as a -35% net margin and deteriorating ROIC. Debt levels are moderate but the overall rating is very unfavorable at D+.
Investors focused on quality and financial stability might see Pegasystems as more favorable due to its strong profitability and solid rating. Conversely, those prioritizing high growth potential could interpret Asana’s revenue expansion as attractive despite profitability challenges and lower ratings.
Disclaimer: Investment carries a risk of loss of initial capital. The past performance is not a reliable indicator of future results. Be sure to understand risks before making an investment decision.
Go Further
I encourage you to read the complete analyses of Pegasystems Inc. and Asana, Inc. to enhance your investment decisions: