In today’s fast-evolving software landscape, Paycom Software, Inc. (PAYC) and Asana, Inc. (ASAN) stand out as innovative players in the application software industry. Both companies deliver cloud-based solutions, targeting workforce management and productivity, yet they approach their markets with distinct strategies and customer bases. This article will explore their strengths and risks to help you identify the more compelling investment opportunity for your portfolio.
Table of contents
Companies Overview
I will begin the comparison between Paycom Software, Inc. and Asana, Inc. by providing an overview of these two companies and their main differences.
Paycom Software, Inc. Overview
Paycom Software, Inc. delivers cloud-based human capital management (HCM) solutions via software-as-a-service primarily for small to mid-sized U.S. companies. Its platform covers the entire employment life cycle, offering applications for talent acquisition, time and labor management, payroll, and talent management with data analytics. Founded in 1998, Paycom is headquartered in Oklahoma City and employs over 7,300 full-time staff.
Asana, Inc. Overview
Asana, Inc. operates a work management platform designed for individuals and teams globally, helping organize tasks and strategic initiatives across industries like technology, healthcare, and financial services. Founded in 2008 and based in San Francisco, Asana supports project orchestration from daily tasks to organization-wide goals and employs around 1,800 people. It went public in 2020 and serves a broad customer base internationally.
Key similarities and differences
Both Paycom and Asana operate in the software application industry, focusing on improving organizational workflows through cloud platforms. Paycom specializes in human capital management for HR and payroll processes, while Asana emphasizes collaborative work management across various sectors. Paycom targets primarily U.S. mid-sized companies with a comprehensive HCM suite, whereas Asana serves a global audience with tools for task and project coordination. Their business models differ in scope and customer focus but share a SaaS delivery approach.
Income Statement Comparison
Below is a factual comparison of the latest income statement figures for Paycom Software, Inc. and Asana, Inc. based on their most recent fiscal year data.
| Metric | Paycom Software, Inc. (PAYC) | Asana, Inc. (ASAN) |
|---|---|---|
| Market Cap | 8.35B | 2.59B |
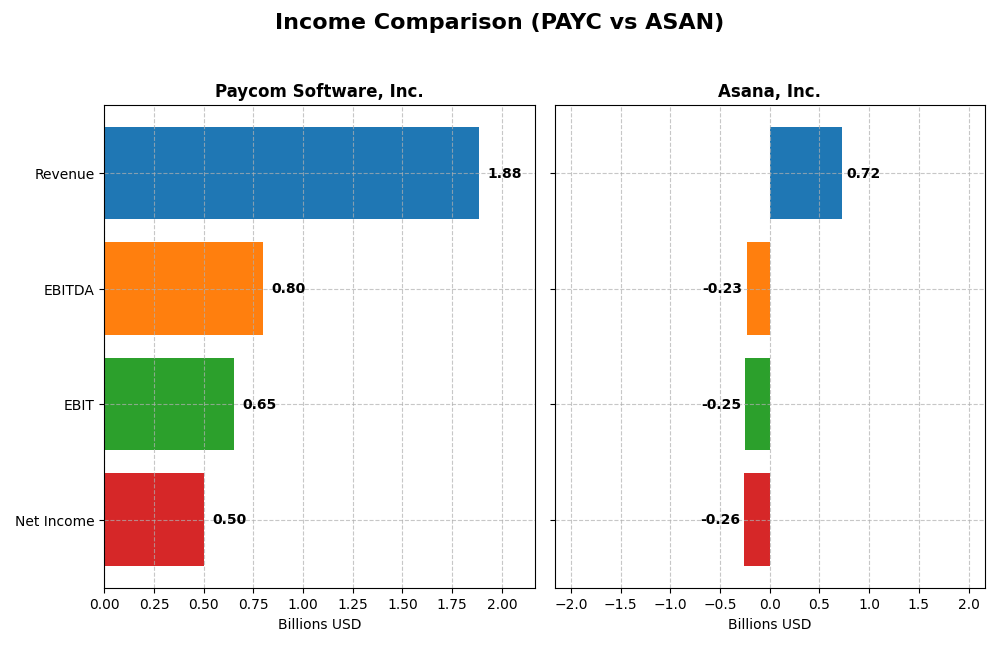
| Revenue | 1.88B | 724M |
| EBITDA | 798M | -230M |
| EBIT | 652M | -247M |
| Net Income | 502M | -256M |
| EPS | 8.93 | -1.11 |
| Fiscal Year | 2024 | 2025 |
Income Statement Interpretations
Paycom Software, Inc.
Paycom’s revenue and net income have shown consistent growth from 2020 to 2024, with revenue increasing from 841M to 1.88B and net income rising from 143M to 502M. Margins have remained strong and improved, with a gross margin of 82.23% and net margin of 26.66% in 2024. The latest year saw a favorable 11.19% revenue growth and a 32.48% net margin increase, reflecting robust operational performance.
Asana, Inc.
Asana’s revenue grew significantly from 227M in 2021 to 724M in 2025, showing a 218.88% increase over the period. However, net income remained negative, with a loss of 256M in 2025, despite a 10.38% improvement in net margin and 5.13% EPS growth in the latest year. The company maintains a high gross margin of 89.34%, but EBIT and net margins are unfavorable, indicating ongoing profitability challenges.
Which one has the stronger fundamentals?
Paycom demonstrates stronger fundamentals with consistent profitability, expanding net margins, and robust income growth supported by favorable margin levels and low interest expenses. In contrast, Asana, while growing revenue impressively, continues to report net losses and negative EBIT margins, with only partial improvements in earnings metrics. Overall, Paycom’s income statement reflects greater financial stability and operational efficiency.
Financial Ratios Comparison
The following table compares the key financial ratios for Paycom Software, Inc. (PAYC) and Asana, Inc. (ASAN) based on their most recent fiscal year data.
| Ratios | Paycom Software, Inc. (2024) | Asana, Inc. (2025) |
|---|---|---|
| ROE | 31.85% | -112.31% |
| ROIC | 24.86% | -53.03% |
| P/E | 22.95 | -19.16 |
| P/B | 7.31 | 21.52 |
| Current Ratio | 1.10 | 1.44 |
| Quick Ratio | 1.10 | 1.44 |
| D/E (Debt-to-Equity) | 0.053 | 1.18 |
| Debt-to-Assets | 1.42% | 30.11% |
| Interest Coverage | 186.56 | -72.42 |
| Asset Turnover | 0.32 | 0.81 |
| Fixed Asset Turnover | 2.93 | 2.76 |
| Payout Ratio | 16.89% | 0% |
| Dividend Yield | 0.74% | 0% |
Interpretation of the Ratios
Paycom Software, Inc.
Paycom’s financial ratios demonstrate strength, with favorable net margin (26.66%), ROE (31.85%), and ROIC (24.86%), indicating efficient profitability and capital use. Some concerns exist with a high PB ratio (7.31) and low dividend yield (0.74%), suggesting valuation premium and limited income return. The company pays dividends, but the yield is modest and payout sustainability should be monitored carefully.
Asana, Inc.
Asana shows weak profitability with negative net margin (-35.3%), ROE (-112.31%), and ROIC (-53.03%), reflecting ongoing losses and capital inefficiency. Debt levels are high with unfavorable debt-to-equity and interest coverage ratios. The company does not pay dividends, likely due to its growth and reinvestment strategy, prioritizing R&D and expanding operations over shareholder returns currently.
Which one has the best ratios?
Paycom holds a more favorable ratio profile, excelling in profitability, capital returns, and financial health, despite valuation concerns. Asana’s ratios are largely unfavorable, marked by losses and heavy debt, which weigh on overall assessment. Thus, Paycom’s ratios suggest a stronger financial position compared to Asana’s more challenged metrics.
Strategic Positioning
This section compares the strategic positioning of Paycom Software, Inc. and Asana, Inc. regarding market position, key segments, and exposure to technological disruption:
Paycom Software, Inc.
- Established US HCM software provider with mid-sized company focus; faces competitive software industry pressure.
- Focused on cloud-based human capital management with recurring revenue and implementation services.
- Relies on proprietary HCM SaaS with integrated data analytics and compliance features; moderate disruption risk.
Asana, Inc.
- Provides work management platform internationally; competes across diverse sectors including tech and healthcare.
- Work orchestration platform targeting individuals, teams, and executives across multiple industries.
- Operates in software collaboration space; faces ongoing innovation demands and competitive technological disruption.
Paycom Software, Inc. vs Asana, Inc. Positioning
Paycom pursues a concentrated strategy centered on HCM solutions with strong recurring revenue, while Asana targets broader work management across industries. Paycom’s focused niche supports stable revenue, whereas Asana’s diversified market exposure may face higher disruption.
Which has the best competitive advantage?
Paycom demonstrates a very favorable moat with growing ROIC and value creation, indicating durable competitive advantage. In contrast, Asana shows a very unfavorable moat with declining ROIC and value destruction, reflecting weaker competitive positioning.
Stock Comparison
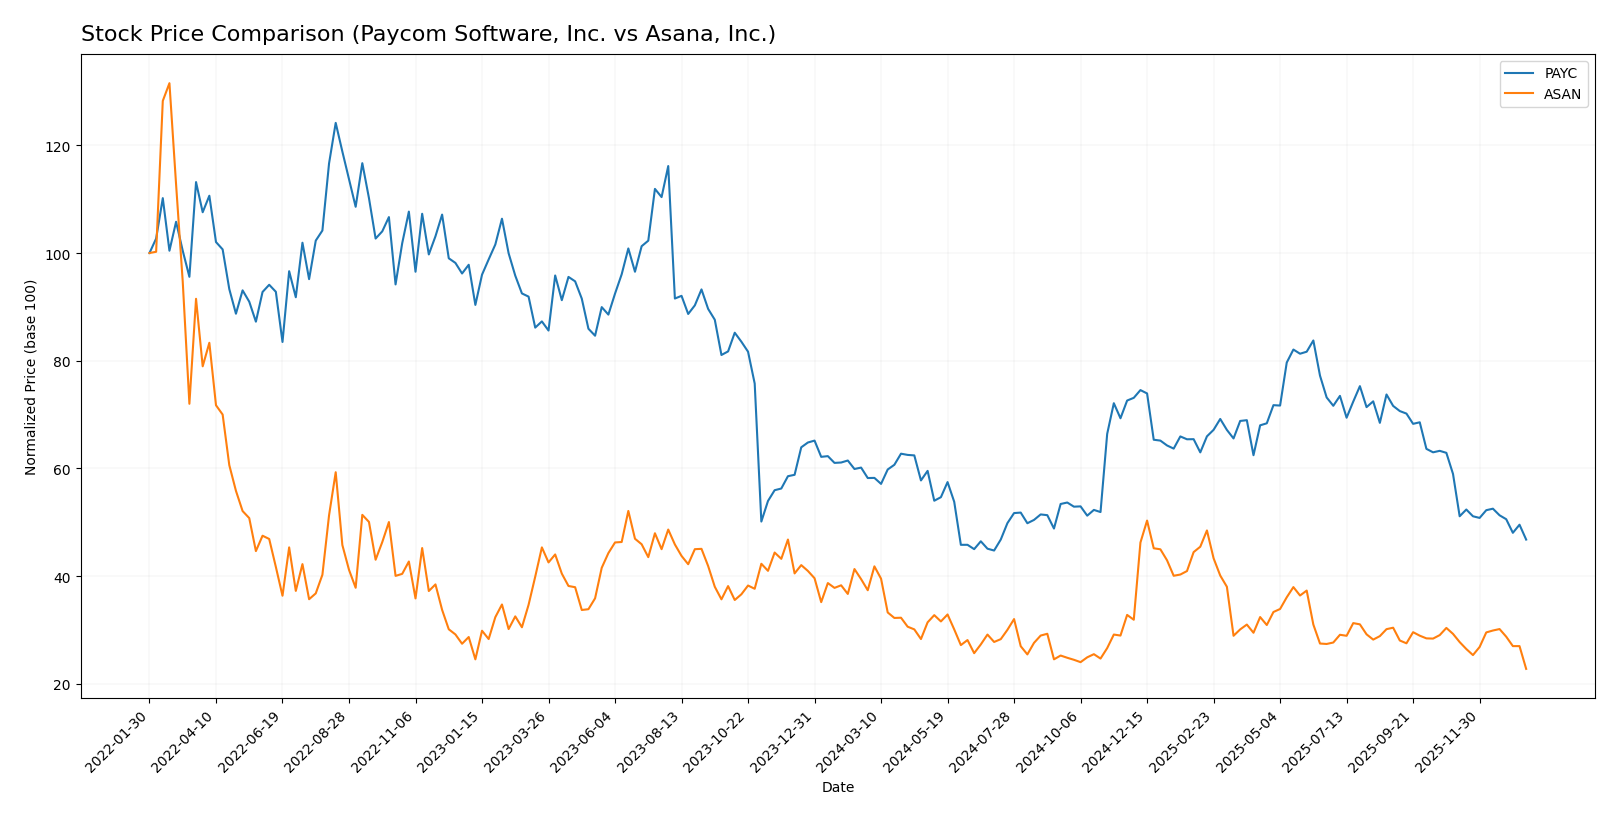
The stock prices of Paycom Software, Inc. and Asana, Inc. have both exhibited notable declines over the past 12 months, with distinct trading volume dynamics and decelerating bearish trends shaping their recent performance.
Trend Analysis
Paycom Software, Inc. (PAYC) experienced a -19.64% price change over the past year, indicating a bearish trend with deceleration. The stock showed high volatility with a standard deviation of 31.92, reaching a high of 265.71 and a low of 141.96.
Asana, Inc. (ASAN) saw a steeper decline of -39.07% over the same period, also bearish with deceleration. Volatility was lower, with a standard deviation of 2.87. The highest price was 24.15, and the lowest was 10.93.
Comparing both, PAYC delivered the higher market performance with a less severe decline than ASAN, despite both showing bearish trends and decreasing momentum.
Target Prices
Here is the current consensus on target prices for Paycom Software, Inc. and Asana, Inc.
| Company | Target High | Target Low | Consensus |
|---|---|---|---|
| Paycom Software, Inc. | 290 | 165 | 215 |
| Asana, Inc. | 18 | 14 | 15.75 |
Analysts expect Paycom’s stock to appreciate significantly, with a consensus target well above its current price of 148.41 USD. Asana’s consensus target of 15.75 USD also suggests upside from its current 10.93 USD, indicating moderate growth expectations.
Analyst Opinions Comparison
This section compares analysts’ ratings and grades for Paycom Software, Inc. and Asana, Inc.:
Rating Comparison
PAYC Rating
- Rating: A, indicating a very favorable outlook from analysts.
- Discounted Cash Flow Score: 5, showing strong confidence in future cash flow projections.
- ROE Score: 5, demonstrating excellent efficiency in generating profit from shareholder equity.
- ROA Score: 5, reflecting very effective asset utilization to generate earnings.
- Debt To Equity Score: 4, signaling relatively low financial risk with a strong balance sheet.
- Overall Score: 4, classified as favorable by analysts.
ASAN Rating
- Rating: D+, reflecting a very unfavorable evaluation by analysts.
- Discounted Cash Flow Score: 1, suggesting very unfavorable cash flow expectations.
- ROE Score: 1, indicating very poor profitability relative to equity.
- ROA Score: 1, showing very ineffective use of assets to generate earnings.
- Debt To Equity Score: 1, indicating high financial risk due to debt levels.
- Overall Score: 1, classified as very unfavorable in overall financial standing.
Which one is the best rated?
Based strictly on the provided data, Paycom Software, Inc. holds a significantly better analyst rating and financial scores compared to Asana, Inc. Paycom excels in cash flow, profitability, asset use, and financial stability metrics, while Asana scores very low across all categories.
Scores Comparison
The following table compares the Altman Z-Score and Piotroski Score for Paycom Software, Inc. and Asana, Inc.:
Paycom Scores
- Altman Z-Score: 3.84, indicating a safe zone with low bankruptcy risk.
- Piotroski Score: 5, reflecting average financial strength.
Asana Scores
- Altman Z-Score: -0.27, indicating distress zone with high bankruptcy risk.
- Piotroski Score: 4, reflecting average financial strength.
Which company has the best scores?
Paycom shows a stronger financial position with a safe zone Altman Z-Score compared to Asana’s distress zone score. Both companies have average Piotroski Scores, but Paycom’s higher Altman Z-Score indicates better overall stability.
Grades Comparison
Here is a comparison of the latest reliable grades issued by recognized grading companies for Paycom Software, Inc. and Asana, Inc.:
Paycom Software, Inc. Grades
The table below summarizes recent grades from major financial institutions for Paycom Software, Inc.:
| Grading Company | Action | New Grade | Date |
|---|---|---|---|
| Barclays | Maintain | Equal Weight | 2026-01-12 |
| TD Cowen | Maintain | Buy | 2026-01-08 |
| Citigroup | Maintain | Neutral | 2025-12-23 |
| Keybanc | Maintain | Overweight | 2025-11-06 |
| TD Cowen | Maintain | Buy | 2025-11-06 |
| UBS | Maintain | Buy | 2025-11-06 |
| Jefferies | Maintain | Hold | 2025-11-06 |
| JP Morgan | Maintain | Neutral | 2025-11-06 |
| Mizuho | Maintain | Neutral | 2025-11-06 |
| Barclays | Maintain | Equal Weight | 2025-11-06 |
Paycom’s grades generally trend around “Hold” to “Buy,” showing a balanced outlook with multiple “Buy” and “Neutral” ratings maintained over recent months.
Asana, Inc. Grades
Below is a summary of the most recent grades from reputable firms for Asana, Inc.:
| Grading Company | Action | New Grade | Date |
|---|---|---|---|
| Citigroup | Upgrade | Buy | 2026-01-15 |
| RBC Capital | Maintain | Underperform | 2026-01-05 |
| Keybanc | Upgrade | Overweight | 2025-12-15 |
| DA Davidson | Maintain | Neutral | 2025-12-04 |
| Citigroup | Maintain | Neutral | 2025-12-03 |
| RBC Capital | Maintain | Underperform | 2025-12-03 |
| UBS | Maintain | Neutral | 2025-12-03 |
| Baird | Maintain | Neutral | 2025-09-04 |
| Morgan Stanley | Maintain | Underweight | 2025-09-04 |
| Piper Sandler | Maintain | Overweight | 2025-09-04 |
Asana’s grades show a mix of “Neutral” and “Underperform,” with some upgrades to “Buy” and “Overweight,” indicating a cautiously improving outlook.
Which company has the best grades?
Asana, Inc. holds a consensus rating of “Buy” with several recent upgrades, whereas Paycom Software, Inc. maintains a “Hold” consensus despite multiple “Buy” ratings. This suggests Asana’s grades reflect a more optimistic near-term potential, which may influence investors seeking growth opportunities differently than Paycom’s more balanced outlook.
Strengths and Weaknesses
The table below compares key strengths and weaknesses of Paycom Software, Inc. (PAYC) and Asana, Inc. (ASAN) based on their recent financial and operational data.
| Criterion | Paycom Software, Inc. (PAYC) | Asana, Inc. (ASAN) |
|---|---|---|
| Diversification | Moderate, primarily focused on HR software with growing recurring revenue (1.73B USD in 2024) | Limited diversification, mainly workflow management software |
| Profitability | High profitability: 26.66% net margin, 31.85% ROE, strong ROIC (24.86%) | Negative profitability: -35.3% net margin, -112.31% ROE, negative ROIC (-53.03%) |
| Innovation | Sustained innovation with durable competitive advantage and growing ROIC (+54%) | Innovation present but unable to translate into profitability; ROIC sharply declining (-74%) |
| Global presence | Expanding presence with strong recurring revenue base | Smaller global footprint and no significant recurring revenue reported |
| Market Share | Strong market share in HR software with consistent value creation (ROIC > WACC by 17.2%) | Weak market position with value destruction (ROIC < WACC by -60.8%) |
Key takeaways: Paycom demonstrates a robust competitive moat with high profitability and growth in recurring revenue, making it a more stable investment. In contrast, Asana struggles with profitability and value creation, signaling higher risk for investors.
Risk Analysis
Below is a comparative table outlining key risk metrics for Paycom Software, Inc. (PAYC) and Asana, Inc. (ASAN) based on the most recent fiscal years available.
| Metric | Paycom Software, Inc. (PAYC) | Asana, Inc. (ASAN) |
|---|---|---|
| Market Risk | Beta 0.82 (moderate volatility) | Beta 0.92 (slightly higher volatility) |
| Debt Level | Very low debt-to-equity 0.05 (favorable) | High debt-to-equity 1.18 (unfavorable) |
| Regulatory Risk | Moderate (cloud software compliance) | Moderate (software and international regulations) |
| Operational Risk | Low (established SaaS platform, 7.3K employees) | Moderate (smaller scale, 1.8K employees) |
| Environmental Risk | Low (technology sector, limited direct impact) | Low (technology sector, limited direct impact) |
| Geopolitical Risk | Moderate (US based, global clients) | Moderate (US based, global clients) |
The most impactful and likely risks are Asana’s high debt level and negative profitability indicators, increasing financial distress risk. Paycom’s risks are comparatively lower, with stable margins and strong balance sheet metrics supporting resilience amid market volatility.
Which Stock to Choose?
Paycom Software, Inc. (PAYC) shows strong income growth with a 123.81% revenue increase over five years and consistently favorable profitability metrics, including a 26.66% net margin and 31.85% ROE. Its debt levels are low, and its financial ratios are mostly favorable, supported by a very favorable rating and a very favorable moat indicating durable competitive advantage.
Asana, Inc. (ASAN) exhibits positive revenue growth of 218.88% over five years but suffers from negative net margins (-35.3%) and returns (ROE -112.31%), reflecting ongoing losses and value destruction. Its debt is higher, and financial ratios are predominantly unfavorable, with a very unfavorable moat and a very unfavorable rating, signaling financial instability.
Investors focused on quality and durable profitability might find PAYC’s favorable financial profile and strong moat more aligned with their goals, while those prioritizing rapid top-line growth despite current losses could view ASAN’s metrics as indicative of a high-risk growth opportunity.
Disclaimer: Investment carries a risk of loss of initial capital. The past performance is not a reliable indicator of future results. Be sure to understand risks before making an investment decision.
Go Further
I encourage you to read the complete analyses of Paycom Software, Inc. and Asana, Inc. to enhance your investment decisions: