Home > Comparison > Technology > MTCH vs ASAN
The strategic rivalry between Match Group, Inc. and Asana, Inc. shapes the technology sector’s software application landscape. Match Group leads as a dominant, consumer-focused digital dating platform, while Asana innovates with a collaborative work management system targeting enterprises. This analysis pits a market veteran against a high-growth disruptor, aiming to identify which model offers superior risk-adjusted returns. I will assess their corporate trajectories to guide portfolio positioning in this competitive field.

Table of contents
Companies Overview
Match Group and Asana stand as pivotal players in the software application sector with distinct market roles.
Match Group, Inc.: Global Leader in Dating Platforms
Match Group dominates the online dating market through its portfolio, including Tinder and Hinge. Its core revenue engine derives from subscription fees and in-app purchases across diverse brands. In 2026, Match Group sharpens its focus on expanding user engagement and monetization within premium subscription services worldwide.
Asana, Inc.: Work Management Innovator
Asana leads in work management software, enabling teams to coordinate complex projects and daily tasks. It generates revenue primarily via subscription sales of its platform to enterprises and organizations. In 2026, Asana emphasizes scaling its platform adoption across multiple industries, enhancing integrations, and driving enterprise-level usage.
Strategic Collision: Similarities & Divergences
Both companies leverage software subscription models but target different user bases—consumer dating versus enterprise productivity. Their competitive battleground centers on user engagement and subscription growth within highly digital, service-driven markets. Match Group offers a more mature, cash-generative profile, while Asana presents higher growth potential but with elevated execution risks.
Income Statement Comparison
This data dissects the core profitability and scalability of both corporate engines to reveal who dominates the bottom line:
| Metric | Match Group, Inc. (MTCH) | Asana, Inc. (ASAN) |
|---|---|---|
| Revenue | 3.49B | 724M |
| Cost of Revenue | 948M | 77M |
| Operating Expenses | 1.67B | 913M |
| Gross Profit | 2.54B | 647M |
| EBITDA | 999M | -230M |
| EBIT | 894M | -247M |
| Interest Expense | 148M | 4M |
| Net Income | 613M | -256M |
| EPS | 2.53 | -1.11 |
| Fiscal Year | 2025 | 2025 |
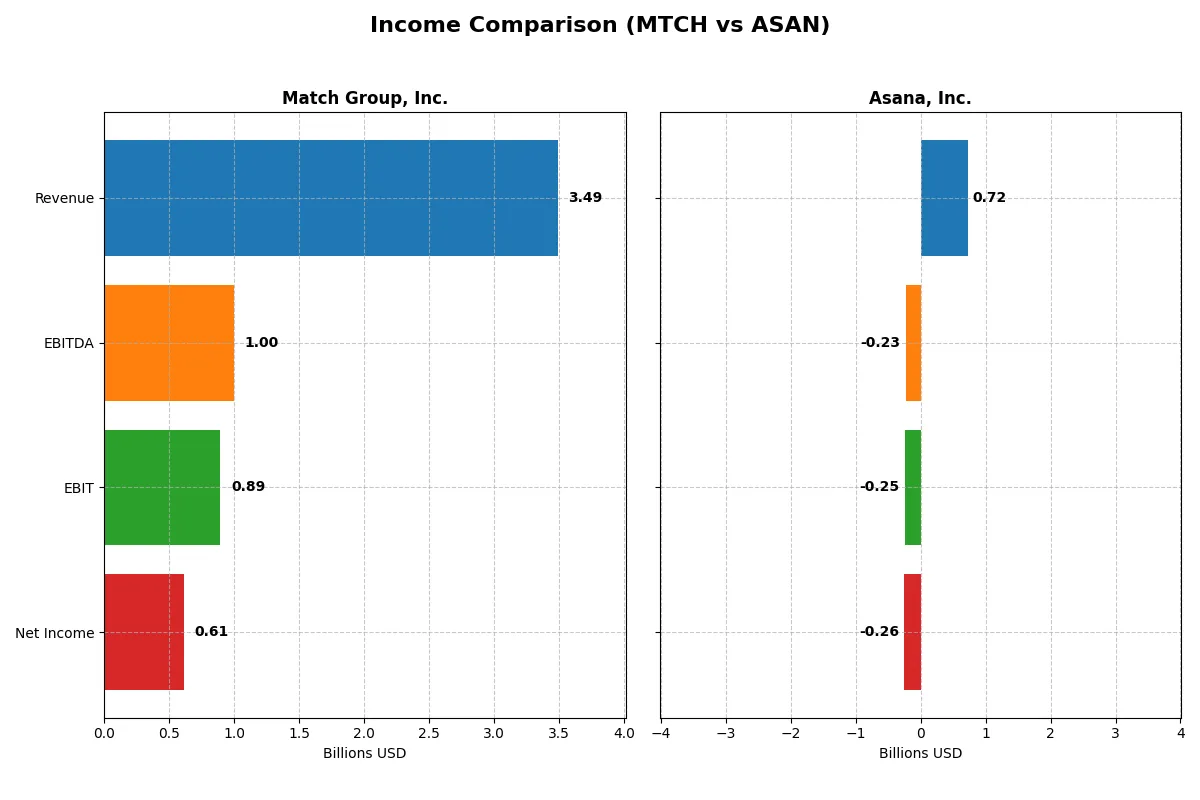
Income Statement Analysis: The Bottom-Line Duel
This income statement comparison reveals which company converts revenue into profit most efficiently and sustainably.
Match Group, Inc. Analysis
Match Group’s revenue grew modestly to $3.49B in 2025, with net income climbing to $613M, reflecting a strong upward trajectory. Its gross margin of 72.8% and net margin near 17.6% demonstrate robust profitability. Efficiency improved, with net margin growth of 11% year-over-year and EPS rising 18%, signaling solid momentum.
Asana, Inc. Analysis
Asana expanded revenue by nearly 11% to $724M in fiscal 2025, maintaining an impressive gross margin above 89%. However, it remains unprofitable with a net loss of $256M and a negative net margin of -35.3%. Despite this, Asana showed margin improvement and modest EPS growth, indicating gradual operational progress amid heavy investment.
Margin Strength vs. Growth Ambitions
Match Group leads with consistent profitability and margin expansion, while Asana prioritizes rapid top-line growth at the expense of current earnings. Match’s stable net income and strong margins make it the clear fundamental winner. Investors focused on earnings quality will find Match’s profile more attractive than Asana’s still-developing business model.
Financial Ratios Comparison
These vital ratios act as a diagnostic tool to expose the underlying fiscal health, valuation premiums, and capital efficiency of the companies compared below:
| Ratios | Match Group, Inc. (MTCH) | Asana, Inc. (ASAN) |
|---|---|---|
| ROE | -2.42% | -112.31% |
| ROIC | 22.50% | -53.03% |
| P/E | 12.77 | -19.16 |
| P/B | -30.91 | 21.52 |
| Current Ratio | 1.42 | 1.44 |
| Quick Ratio | 1.42 | 1.44 |
| D/E | -15.67 | 1.18 |
| Debt-to-Assets | 89.06% | 30.11% |
| Interest Coverage | 5.91 | -72.42 |
| Asset Turnover | 0.78 | 0.81 |
| Fixed Asset Turnover | 26.59 | 2.76 |
| Payout Ratio | 30.36% | 0% |
| Dividend Yield | 2.38% | 0% |
| Fiscal Year | 2025 | 2025 |
Efficiency & Valuation Duel: The Vital Signs
Ratios act as a company’s DNA, exposing hidden risks and operational strengths that numbers alone cannot reveal.
Match Group, Inc.
Match Group shows strong operational efficiency with a 17.6% net margin and a robust 22.5% ROIC, well above its 7.8% WACC. Its P/E of 12.8 signals a fairly valued stock. Despite a negative ROE, the 2.4% dividend yield offers steady shareholder returns, balancing growth and income.
Asana, Inc.
Asana struggles with a -35.3% net margin and deeply negative ROE and ROIC, reflecting operational challenges. Although its P/E is negative, the stock appears expensive relative to fundamentals. It pays no dividend, instead funneling resources into R&D, which accounts for nearly 47% of revenue, aiming to drive future growth.
Operational Strength Meets Growth Challenges
Match Group combines solid profitability and shareholder returns, presenting a balanced risk profile. Asana’s negative profitability and lack of dividends highlight higher risk, focused on reinvestment. Investors seeking operational safety may prefer Match, while those targeting growth potential might consider Asana’s aggressive R&D stance.
Which one offers the Superior Shareholder Reward?
Match Group (MTCH) pays a 2.38% dividend yield, supported by a 30% payout ratio and nearly full free cash flow coverage. It also engages in moderate buybacks, enhancing total returns sustainably. Asana (ASAN) pays no dividends and shows negative margins, focusing on reinvestment but with weak free cash flow and minimal buybacks. Historically, dividend payments combined with buybacks in a profitable, free cash flow-positive firm like MTCH offer more reliable shareholder rewards. I conclude MTCH delivers a superior total return profile for 2026 investors.
Comparative Score Analysis: The Strategic Profile
The radar chart reveals the fundamental DNA and trade-offs of Match Group, Inc. and Asana, Inc., highlighting their financial strengths and vulnerabilities:
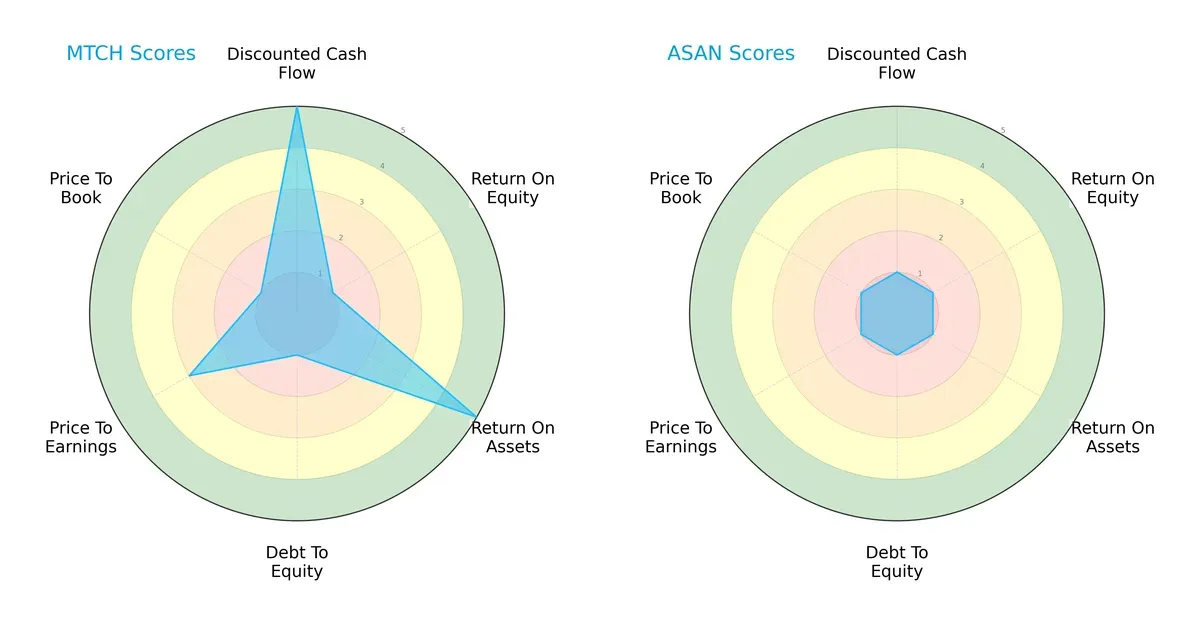
Match Group demonstrates a more balanced profile with strong discounted cash flow (DCF) and return on assets (ROA) scores, despite weak return on equity (ROE) and debt-to-equity metrics. Asana, however, scores uniformly low across all categories, indicating broad financial challenges. Match Group relies on its asset efficiency and cash flow generation, while Asana lacks a clear financial edge.
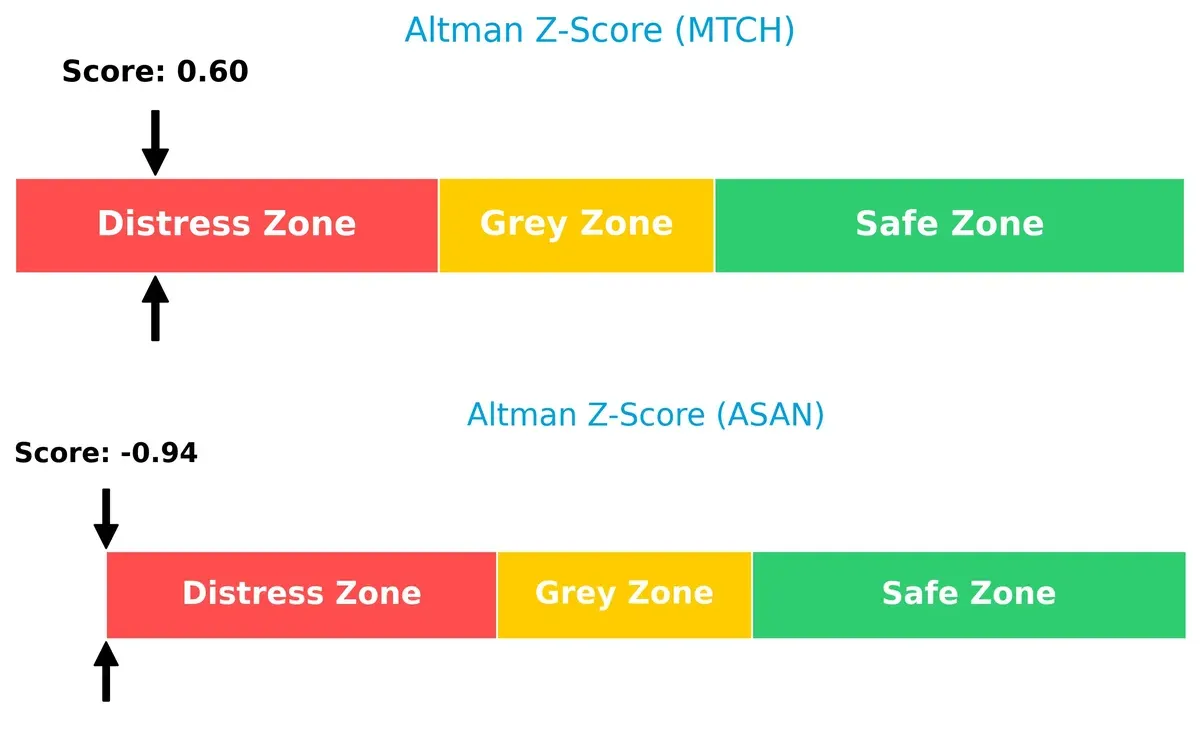
Bankruptcy Risk: Solvency Showdown
The Altman Z-Scores place both firms in the distress zone, but Match Group’s score (0.60) edges higher than Asana’s (-0.94), suggesting relatively better survival odds in this cycle:
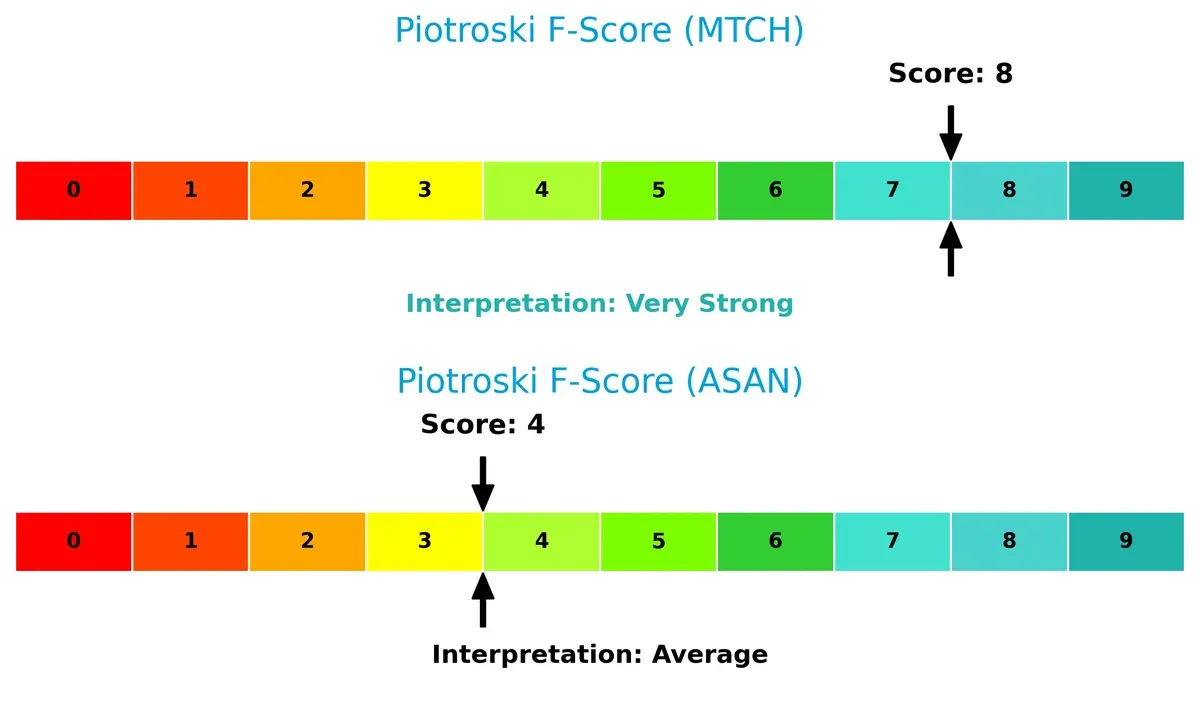
Financial Health: Quality of Operations
Match Group’s Piotroski F-Score of 8 signals very strong financial health, whereas Asana’s score of 4 reflects average operational quality and potential red flags in internal metrics:
How are the two companies positioned?
This section dissects the operational DNA of Match Group and Asana by comparing their revenue distribution and internal dynamics. The goal is to confront their economic moats to identify which model offers the most resilient competitive advantage.
Revenue Segmentation: The Strategic Mix
This visual comparison dissects how Match Group, Inc. and Asana, Inc. diversify their income streams and where their primary sector bets lie:
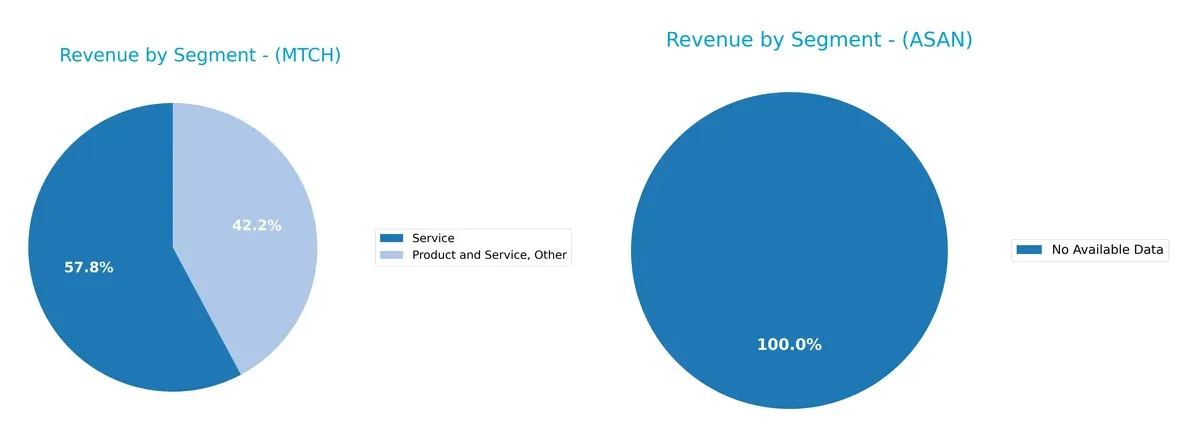
Match Group leans heavily on its dating-related services, with segments like Match Group and Service generating multi-billion-dollar revenues. Asana, Inc. lacks available segmentation data, limiting direct comparison. Match Group’s concentration on dating anchors its ecosystem lock-in but raises concentration risk. Without diversification across distinct sectors, Match depends on maintaining dominance in its niche rather than balancing multiple income streams.
Strengths and Weaknesses Comparison
This table compares the Strengths and Weaknesses of Match Group and Asana:
Match Group Strengths
- Strong global presence with nearly 3.5B revenue in US and Non-US markets
- Favorable net margin at 17.59%
- High ROIC of 22.5%, well above WACC of 7.81%
- Solid quick ratio at 1.42
- Favorable interest coverage at 6.06
Asana Strengths
- Balanced US and Non-US revenue totaling 724M in 2025
- Favorable WACC at 7.82%
- Positive PE valuation despite negative earnings
- Quick ratio of 1.44 supports liquidity
Match Group Weaknesses
- Negative ROE at -241.99% signals shareholder return issues
- High debt to assets at 89.06% raises leverage concerns
- Negative PB ratio at -30.91, unusual valuation metric
- Neutral current ratio at 1.42 limits short-term flexibility
Asana Weaknesses
- Negative net margin at -35.3% shows unprofitability
- Negative ROE and ROIC indicate poor capital efficiency
- Unfavorable debt-to-equity and interest coverage ratios
- No dividend yield reduces income appeal
Match Group shows strong profitability and global scale but carries high financial leverage risk. Asana struggles with profitability and capital efficiency despite decent liquidity and global reach. These factors will influence each company’s strategic priorities and investor risk profiles.
The Moat Duel: Analyzing Competitive Defensibility
A structural moat shields long-term profits from relentless competitive pressures. Without it, earnings erode rapidly. Here’s how Match Group and Asana stack up:
Match Group, Inc.: Dominant Network Effects
Match Group’s moat stems from powerful network effects across its portfolio, including Tinder and Hinge. This translates into high ROIC (15%) and stable 25% EBIT margins. Expansion into new international markets in 2026 could deepen its lead.
Asana, Inc.: Emerging Intangible Assets
Asana relies on intangible assets like proprietary workflow tech and brand recognition. However, its declining ROIC and negative EBIT margins highlight a weak moat compared to Match. Growth in enterprise adoption may boost defensibility, but profitability remains a key risk.
Network Effects vs. Intangible Assets: The Moat Showdown
Match Group’s wide, durable network-effect moat outmatches Asana’s fragile intangible asset base. Match demonstrates consistent value creation and margin stability. It is better equipped to defend and expand its market share in 2026.
Which stock offers better returns?
The past year reveals a clear divergence in price trajectories for Match Group and Asana, marked by sustained declines and shifting trading volumes.
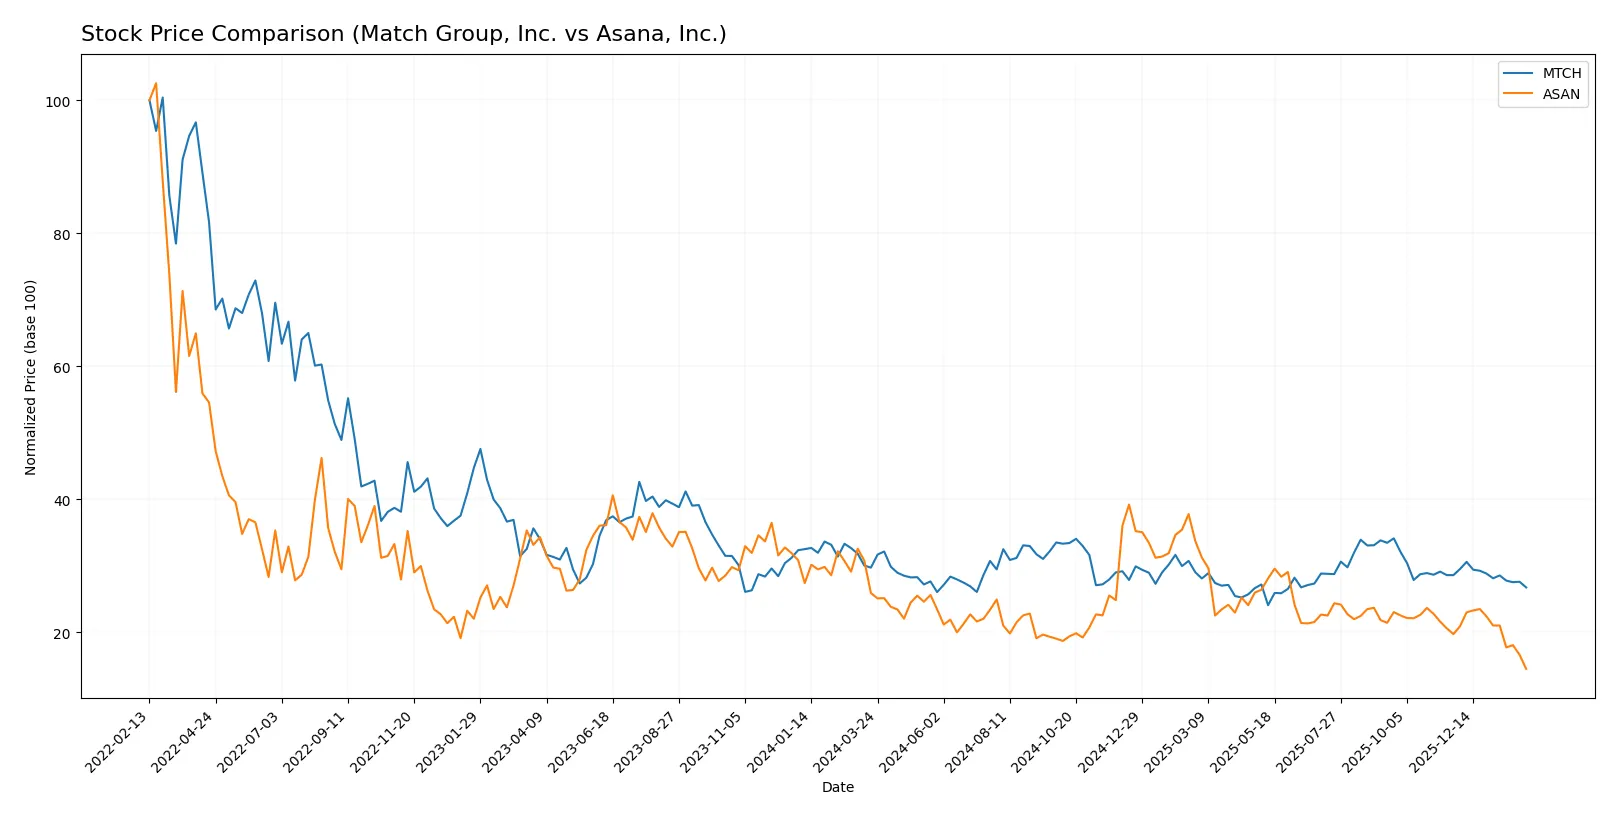
Trend Comparison
Match Group’s stock fell 10.01% over the past 12 months, signaling a bearish trend with decelerating losses and a high-low range from 38.51 to 27.18. Recent weeks show continued decline but at a slower pace.
Asana’s stock dropped sharply by 43.95% over the same period, also bearish with decelerating downside momentum. Price fluctuated between 24.15 and 8.95, and recent months experienced an accelerated sell-off.
Comparing both, Match Group outperformed Asana, delivering a smaller loss and less volatile price action across the year.
Target Prices
Analysts present a cautiously optimistic consensus for Match Group, Inc. and Asana, Inc.
| Company | Target Low | Target High | Consensus |
|---|---|---|---|
| Match Group, Inc. | 33 | 43 | 36 |
| Asana, Inc. | 14 | 18 | 15.4 |
Match Group’s target consensus at $36 exceeds its current price of $30.18, signaling moderate upside potential. Asana’s consensus of $15.4 also suggests a significant rebound from its $8.79 trading price.

Don’t Let Luck Decide Your Entry Point
Optimize your entry points with our advanced ProRealTime indicators. You’ll get efficient buy signals with precise price targets for maximum performance. Start outperforming now!
How do institutions grade them?
Here is a summary of recent institutional grades for Match Group, Inc. and Asana, Inc.:
Match Group, Inc. Grades
The following table shows recent grades assigned by reputable institutions to Match Group, Inc.:
| Grading Company | Action | New Grade | Date |
|---|---|---|---|
| Truist Securities | Maintain | Hold | 2026-02-04 |
| JP Morgan | Maintain | Neutral | 2026-02-04 |
| Morgan Stanley | Maintain | Equal Weight | 2026-01-13 |
| Truist Securities | Maintain | Hold | 2025-11-05 |
| Evercore ISI Group | Maintain | In Line | 2025-11-05 |
| Wells Fargo | Maintain | Equal Weight | 2025-11-05 |
| Morgan Stanley | Maintain | Equal Weight | 2025-10-20 |
| Susquehanna | Maintain | Positive | 2025-08-07 |
| JP Morgan | Maintain | Neutral | 2025-08-06 |
| Evercore ISI Group | Maintain | In Line | 2025-08-06 |
Asana, Inc. Grades
Below are recent institutional grades for Asana, Inc. provided by credible grading companies:
| Grading Company | Action | New Grade | Date |
|---|---|---|---|
| Piper Sandler | Maintain | Overweight | 2026-02-03 |
| Citigroup | Upgrade | Buy | 2026-01-15 |
| RBC Capital | Maintain | Underperform | 2026-01-05 |
| Keybanc | Upgrade | Overweight | 2025-12-15 |
| DA Davidson | Maintain | Neutral | 2025-12-04 |
| UBS | Maintain | Neutral | 2025-12-03 |
| RBC Capital | Maintain | Underperform | 2025-12-03 |
| Citigroup | Maintain | Neutral | 2025-12-03 |
| Piper Sandler | Maintain | Overweight | 2025-09-04 |
| Baird | Maintain | Neutral | 2025-09-04 |
Which company has the best grades?
Asana, Inc. has received more positive upgrades and higher ratings including “Buy” and “Overweight.” Match Group, Inc. shows a consistent “Hold” to “Neutral” stance. This suggests Asana enjoys stronger institutional confidence, potentially attracting more investor interest.
Risks specific to each company
The following categories identify the critical pressure points and systemic threats facing both firms in the 2026 market environment:
1. Market & Competition
Match Group, Inc.
- Dominates online dating with strong brand portfolio but faces intense competition from new social apps.
Asana, Inc.
- Operates in a crowded work management space with fierce competition from larger incumbents and emerging SaaS startups.
2. Capital Structure & Debt
Match Group, Inc.
- High debt-to-assets ratio (89%) signals financial leverage risk despite decent interest coverage.
Asana, Inc.
- Moderate debt-to-assets (30%), but negative interest coverage indicates distress in servicing debt.
3. Stock Volatility
Match Group, Inc.
- Beta of 1.315 suggests above-market volatility, typical for tech growth firms.
Asana, Inc.
- Beta near 0.957 indicates lower volatility but less market sensitivity.
4. Regulatory & Legal
Match Group, Inc.
- Faces privacy and data protection scrutiny due to sensitive user information.
Asana, Inc.
- Subject to software compliance and potential antitrust reviews in SaaS industry.
5. Supply Chain & Operations
Match Group, Inc.
- Digital service delivery limits traditional supply chain risks but relies heavily on platform uptime.
Asana, Inc.
- Cloud infrastructure dependence exposes it to operational risks and vendor concentration.
6. ESG & Climate Transition
Match Group, Inc.
- Limited direct ESG risks but increasing pressure on digital privacy and ethical data use.
Asana, Inc.
- Faces ESG scrutiny on data center energy use and corporate governance improvements.
7. Geopolitical Exposure
Match Group, Inc.
- Global user base exposed to regulatory variations and geopolitical tensions impacting data flows.
Asana, Inc.
- Mainly US-based but expanding internationally, facing geopolitical risks in cloud service markets.
Which company shows a better risk-adjusted profile?
Match Group’s biggest risk is its high financial leverage, which could amplify market shocks despite solid operational cash flow. Asana struggles more fundamentally with negative profitability and debt servicing issues, raising bankruptcy concerns. I see Match Group showing a comparatively better risk-adjusted profile, supported by its very strong Piotroski score of 8 versus Asana’s average 4. However, Match Group’s Altman Z-score near 0.6 signals distress risk, so caution remains warranted.
Final Verdict: Which stock to choose?
Match Group, Inc. wields a robust cash-generating engine fueled by a wide moat and a return on invested capital well above its cost of capital. Its heavy intangible asset base and elevated debt levels remain points of vigilance. It fits an aggressive growth portfolio seeking durable profitability and scale.
Asana, Inc. offers a strategic moat rooted in rapid revenue expansion and cloud-based workflow integration, appealing for its growth potential. However, its consistent value destruction and weaker financial health suggest a higher risk profile compared to Match Group. It suits investors with a high-risk tolerance seeking growth at a reasonable price.
If you prioritize sustainable value creation and stable cash flows, Match Group outshines due to its strong economic moat and improving profitability. However, if you seek high revenue growth and can tolerate financial instability, Asana offers superior top-line momentum but at a significant risk premium. Both present distinct analytical scenarios depending on your risk appetite and investment horizon.
Disclaimer: Investment carries a risk of loss of initial capital. The past performance is not a reliable indicator of future results. Be sure to understand risks before making an investment decision.
Go Further
I encourage you to read the complete analyses of Match Group, Inc. and Asana, Inc. to enhance your investment decisions: