In the dynamic world of software applications, Intuit Inc. and Asana, Inc. stand out as influential players shaping productivity and financial management. Intuit, with its extensive suite of financial tools, and Asana, specializing in collaborative work management, both target overlapping markets focused on business efficiency and innovation. This article will explore their strengths and strategies to help you decide which company presents the most compelling investment opportunity in 2026.

Table of contents
Companies Overview
I will begin the comparison between Intuit and Asana by providing an overview of these two companies and their main differences.
Intuit Overview
Intuit Inc. delivers financial management and compliance products for consumers, small businesses, self-employed individuals, and accounting professionals across the US, Canada, and internationally. Its offerings span cloud-based and desktop software, payroll, payment-processing solutions, and personal finance services. With a market cap of 151.7B USD, Intuit operates through four key segments and serves a broad customer base from Mountain View, California.
Asana Overview
Asana, Inc. operates a work management platform designed for individuals, teams, and executives to coordinate tasks and strategic initiatives globally. The platform supports diverse industries including technology, retail, education, and healthcare. Founded in 2008 and headquartered in San Francisco, Asana has a market cap of 2.6B USD and focuses on enhancing organizational productivity through its collaborative software solutions.
Key similarities and differences
Both Intuit and Asana operate in the software-application industry, offering digital tools that improve business and individual productivity. Intuit primarily targets financial management and compliance with a mature product suite, while Asana focuses on work management and project orchestration. Their business models differ in scale and customer focus, with Intuit serving a wider financial services market and Asana concentrating on workflow and team collaboration.
Income Statement Comparison
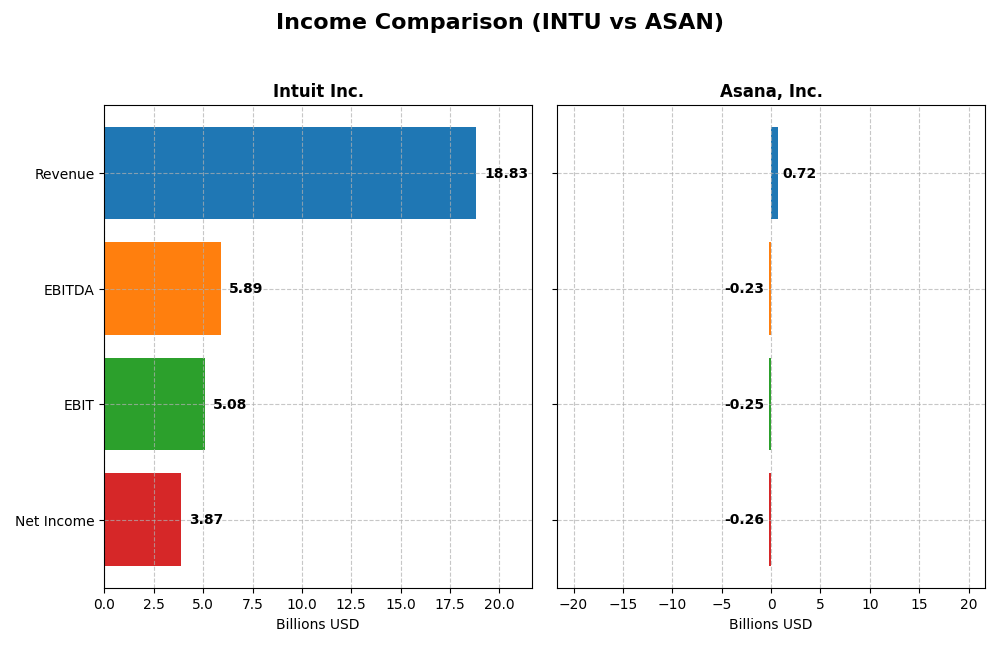
This table compares the key income statement metrics for Intuit Inc. and Asana, Inc. for their most recent fiscal year, providing a snapshot of their financial performance.
| Metric | Intuit Inc. (INTU) | Asana, Inc. (ASAN) |
|---|---|---|
| Market Cap | 151.7B | 2.62B |
| Revenue | 18.83B | 724M |
| EBITDA | 5.89B | -230M |
| EBIT | 5.08B | -247M |
| Net Income | 3.87B | -256M |
| EPS | 13.82 | -1.11 |
| Fiscal Year | 2025 | 2025 |
Income Statement Interpretations
Intuit Inc.
Intuit’s revenue and net income have consistently grown from 2021 to 2025, with revenue nearly doubling and net income rising by 87.6%. Margins remain strong, with a gross margin above 80% and a net margin around 20%. In 2025, revenue growth accelerated to 15.6%, and net margin improved by 12.9%, reflecting solid operational efficiency and profitability gains.
Asana, Inc.
Asana has experienced rapid revenue growth, increasing by 218.9% over the period 2021–2025, but net income remains negative and declined over the same timeframe. The company maintains a high gross margin of 89.3%, yet it reports a negative EBIT margin near -34%, indicating ongoing operating losses. In 2025, revenue growth slowed to 10.9%, while net margin improved but stayed negative at -35.3%.
Which one has the stronger fundamentals?
Intuit exhibits stronger fundamentals with sustained profitability, favorable margin stability, and consistent net income growth. Asana shows impressive revenue expansion but continues to incur significant losses and negative operating margins. Intuit’s financial health is supported by positive earnings and margin improvements, contrasting with Asana’s ongoing challenges in achieving profitability.
Financial Ratios Comparison
This table presents the most recent fiscal year financial ratios for Intuit Inc. and Asana, Inc., enabling a straightforward comparison of key performance and financial health indicators.
| Ratios | Intuit Inc. (2025) | Asana, Inc. (2025) |
|---|---|---|
| ROE | 19.6% | -112.3% |
| ROIC | 14.8% | -53.0% |
| P/E | 56.8 | -19.2 |
| P/B | 11.2 | 21.5 |
| Current Ratio | 1.36 | 1.44 |
| Quick Ratio | 1.36 | 1.44 |
| D/E (Debt to Equity) | 0.34 | 1.18 |
| Debt-to-Assets | 18.0% | 30.1% |
| Interest Coverage | 19.9 | -72.4 |
| Asset Turnover | 0.51 | 0.81 |
| Fixed Asset Turnover | 12.5 | 2.76 |
| Payout Ratio | 30.7% | 0% |
| Dividend Yield | 0.54% | 0% |
Interpretation of the Ratios
Intuit Inc.
Intuit’s financial ratios show overall strength with favorable net margin at 20.55%, ROE at 19.63%, and ROIC at 14.78%. Debt levels and interest coverage are well managed, while valuation ratios like PE (56.82) and PB (11.15) are less attractive. The company pays dividends, but the low dividend yield of 0.54% and payout ratio suggest cautious distribution supported by solid free cash flow.
Asana, Inc.
Asana’s ratios reveal weaknesses including a negative net margin of -35.3%, ROE of -112.31%, and ROIC of -53.03%, indicating persistent losses and inefficient capital use. The company does not pay dividends, reflecting its high-growth phase and reinvestment focus. Debt levels are elevated, and interest coverage is negative, signaling financial stress and operational challenges.
Which one has the best ratios?
Intuit clearly shows stronger and more favorable financial metrics, with solid profitability, manageable leverage, and stable cash flow supporting shareholder returns. In contrast, Asana’s ratios indicate significant financial difficulties and negative returns, reflecting its early-stage growth status. Intuit’s balanced profile contrasts with Asana’s riskier financial position.
Strategic Positioning
This section compares the strategic positioning of Intuit Inc. and Asana, Inc., including market position, key segments, and exposure to technological disruption:
Intuit Inc.
- Leading software application company with strong market presence; faces competition in finance and accounting software sectors.
- Diverse business segments: Small Business & Self-Employed, Consumer, Credit Karma, and ProConnect, driving revenue growth and stability.
- Operates in established financial management software with gradual innovation; moderate exposure to disruption through cloud adoption.
Asana, Inc.
- Smaller software application firm focused on work management platform; competitive pressure from broader SaaS industry.
- Concentrated on a single work management platform serving multiple industries including tech, retail, and healthcare.
- Positioned in dynamic SaaS market with evolving workflows; higher exposure to rapid technological changes and platform innovation.
Intuit Inc. vs Asana, Inc. Positioning
Intuit adopts a diversified approach across multiple financial software segments, providing varied revenue streams and market depth. In contrast, Asana focuses on a concentrated platform strategy within work management, offering niche specialization but with narrower business scope and higher market vulnerability.
Which has the best competitive advantage?
Intuit shows a slightly favorable moat with value creation despite declining profitability, indicating a sustainable competitive advantage. Asana’s very unfavorable moat and value destruction reflect weaker capital efficiency and competitive positioning over the period analyzed.
Stock Comparison
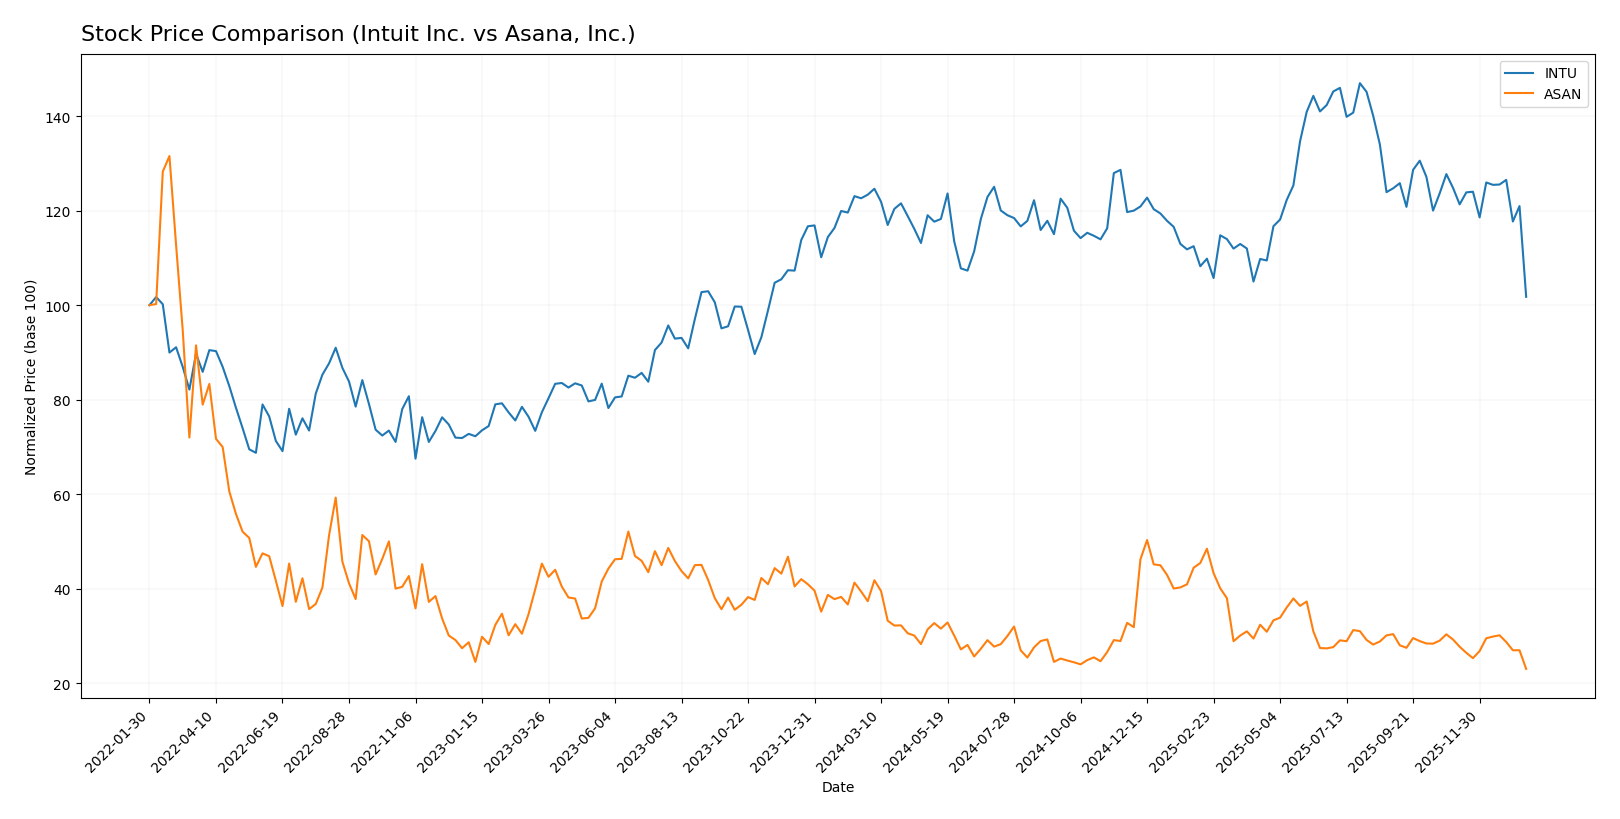
The stock price movements of Intuit Inc. and Asana, Inc. over the past 12 months reveal significant bearish trends characterized by notable declines and decelerating downward momentum.
Trend Analysis
Intuit Inc. experienced a bearish trend over the past year with a price decline of 17.52%, showing deceleration and high volatility, with prices ranging from 785.95 to 544.22. Recent months confirm continued negative momentum with an 18.47% drop.
Asana, Inc. also followed a bearish trend, suffering a steeper 38.29% price decrease over the year, with lower volatility than Intuit. Its trend decelerated, with a recent 21.21% decline indicating persistent downward pressure.
Comparing both, Intuit’s stock outperformed Asana’s, delivering a smaller loss and higher price levels, thus showing relatively better market performance over the analyzed period.
Target Prices
The current analyst consensus presents a bullish outlook for Intuit Inc. and a modest upside for Asana, Inc.
| Company | Target High | Target Low | Consensus |
|---|---|---|---|
| Intuit Inc. | 880 | 700 | 798.4 |
| Asana, Inc. | 18 | 14 | 15.75 |
For Intuit, the consensus target price of 798.4 USD suggests a significant potential upside from the current 544.99 USD stock price. Asana’s target consensus near 15.75 USD also indicates moderate growth compared to its current price of 11.07 USD.
Analyst Opinions Comparison
This section compares analysts’ ratings and grades for Intuit Inc. and Asana, Inc.:
Rating Comparison
Intuit Inc. Rating
- Rating: B, evaluated as Very Favorable by analysts.
- Discounted Cash Flow Score: 4, indicating a Favorable assessment of future cash flow.
- ROE Score: 4, Favorable, reflecting efficient profit generation from equity.
- ROA Score: 5, Very Favorable, showing excellent asset utilization.
- Debt To Equity Score: 2, Moderate, implying a balanced level of financial risk.
- Overall Score: 3, Moderate rating summarizing financial standing.
Asana, Inc. Rating
- Rating: D+, also marked as Very Favorable in evaluation.
- Discounted Cash Flow Score: 1, considered Very Unfavorable, indicating low valuation.
- ROE Score: 1, Very Unfavorable, suggesting poor equity profit efficiency.
- ROA Score: 1, Very Unfavorable, indicating weak asset efficiency.
- Debt To Equity Score: 1, Very Unfavorable, indicating higher financial risk.
- Overall Score: 1, Very Unfavorable summary of financial health.
Which one is the best rated?
Based strictly on the provided data, Intuit holds a clearly superior rating and financial scores across all key metrics compared to Asana. Intuit’s scores range from Moderate to Very Favorable, while Asana consistently scores Very Unfavorable, indicating a stronger financial standing for Intuit.
Scores Comparison
Here is a comparison of the financial health scores for Intuit and Asana, Inc.:
Intuit Scores
- Altman Z-Score: 9.35, indicating a safe zone with low bankruptcy risk.
- Piotroski Score: 9, a very strong financial strength rating.
Asana Scores
- Altman Z-Score: -0.27, indicating a distress zone with high bankruptcy risk.
- Piotroski Score: 4, indicating average financial strength.
Which company has the best scores?
Intuit exhibits much stronger financial health with a safe zone Altman Z-Score of 9.35 and a very strong Piotroski Score of 9. In contrast, Asana’s scores show financial distress risk and only average financial strength.
Grades Comparison
The following tables present the recent grades assigned to Intuit Inc. and Asana, Inc. by various reliable grading companies:
Intuit Inc. Grades
This table summarizes recent analyst grades and rating actions from established financial institutions for Intuit Inc.
| Grading Company | Action | New Grade | Date |
|---|---|---|---|
| Wells Fargo | Downgrade | Equal Weight | 2026-01-08 |
| Wells Fargo | Maintain | Overweight | 2025-11-21 |
| RBC Capital | Maintain | Outperform | 2025-11-21 |
| BMO Capital | Maintain | Outperform | 2025-11-21 |
| Evercore ISI Group | Maintain | Outperform | 2025-11-18 |
| RBC Capital | Maintain | Outperform | 2025-09-02 |
| RBC Capital | Maintain | Outperform | 2025-08-22 |
| UBS | Maintain | Neutral | 2025-08-22 |
| Morgan Stanley | Maintain | Overweight | 2025-08-22 |
| Barclays | Maintain | Overweight | 2025-08-22 |
Intuit’s grades show a strong consensus around Outperform and Overweight ratings, with a recent slight downgrade to Equal Weight by Wells Fargo.
Asana, Inc. Grades
This table provides the recent grading updates from reputable financial analysts for Asana, Inc.
| Grading Company | Action | New Grade | Date |
|---|---|---|---|
| Citigroup | Upgrade | Buy | 2026-01-15 |
| RBC Capital | Maintain | Underperform | 2026-01-05 |
| Keybanc | Upgrade | Overweight | 2025-12-15 |
| DA Davidson | Maintain | Neutral | 2025-12-04 |
| Citigroup | Maintain | Neutral | 2025-12-03 |
| RBC Capital | Maintain | Underperform | 2025-12-03 |
| UBS | Maintain | Neutral | 2025-12-03 |
| Baird | Maintain | Neutral | 2025-09-04 |
| Morgan Stanley | Maintain | Underweight | 2025-09-04 |
| Piper Sandler | Maintain | Overweight | 2025-09-04 |
Asana’s ratings display more mixed opinions, with upgrades to Buy and Overweight but also several Underperform and Neutral ratings remaining.
Which company has the best grades?
Intuit Inc. consistently holds Outperform and Overweight ratings from multiple major analysts, whereas Asana, Inc. shows a more mixed grading profile with fewer strong positive ratings. This suggests investors may perceive Intuit as having a more favorable outlook, potentially reflecting steadier confidence in its performance and prospects.
Strengths and Weaknesses
Below is a comparison table highlighting the key strengths and weaknesses of Intuit Inc. and Asana, Inc. based on their latest financial and operational data.
| Criterion | Intuit Inc. (INTU) | Asana, Inc. (ASAN) |
|---|---|---|
| Diversification | Highly diversified with multiple segments: Consumer (4.87B), Global Business Solutions (11.08B), Credit Karma (2.26B), Professional Tax (0.62B) | Limited diversification; primarily focused on work management software |
| Profitability | Strong profitability: net margin 20.55%, ROIC 14.78%, favorable financial ratios overall | Negative profitability: net margin -35.3%, ROIC -53.03%, many unfavorable financial ratios |
| Innovation | Established product innovation with steady revenue growth across segments | Innovation focus but struggling to convert into profitability and positive returns |
| Global presence | Significant global reach, especially in financial and business solutions | More limited global presence, still expanding in enterprise markets |
| Market Share | Large market share in financial software and tax preparation | Smaller market share in work management, facing strong competition |
Intuit demonstrates a robust and diversified business model with strong profitability and global reach, although its ROIC shows a slight decline. Asana, while innovative, struggles with profitability and value creation, reflecting a higher risk profile for investors.
Risk Analysis
Below is a comparative table highlighting key risk factors for Intuit Inc. and Asana, Inc. based on the most recent data for 2025.
| Metric | Intuit Inc. (INTU) | Asana, Inc. (ASAN) |
|---|---|---|
| Market Risk | Beta 1.25, moderate volatility | Beta 0.92, lower volatility |
| Debt level | Low debt-to-equity 0.34, favorable | High debt-to-equity 1.18, unfavorable |
| Regulatory Risk | Moderate, financial software compliance required | Moderate, SaaS regulations and privacy |
| Operational Risk | Established with 18.8K employees, stable operations | Smaller scale, 1.8K employees, growth phase risks |
| Environmental Risk | Low, primarily software business | Low, primarily software business |
| Geopolitical Risk | Moderate, global presence in US, Canada, international | Moderate, US-based with international clients |
Intuit’s key risks lie in market fluctuations and valuation concerns despite strong financial health and low debt. Asana faces higher financial risk due to elevated debt and negative profitability, increasing bankruptcy risk as indicated by its Altman Z-Score in the distress zone. Investors should weigh Intuit’s stability against Asana’s growth volatility carefully.
Which Stock to Choose?
Intuit Inc. (INTU) shows a favorable income evolution with 15.63% revenue growth in 2025 and overall profitability metrics strong, including a 20.55% net margin. Its financial ratios are mostly favorable, supported by moderate debt levels and a solid B rating. The company creates value with a slightly declining ROIC trend but maintains strong operational efficiency and liquidity.
Asana, Inc. (ASAN) reports positive revenue growth of 10.94% for 2025 but faces significant profitability challenges, with a -35.3% net margin and unfavorable financial ratios in key areas such as ROE and debt management. The company is rated D+ with a very unfavorable moat status, signaling value destruction and financial distress, despite some favorable liquidity measures.
Considering the ratings and overall financial evaluations, INTU might appear more suitable for investors prioritizing stability, profitability, and value creation, while ASAN could be interpreted as fitting for those with a higher risk tolerance seeking growth potential amid financial challenges. The choice depends heavily on the investor’s risk profile and investment strategy.
Disclaimer: Investment carries a risk of loss of initial capital. The past performance is not a reliable indicator of future results. Be sure to understand risks before making an investment decision.
Go Further
I encourage you to read the complete analyses of Intuit Inc. and Asana, Inc. to enhance your investment decisions: