Home > Comparison > Technology > FICO vs ASAN
The strategic rivalry between Fair Isaac Corporation and Asana, Inc. shapes the evolution of the technology sector’s software application landscape. Fair Isaac operates as a mature, analytics-driven software provider with a strong focus on decision management and scoring solutions. In contrast, Asana delivers a high-growth, collaborative work management platform targeting diverse industries. This analysis will assess which business model offers superior risk-adjusted returns for a diversified portfolio amid shifting market dynamics.
Table of contents
Companies Overview
Fair Isaac Corporation and Asana, Inc. stand as pivotal players in the competitive software application market.
Fair Isaac Corporation: Pioneer in Decision Analytics
Fair Isaac Corporation dominates the analytics and decision management space with software and data products that automate business decisions globally. Its core revenue stems from two segments: Scores, delivering scoring solutions, and Software, offering modular decision platforms. In 2026, it sharpens its focus on expanding its analytic capabilities to support advanced decision use cases across industries.
Asana, Inc.: Orchestrator of Work Management
Asana, Inc. leads in work management software, enabling teams to coordinate tasks and strategic initiatives worldwide. Its platform drives revenue by serving diverse sectors with tools for project tracking and organizational goal setting. The company’s latest strategic thrust targets enhancing collaboration features to capture broader enterprise adoption in 2026.
Strategic Collision: Similarities & Divergences
Fair Isaac embraces a data-driven, analytics-heavy closed ecosystem, while Asana promotes an open, collaborative infrastructure. Their competition centers on integrating software to optimize enterprise decision-making and productivity. Investors face two distinct profiles: Fair Isaac’s mature, niche dominance contrasts with Asana’s growth-oriented, platform-centric approach.
Income Statement Comparison
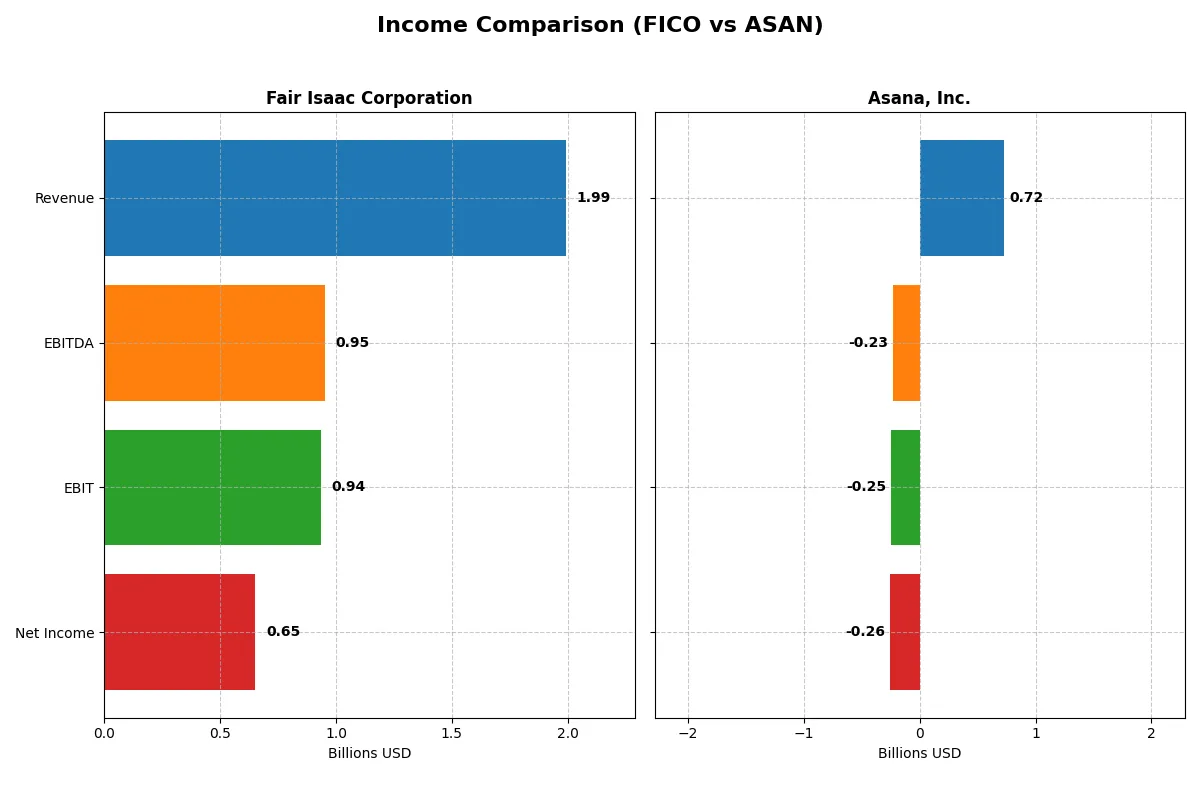
This data dissects the core profitability and scalability of both corporate engines to reveal who dominates the bottom line:
| Metric | Fair Isaac Corporation (FICO) | Asana, Inc. (ASAN) |
|---|---|---|
| Revenue | 1.99B | 724M |
| Cost of Revenue | 354M | 77M |
| Operating Expenses | 712M | 913M |
| Gross Profit | 1.64B | 647M |
| EBITDA | 951M | -230M |
| EBIT | 936M | -247M |
| Interest Expense | 134M | 4M |
| Net Income | 652M | -256M |
| EPS | 26.9 | -1.11 |
| Fiscal Year | 2025 | 2025 |
Income Statement Analysis: The Bottom-Line Duel
This income statement comparison reveals which company drives stronger profitability and operational efficiency in their financial engines.
Fair Isaac Corporation Analysis
Fair Isaac’s revenue surged from $1.32B in 2021 to $1.99B in 2025, reflecting a 51% growth. Net income climbed from $392M to $652M, boosting net margin to a robust 32.75%. Its gross margin of 82.23% and EBIT margin of 47.03% signal high operational efficiency. In 2025, Fair Isaac maintained momentum with a 16% revenue increase and nearly 10% net margin growth.
Asana, Inc. Analysis
Asana expanded revenue dramatically by 219% from $227M in 2021 to $724M in 2025. However, it remains unprofitable with a net loss of $256M in 2025, though net margin improved from -35.3%. Its high gross margin of 89.34% contrasts with a negative EBIT margin of -34.13%, reflecting ongoing heavy operating expenses. Revenue growth persists, but earnings efficiency remains a challenge.
Margin Strength vs. Growth Ambition
Fair Isaac leads decisively on profitability and margin health, delivering consistent net income growth and efficient cost control. Asana impresses with rapid top-line expansion but struggles to convert revenue into profits. Investors seeking steady profits will find Fair Isaac’s disciplined earnings profile more attractive, while Asana’s growth story carries higher operational risk.
Financial Ratios Comparison
These vital ratios act as a diagnostic tool to expose the underlying fiscal health, valuation premiums, and capital efficiency of the companies compared below:
| Ratios | Fair Isaac Corporation (FICO) | Asana, Inc. (ASAN) |
|---|---|---|
| ROE | -37.3% | -112.3% |
| ROIC | 52.96% | -53.03% |
| P/E | 55.6 | -19.2 |
| P/B | -20.8 | 21.5 |
| Current Ratio | 0.83 | 1.44 |
| Quick Ratio | 0.83 | 1.44 |
| D/E | -1.76 | 1.18 |
| Debt-to-Assets | 164.6% | 30.1% |
| Interest Coverage | 6.92 | -72.42 |
| Asset Turnover | 1.07 | 0.81 |
| Fixed Asset Turnover | 21.2 | 2.76 |
| Payout ratio | 0% | 0% |
| Dividend yield | 0% | 0% |
| Fiscal Year | 2025 | 2025 |
Efficiency & Valuation Duel: The Vital Signs
Financial ratios serve as a company’s DNA, unveiling hidden risks and highlighting operational strengths that shape investor decisions.
Fair Isaac Corporation
Fair Isaac posts a robust net margin of 32.75%, reflecting strong profitability despite a negative ROE of -37.34%. The stock trades at a high P/E of 55.64, signaling an expensive valuation. With no dividend yield, the company leans on significant R&D investments to fuel future growth, balancing efficiency with strategic reinvestment.
Asana, Inc.
Asana struggles with a negative net margin of -35.3% and a deeply unfavorable ROE at -112.31%, indicating ongoing profitability challenges. Its valuation metrics show a negative P/E, suggesting distress or losses. The firm pays no dividend and channels capital into heavy research and development, aiming to build long-term value despite current inefficiencies.
Premium Valuation vs. Operational Safety
Fair Isaac offers higher profitability with a stretched valuation, while Asana displays operational weakness and a cheaper but riskier profile. Investors seeking growth with operational discipline may favor Fair Isaac, whereas risk-tolerant investors aiming for turnaround potential might consider Asana.
Which one offers the Superior Shareholder Reward?
Fair Isaac Corporation (FICO) and Asana, Inc. (ASAN) both forgo dividends, focusing on reinvestment and buybacks. FICO generates strong free cash flow (31.8/share in 2025) and maintains a robust buyback program, while ASAN burns cash with negative margins and weak free cash flow (0.04/share in 2025). FICO’s capital allocation prioritizes shareholder returns through buybacks, supported by a solid operating cash flow ratio (0.92) and nearly 100% FCF coverage. ASAN’s reinvestment in growth is riskier, given persistent losses and high financial leverage. I conclude FICO offers a more sustainable and attractive total return profile for 2026 investors.
Comparative Score Analysis: The Strategic Profile
The radar chart reveals the fundamental DNA and strategic trade-offs of Fair Isaac Corporation and Asana, Inc.:
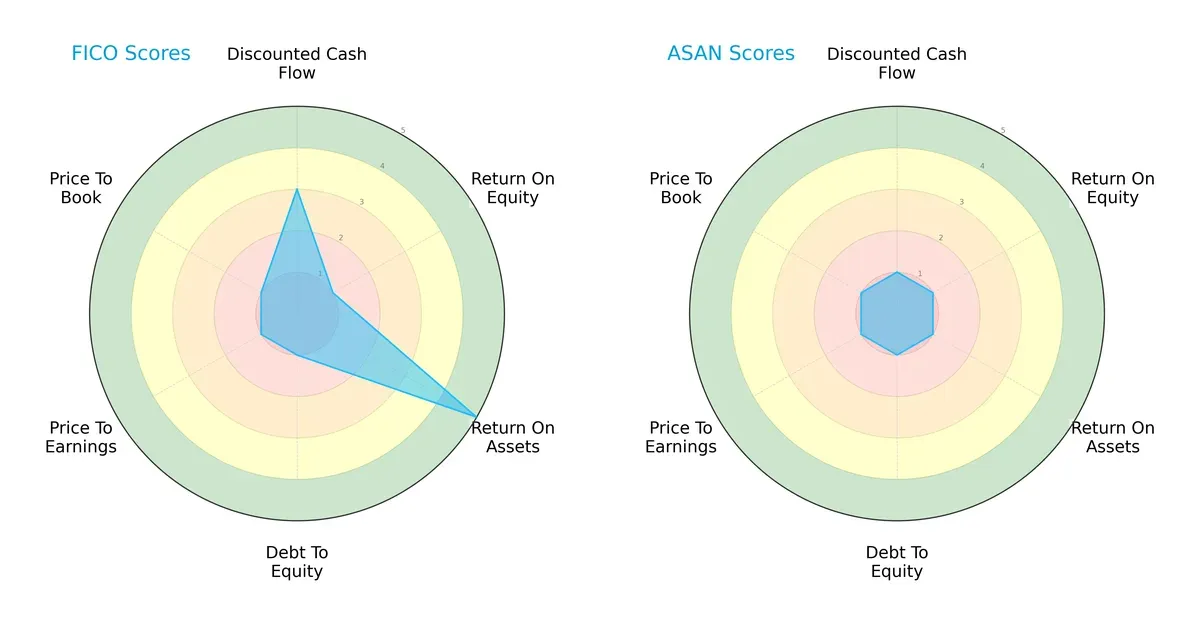
Fair Isaac exhibits a more balanced profile with moderate DCF and very favorable ROA, despite weak ROE and high debt risk. Asana suffers across all metrics, showing no distinct strengths. Fair Isaac’s edge lies in asset efficiency, while Asana relies on neither valuation nor profitability advantages.
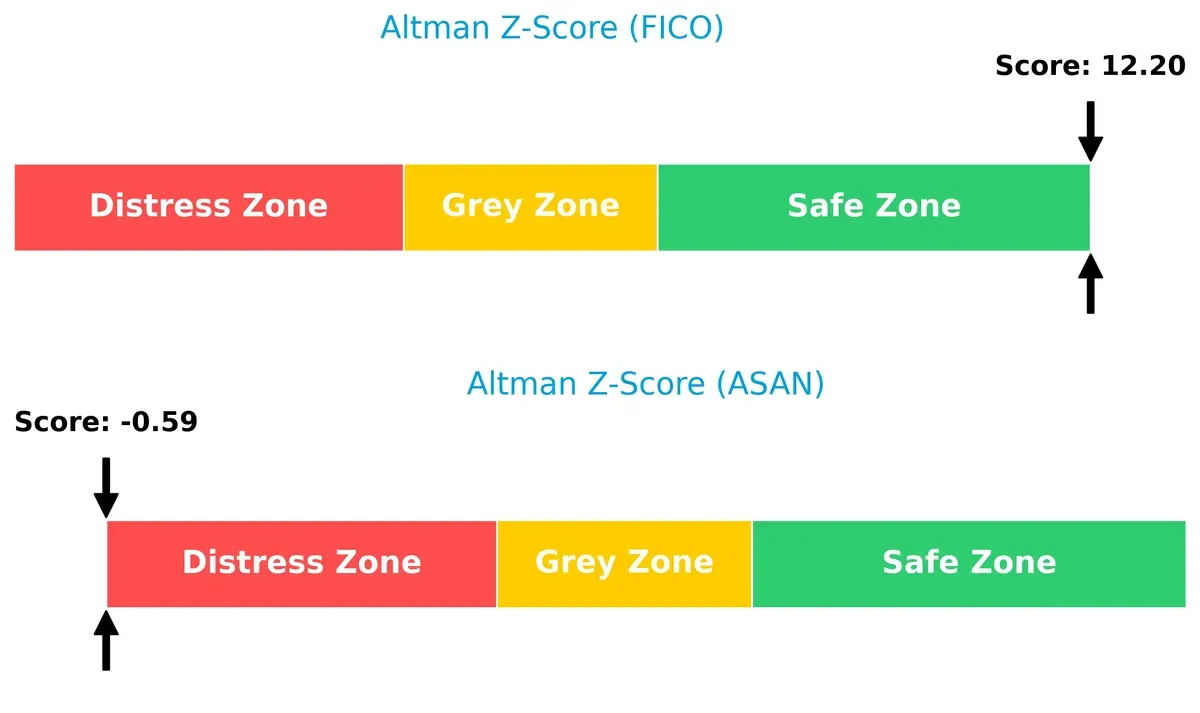
Bankruptcy Risk: Solvency Showdown
Fair Isaac’s Altman Z-Score of 12.2 signals a very safe zone, while Asana’s -0.6 places it in distress, implying severe bankruptcy risk in this cycle:
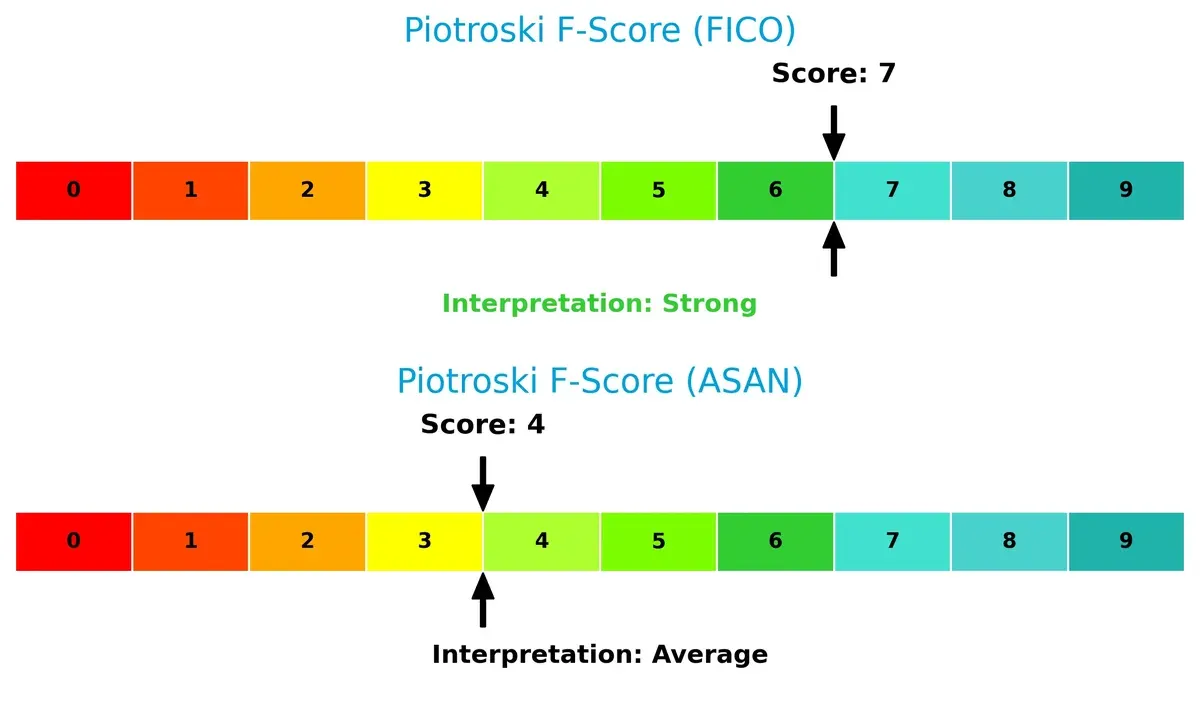
Financial Health: Quality of Operations
Fair Isaac scores 7 on the Piotroski scale, indicating strong financial health. Asana’s 4 suggests average strength with notable operational red flags:
How are the two companies positioned?
This section dissects the operational DNA of FICO and ASAN by comparing their revenue distribution by segment and internal dynamics. The goal is to confront their economic moats and identify which model offers the most resilient competitive advantage today.
Revenue Segmentation: The Strategic Mix
This comparison dissects how Fair Isaac Corporation and Asana, Inc. diversify their income streams and where their primary sector bets lie:
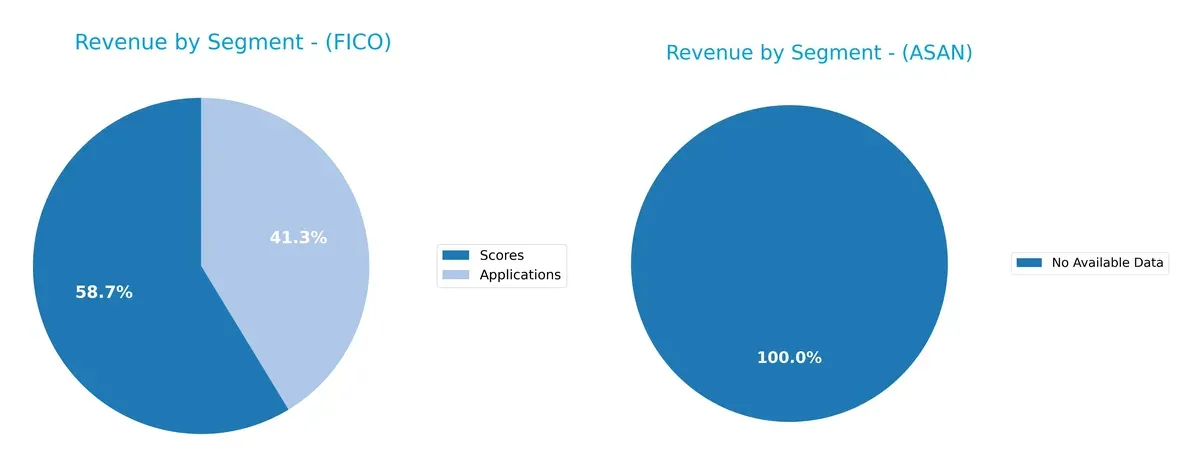
Fair Isaac Corporation anchors revenue between Scores at $1.17B and Applications at $822M in 2025, showing solid dual-segment strength. Asana lacks available data, preventing segmentation insight. FICO’s mix balances scoring dominance with software applications, reducing concentration risk and fostering ecosystem lock-in through complementary offerings. This strategy contrasts with firms relying on a single product line, enhancing FICO’s resilience amid sector shifts.
Strengths and Weaknesses Comparison
This table compares the key strengths and weaknesses of Fair Isaac Corporation and Asana, Inc.:
FICO Strengths
- Strong profitability with 32.75% net margin
- High return on invested capital at 52.96%
- Favorable asset and fixed asset turnover ratios
- Solid interest coverage of 7.01
- Diverse revenue streams from scores and applications
- Wide global presence, notably in Americas and EMEA
ASAN Strengths
- Favorable weighted average cost of capital at 7.67%
- Positive price-to-earnings ratio indicating growth potential
- Healthy liquidity with a 1.44 quick ratio
- Neutral debt-to-assets ratio of 30.11%
- Growing international revenue, with sizeable US and Non-US sales
FICO Weaknesses
- Negative return on equity at -37.34%
- Unfavorable debt-to-assets at 164.6%, indicating high leverage
- Current ratio below 1 at 0.83, raising liquidity concerns
- Unfavorable price-to-earnings ratio at 55.64
- No dividend yield, limiting income appeal
- Negative price-to-book ratio at -20.78
ASAN Weaknesses
- Negative net margin of -35.3% and ROIC of -53.03%
- Poor return on equity at -112.31%
- Negative interest coverage of -67.09, signaling risk
- Unfavorable debt-to-equity at 1.18, increasing financial risk
- No dividend yield
- Lower asset turnover ratios indicating less efficiency
Both companies exhibit distinct financial profiles. FICO benefits from strong profitability and operational efficiency but faces concerns about leverage and equity returns. ASAN shows promising capital cost and liquidity metrics but struggles with losses and financial risk. These contrasts highlight differing strategic challenges and operational executions.
The Moat Duel: Analyzing Competitive Defensibility
A structural moat is the only shield protecting a company’s long-term profits from relentless competition erosion. Let’s dissect the moats of two software players:
Fair Isaac Corporation: Durable Data & Analytics Moat
FICO’s competitive edge lies in its intangible assets—proprietary credit scoring and decision analytics. This moat fuels high ROIC (43.6% above WACC) and margin stability. Expansion into decision management software deepens its defensibility in 2026.
Asana, Inc.: Emerging Platform with Network Hurdles
Asana depends on network effects within work management software, but its negative ROIC trend signals a fragile moat. While revenue grows rapidly, profitability struggles. Future success hinges on scaling user engagement and monetization.
ROIC Supremacy vs. Network Ambitions: Who Holds the Moat Crown?
FICO’s wide, durable moat outmatches Asana’s nascent and declining competitive advantage. FICO’s strong economic returns and margin discipline better defend its market share in a competitive software landscape.
Which stock offers better returns?
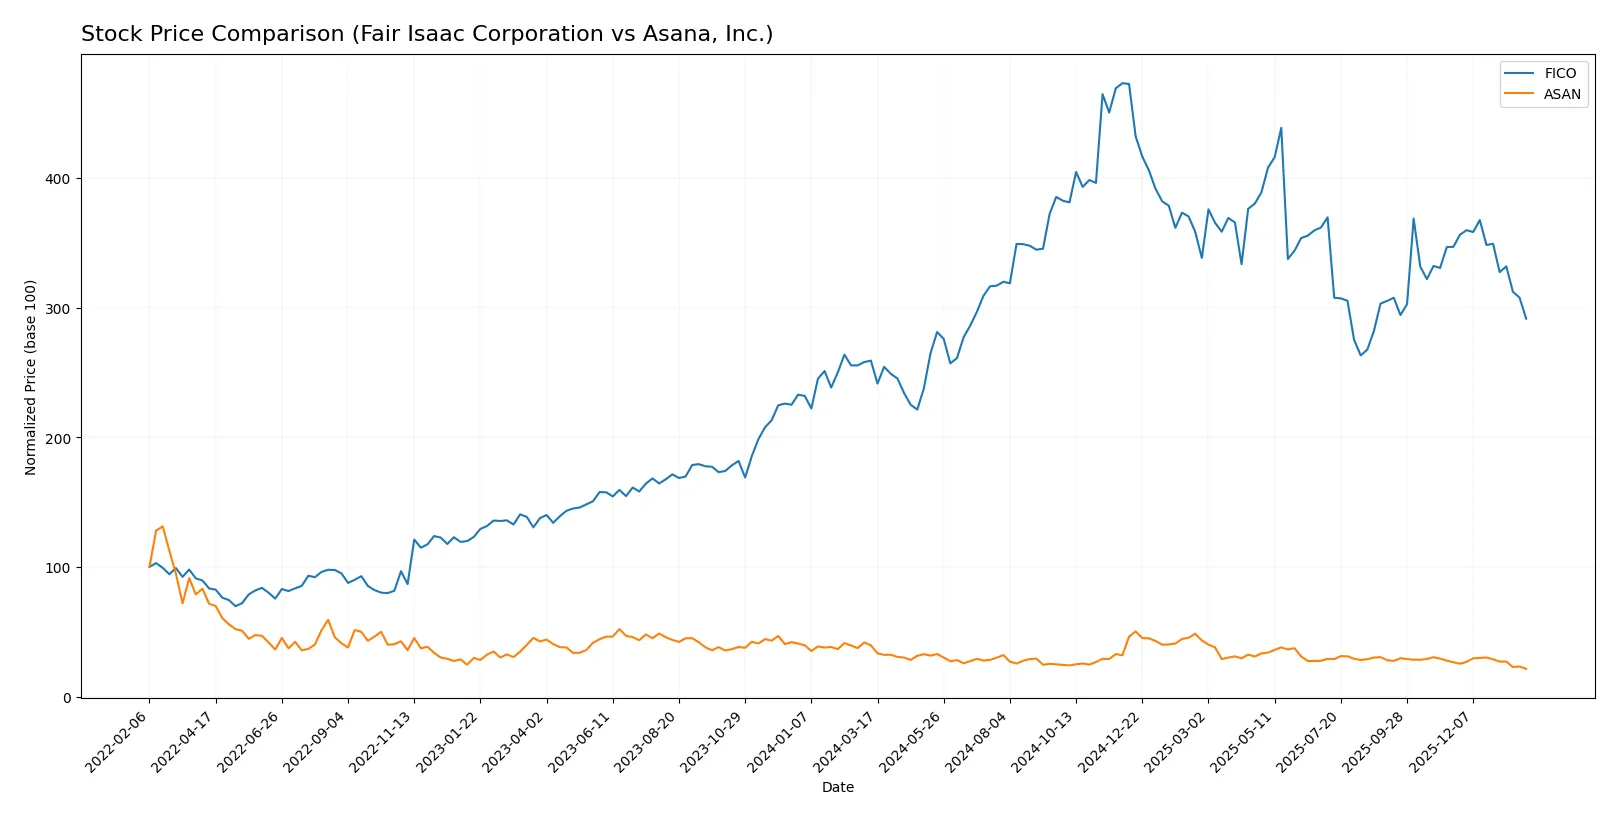
The past 12 months reveal contrasting trajectories: Fair Isaac Corporation gained 12.5% with decelerating momentum, while Asana, Inc. lost 46%, reflecting sustained bearish pressure.
Trend Comparison
Fair Isaac Corporation’s stock price rose 12.5% over the past year, signaling a bullish trend despite decelerating gains. It peaked at 2375 and bottomed at 1111.
Asana, Inc. dropped 46% over the same period, confirming a bearish trend with deceleration. Its price ranged between 24.15 and 10.25, showing significant weakness.
Fair Isaac outperformed Asana, delivering the highest market returns. Both stocks show recent declines, but Fair Isaac remains in positive territory overall.
Target Prices
Analysts project a bullish outlook on Fair Isaac Corporation and a cautiously optimistic view on Asana, Inc.
| Company | Target Low | Target High | Consensus |
|---|---|---|---|
| Fair Isaac Corporation | 1,640 | 2,400 | 2,115 |
| Asana, Inc. | 14 | 18 | 15.75 |
Fair Isaac’s consensus target is 44% above its current 1,463 price, signaling strong growth expectations. Asana’s target consensus stands over 50% higher than its 10.25 market price, reflecting moderate confidence tempered by volatility.

Don’t Let Luck Decide Your Entry Point
Optimize your entry points with our advanced ProRealTime indicators. You’ll get efficient buy signals with precise price targets for maximum performance. Start outperforming now!
How do institutions grade them?
Fair Isaac Corporation Grades
The following table summarizes recent grades issued by leading financial institutions for Fair Isaac Corporation:
| Grading Company | Action | New Grade | Date |
|---|---|---|---|
| Needham | Maintain | Buy | 2026-01-29 |
| Jefferies | Maintain | Buy | 2026-01-16 |
| Wells Fargo | Maintain | Overweight | 2026-01-14 |
| Baird | Maintain | Outperform | 2025-11-06 |
| Jefferies | Maintain | Buy | 2025-11-06 |
| JP Morgan | Maintain | Neutral | 2025-11-06 |
| BMO Capital | Maintain | Outperform | 2025-11-06 |
| Wells Fargo | Maintain | Overweight | 2025-10-14 |
| Barclays | Maintain | Overweight | 2025-10-02 |
| Needham | Maintain | Buy | 2025-10-02 |
Asana, Inc. Grades
Below is a summary of recent grades assigned by reputable grading companies to Asana, Inc.:
| Grading Company | Action | New Grade | Date |
|---|---|---|---|
| Citigroup | Upgrade | Buy | 2026-01-15 |
| RBC Capital | Maintain | Underperform | 2026-01-05 |
| Keybanc | Upgrade | Overweight | 2025-12-15 |
| DA Davidson | Maintain | Neutral | 2025-12-04 |
| Citigroup | Maintain | Neutral | 2025-12-03 |
| UBS | Maintain | Neutral | 2025-12-03 |
| RBC Capital | Maintain | Underperform | 2025-12-03 |
| Baird | Maintain | Neutral | 2025-09-04 |
| Morgan Stanley | Maintain | Underweight | 2025-09-04 |
| Piper Sandler | Maintain | Overweight | 2025-09-04 |
Which company has the best grades?
Fair Isaac Corporation consistently receives positive grades such as Buy, Outperform, and Overweight from multiple institutions. Asana, Inc.’s grades are more mixed, ranging from Buy and Overweight to Underperform and Neutral. This disparity implies Fair Isaac commands stronger institutional confidence, potentially affecting investor sentiment and capital flows.
Risks specific to each company
The following categories identify critical pressure points and systemic threats facing Fair Isaac Corporation and Asana, Inc. in the 2026 market environment:
1. Market & Competition
Fair Isaac Corporation
- Established with strong analytics and scoring products; faces intense competition in decision management software.
Asana, Inc.
- Rapidly growing work management platform; competes with larger, diversified software firms in a crowded market.
2. Capital Structure & Debt
Fair Isaac Corporation
- High debt-to-assets ratio (165%) signals leverage risk despite favorable interest coverage.
Asana, Inc.
- Moderate debt-to-assets (30%); weak interest coverage indicates difficulty managing debt costs.
3. Stock Volatility
Fair Isaac Corporation
- Beta at 1.29 shows above-market volatility; price range wide between $1300 and $2217.
Asana, Inc.
- Beta below 1 (0.92) implies lower volatility; price range narrower but closer to 52-week low.
4. Regulatory & Legal
Fair Isaac Corporation
- Operates globally with exposure to data privacy and compliance regulations across multiple jurisdictions.
Asana, Inc.
- Faces regulatory scrutiny in data security and SaaS compliance; younger firm with evolving legal frameworks.
5. Supply Chain & Operations
Fair Isaac Corporation
- Robust direct and indirect sales channels; operational risks tied to software platform updates and client retention.
Asana, Inc.
- Relies heavily on cloud infrastructure; operational risk from service outages and customer churn.
6. ESG & Climate Transition
Fair Isaac Corporation
- Limited disclosure; potential risks from evolving ESG standards affecting software industry investors.
Asana, Inc.
- Increasing investor pressure to enhance ESG transparency; opportunity to lead in sustainable SaaS solutions.
7. Geopolitical Exposure
Fair Isaac Corporation
- Global footprint exposes it to geopolitical tensions impacting data flow and market access.
Asana, Inc.
- Primarily US-based but expanding internationally, facing emerging geopolitical risks in Europe and Asia.
Which company shows a better risk-adjusted profile?
Fair Isaac Corporation’s most impactful risk is its stretched capital structure with excessive debt-to-assets ratio, risking financial flexibility. Asana’s critical risk lies in its weak profitability and poor debt management, reflected in distress-level Altman Z-Score. Despite higher volatility, Fair Isaac’s strong operational metrics and safer Altman Z-Score suggest a superior risk-adjusted profile. The recent surge in Fair Isaac’s interest coverage ratio to 7.0 underscores improving debt service capacity, justifying cautious optimism.
Final Verdict: Which stock to choose?
Fair Isaac Corporation’s superpower lies in its robust capital efficiency and durable competitive moat, demonstrated by a ROIC far exceeding its cost of capital. Its point of vigilance is a low current ratio, which suggests liquidity risks in tighter markets. It suits portfolios targeting steady value creation with moderate risk tolerance.
Asana, Inc. benefits from a strategic moat based on innovative cloud collaboration tools fostering recurring revenue growth. Despite this, its financials reveal value destruction and weaker profitability, signaling higher risk compared to Fair Isaac. It fits investors seeking high-growth potential with an appetite for volatility and uncertainty.
If you prioritize durable economic moats and consistent value creation, Fair Isaac outshines Asana with superior capital allocation and financial stability. However, if you seek exposure to disruptive growth in cloud collaboration, Asana offers a compelling yet riskier growth story. Each choice aligns with distinct investor profiles balancing risk and reward.
Disclaimer: Investment carries a risk of loss of initial capital. The past performance is not a reliable indicator of future results. Be sure to understand risks before making an investment decision.
Go Further
I encourage you to read the complete analyses of Fair Isaac Corporation and Asana, Inc. to enhance your investment decisions: