In the rapidly evolving software application industry, Asana, Inc. and Domo, Inc. stand out as innovative players offering distinct platforms to enhance organizational productivity and data-driven decision-making. Both companies target overlapping markets with solutions that streamline workflows and business intelligence, appealing to similar enterprise clients. This article will analyze their growth strategies, financial health, and market positioning to help you decide which company presents a more compelling investment opportunity in 2026.
Table of contents
Companies Overview
I will begin the comparison between Asana and Domo by providing an overview of these two companies and their main differences.
Asana Overview
Asana, Inc. operates a work management platform designed for individuals, team leads, and executives, enabling orchestration of tasks from daily activities to strategic initiatives. Serving diverse industries including technology, retail, and healthcare, Asana focuses on managing product launches, marketing campaigns, and company-wide goals. Headquartered in San Francisco, Asana has a market cap of 2.6B USD and employs 1,819 full-time staff.
Domo Overview
Domo, Inc. offers a cloud-based business intelligence platform that connects executives to frontline employees, providing access to real-time data and insights for business management via smartphones. Operating in the US, Japan, and internationally, Domo serves a broad customer base with 888 employees. The company is headquartered in American Fork, Utah, and has a market cap of 257M USD as of 2026.
Key similarities and differences
Both Asana and Domo operate in the software application industry, focusing on platforms that improve organizational efficiency through data and task management. While Asana emphasizes work orchestration across various sectors, Domo prioritizes real-time business intelligence and mobile accessibility. Asana is significantly larger by market capitalization and workforce, whereas Domo carries a higher beta, indicating comparatively greater stock volatility.
Income Statement Comparison
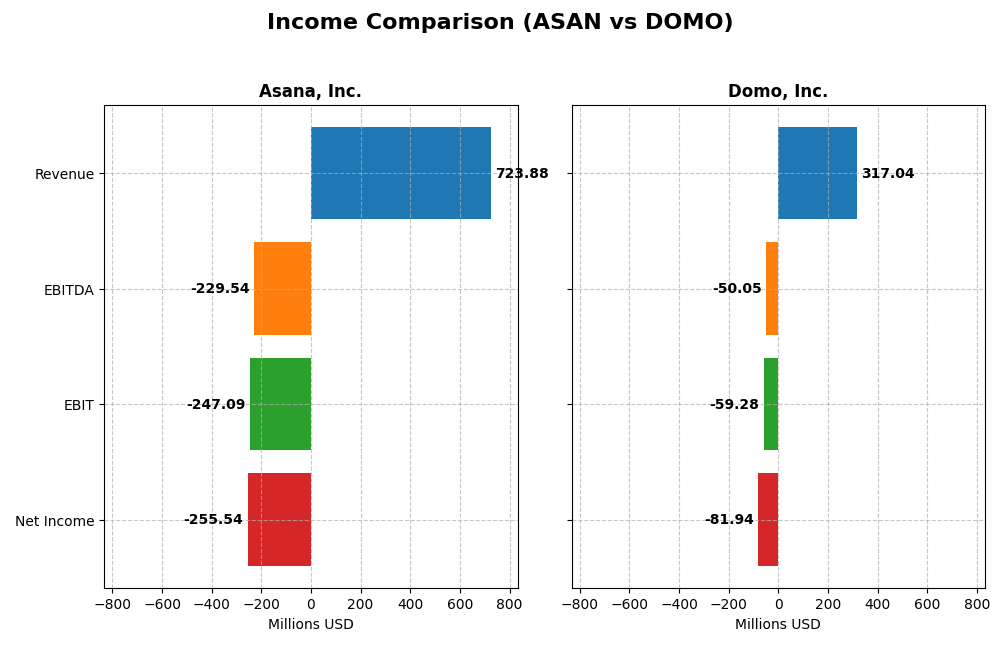
The table below presents a side-by-side comparison of key income statement metrics for Asana, Inc. and Domo, Inc. for the fiscal year 2025.
| Metric | Asana, Inc. (ASAN) | Domo, Inc. (DOMO) |
|---|---|---|
| Market Cap | 2.59B | 257M |
| Revenue | 724M | 317M |
| EBITDA | -230M | -50M |
| EBIT | -247M | -59M |
| Net Income | -256M | -82M |
| EPS | -1.11 | -2.13 |
| Fiscal Year | 2025 | 2025 |
Income Statement Interpretations
Asana, Inc.
Asana’s revenue grew strongly by 219% from 2021 to 2025, reaching $724M in 2025, with a favorable gross margin of 89.3%. Despite this, net income remained negative, though net margin improved by 62% overall. The latest year showed a 10.9% revenue increase and modest EBIT growth, reflecting some operational stabilization amid continued losses.
Domo, Inc.
Domo’s revenue increased by 51% over the 2021-2025 period but declined slightly by 0.6% in 2025 to $317M. Gross margin stayed favorable at 74.5%, but EBIT and net margins remained negative and worsened in the most recent year. EPS and net margin deteriorated, highlighting ongoing profitability challenges.
Which one has the stronger fundamentals?
Asana exhibits stronger fundamentals, supported by higher revenue growth, superior gross margin, and improving net margin trends, despite persistent losses. Domo’s slower revenue growth, recent declines, and worsening profitability metrics suggest weaker income statement performance. Overall, Asana’s financials present a more favorable income statement trajectory.
Financial Ratios Comparison
Below is a comparison of key financial ratios for Asana, Inc. and Domo, Inc. based on their most recent fiscal year data for 2025.
| Ratios | Asana, Inc. (ASAN) | Domo, Inc. (DOMO) |
|---|---|---|
| ROE | -112.3% | 46.2% |
| ROIC | -53.0% | 194.7% |
| P/E | -19.2 | -4.0 |
| P/B | 21.5 | -1.8 |
| Current Ratio | 1.44 | 0.56 |
| Quick Ratio | 1.44 | 0.56 |
| D/E | 1.18 | -0.76 |
| Debt-to-Assets | 30.1% | 63.2% |
| Interest Coverage | -72.4 | -3.0 |
| Asset Turnover | 0.81 | 1.48 |
| Fixed Asset Turnover | 2.76 | 8.17 |
| Payout Ratio | 0% | 0% |
| Dividend Yield | 0% | 0% |
Interpretation of the Ratios
Asana, Inc.
Asana’s financial ratios reveal several weaknesses, including a significantly negative net margin of -35.3% and a highly unfavorable return on equity at -112.31%. The company’s price-to-book ratio is notably high at 21.52, pointing to possible overvaluation. Liquidity ratios are mixed with a current ratio of 1.44 (neutral) and a quick ratio favorable at 1.44. Asana does not pay dividends, reflecting its reinvestment strategy in growth and R&D, with no share buybacks reported.
Domo, Inc.
Domo presents a mixed ratio profile with favorable return on equity (46.23%) and return on invested capital (194.73%), but a negative net margin of -25.84%. Its liquidity ratios (current and quick at 0.56) are unfavorable, indicating potential short-term liquidity challenges. Domo also does not distribute dividends, consistent with its focus on reinvestment and growth, without share buyback programs noted.
Which one has the best ratios?
Domo shows a more balanced ratio profile with half of its ratios favorable, including strong returns and valuation metrics, despite liquidity concerns. Asana exhibits more unfavorable ratios, particularly in profitability and valuation, with a slight unfavorable overall rating. Thus, Domo holds a neutral stance, while Asana’s ratios appear slightly unfavorable based on the latest fiscal year data.
Strategic Positioning
This section compares the strategic positioning of Asana and Domo, including Market position, Key segments, and Exposure to technological disruption:
Asana, Inc.
- Market position and competitive pressure: Operates a work management platform serving diverse industries globally, with a market cap of 2.6B USD.
- Key segments and business drivers: Focuses on work orchestration across multiple sectors without disclosed revenue segmentation.
- Exposure to technological disruption: Competes in software application sector with a broad platform for task and strategic initiative management.
Domo, Inc.
- Market position and competitive pressure: Provides a cloud-based business intelligence platform, smaller market cap at 257M USD.
- Key segments and business drivers: Revenue primarily from subscription services with additional professional services.
- Exposure to technological disruption: Cloud-based real-time data and insights platform connecting all organizational levels.
Asana vs Domo Positioning
Asana pursues a diversified approach serving multiple industries through a comprehensive work management platform, while Domo focuses on a concentrated niche of cloud-based business intelligence with subscription-driven revenue. Asana’s broad market reach contrasts with Domo’s specialized data connectivity.
Which has the best competitive advantage?
Domo shows a very favorable MOAT with growing ROIC and value creation, indicating durable competitive advantage. Asana displays a very unfavorable MOAT with declining ROIC, suggesting it is currently destroying value and less competitive.
Stock Comparison
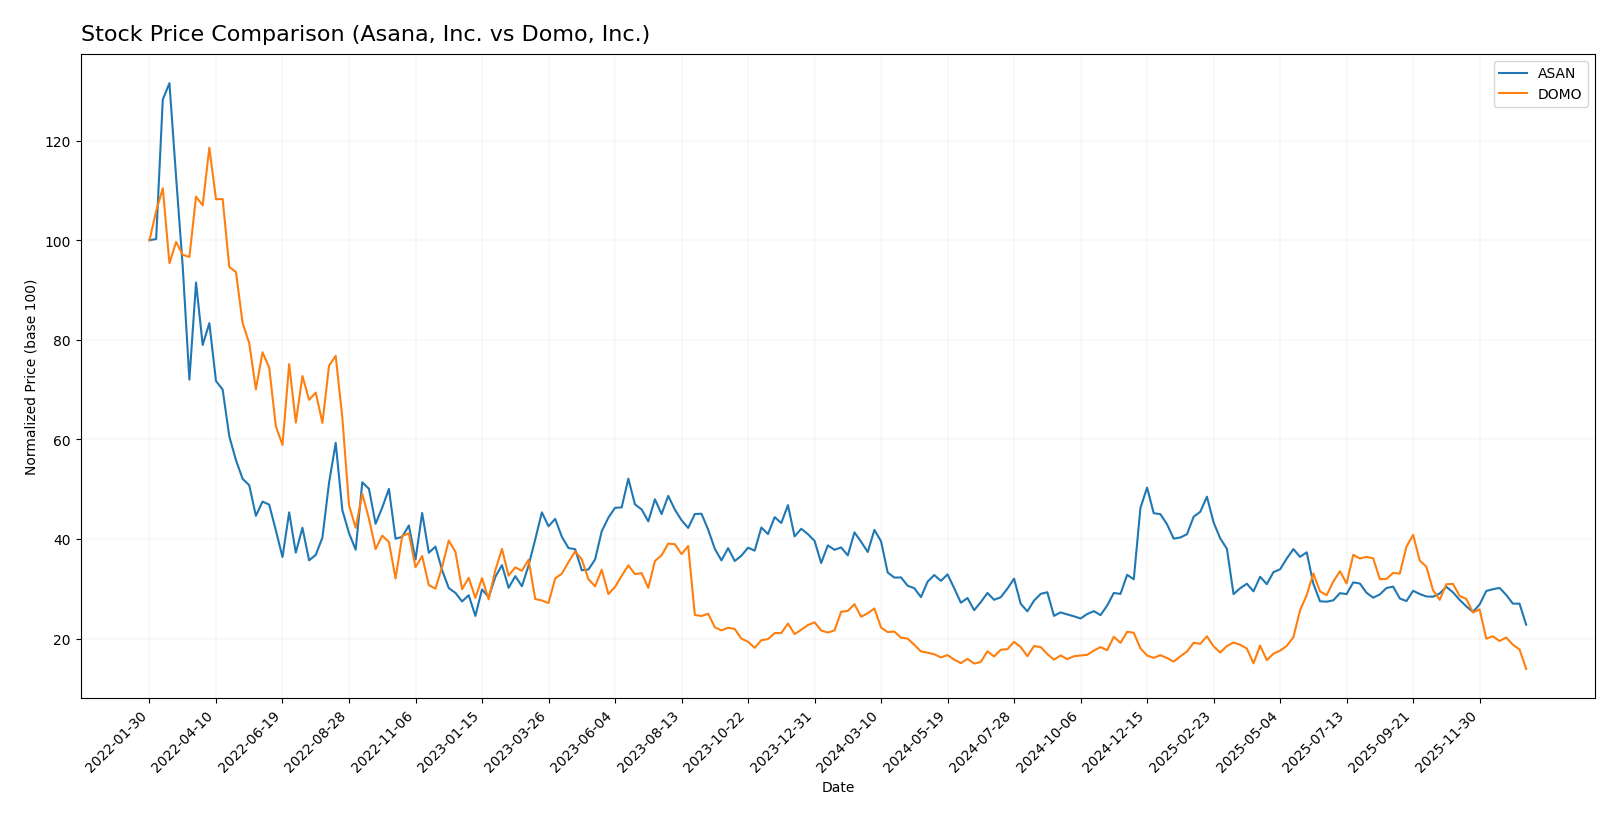
The stock price movements of Asana, Inc. and Domo, Inc. over the past 12 months reveal significant declines with decelerating bearish trends, marked by notable drawdowns from their respective highs to lows.
Trend Analysis
Asana, Inc. experienced a 39.07% price decrease over the past year, indicating a bearish trend with deceleration. The stock ranged from a high of 24.15 to a low of 10.93, showing moderate volatility (std dev 2.87).
Domo, Inc. showed a larger 44.54% price decline over the same period, also bearish and decelerating, with prices fluctuating between 18.06 and 6.15 and slightly higher volatility (std dev 3.01).
Comparing both, Asana delivered the higher market performance despite its decline, as Domo’s losses were more pronounced throughout the analyzed timeframe.
Target Prices
Analysts provide clear target price ranges for Asana, Inc. and Domo, Inc., reflecting moderate upside potential from current levels.
| Company | Target High | Target Low | Consensus |
|---|---|---|---|
| Asana, Inc. | 18 | 14 | 15.75 |
| Domo, Inc. | 13 | 10 | 11.5 |
The consensus target prices suggest Asana’s shares could appreciate roughly 44% from the current $10.93, while Domo’s shares have a potential upside of about 87% from $6.15, indicating optimistic analyst expectations versus current market prices.
Analyst Opinions Comparison
This section compares analysts’ ratings and grades for Asana, Inc. and Domo, Inc.:
Rating Comparison
Asana Rating
- Rating: D+ indicating a very favorable rating status
- Discounted Cash Flow Score: 1, marked as very unfavorable
- ROE Score: 1, considered very unfavorable
- ROA Score: 1, rated very unfavorable
- Debt To Equity Score: 1, considered very unfavorable
- Overall Score: 1, classified as very unfavorable
Domo Rating
- Rating: C indicating a very favorable rating status
- Discounted Cash Flow Score: 1, marked as very unfavorable
- ROE Score: 5, considered very favorable
- ROA Score: 1, rated very unfavorable
- Debt To Equity Score: 1, considered very unfavorable
- Overall Score: 2, classified as moderate
Which one is the best rated?
Based strictly on the provided data, Domo holds a higher rating (C) and a better overall score (2 moderate) compared to Asana’s rating (D+) and overall score (1 very unfavorable). Domo’s ROE is significantly stronger, while other scores are similar and low.
Scores Comparison
Here is a comparison of the financial health scores for Asana, Inc. and Domo, Inc.:
Asana Scores
- Altman Z-Score: -0.27, indicating distress zone, high bankruptcy risk.
- Piotroski Score: 4, assessed as average financial strength.
Domo Scores
- Altman Z-Score: -10.10, deep distress zone, very high bankruptcy risk.
- Piotroski Score: 3, assessed as very weak financial strength.
Which company has the best scores?
Based solely on the provided data, Asana has relatively better scores with a higher Piotroski Score and a less negative Altman Z-Score compared to Domo, indicating comparatively stronger financial health.
Grades Comparison
Here is the comparison of recent grades and ratings provided by reputable grading companies for Asana, Inc. and Domo, Inc.:
Asana, Inc. Grades
The following table summarizes recent grades assigned by leading financial institutions for Asana, Inc.:
| Grading Company | Action | New Grade | Date |
|---|---|---|---|
| Citigroup | Upgrade | Buy | 2026-01-15 |
| RBC Capital | Maintain | Underperform | 2026-01-05 |
| Keybanc | Upgrade | Overweight | 2025-12-15 |
| DA Davidson | Maintain | Neutral | 2025-12-04 |
| Citigroup | Maintain | Neutral | 2025-12-03 |
| RBC Capital | Maintain | Underperform | 2025-12-03 |
| UBS | Maintain | Neutral | 2025-12-03 |
| Morgan Stanley | Maintain | Underweight | 2025-09-04 |
| Piper Sandler | Maintain | Overweight | 2025-09-04 |
| Baird | Maintain | Neutral | 2025-09-04 |
The overall grade trend for Asana, Inc. shows a mixed outlook with upgrades from some firms balanced by maintained neutral and underperform ratings.
Domo, Inc. Grades
Below is a summary of recent grades assigned by recognized financial analysts for Domo, Inc.:
| Grading Company | Action | New Grade | Date |
|---|---|---|---|
| DA Davidson | Maintain | Neutral | 2025-12-05 |
| TD Cowen | Maintain | Buy | 2025-12-05 |
| Lake Street | Maintain | Hold | 2025-12-05 |
| DA Davidson | Maintain | Neutral | 2025-12-01 |
| JMP Securities | Maintain | Market Outperform | 2025-09-10 |
| DA Davidson | Maintain | Neutral | 2025-08-28 |
| Cantor Fitzgerald | Maintain | Overweight | 2025-08-28 |
| TD Cowen | Upgrade | Buy | 2025-08-26 |
| JMP Securities | Maintain | Market Outperform | 2025-06-25 |
| Cantor Fitzgerald | Maintain | Overweight | 2025-06-25 |
Domo, Inc. exhibits a consistently positive grade pattern with multiple “Buy,” “Overweight,” and “Market Outperform” ratings maintained or upgraded.
Which company has the best grades?
Domo, Inc. holds generally stronger and more consistent buy-side grades compared to Asana, Inc., which displays a more mixed rating profile. This could indicate that investors perceive Domo as having a more favorable growth or value potential in the near term.
Strengths and Weaknesses
The table below compares key strengths and weaknesses of Asana, Inc. and Domo, Inc. based on the most recent financial and strategic data available.
| Criterion | Asana, Inc. | Domo, Inc. |
|---|---|---|
| Diversification | Limited product range, mainly work management tools | Primarily subscription-based with professional services, moderate diversification |
| Profitability | Negative net margin (-35.3%) and ROIC (-53.03%), value destroying | Improving profitability with positive ROIC (194.73%) and ROE (46.23%), value creating |
| Innovation | Struggles reflected in declining ROIC and value destruction | Strong innovation indicated by growing ROIC and durable competitive advantage |
| Global presence | Moderate, but less dominant internationally | Expanding global presence with subscription growth from $117M in 2019 to $286M in 2025 |
| Market Share | Challenged by profitability issues and competition | Growing market share supported by increasing revenues and operational efficiency |
In summary, Domo demonstrates a durable competitive advantage with improving profitability and revenue growth, while Asana faces significant profitability challenges and declining returns on invested capital. Investors should weigh the risks of Asana’s value destruction against Domo’s more favorable financial and strategic position.
Risk Analysis
Below is a comparative table highlighting key risk metrics for Asana, Inc. and Domo, Inc. based on the most recent fiscal year 2025 data:
| Metric | Asana, Inc. (ASAN) | Domo, Inc. (DOMO) |
|---|---|---|
| Market Risk | Beta 0.92 (moderate) | Beta 1.65 (high) |
| Debt level | Debt-to-Equity 1.18 (unfavorable) | Debt-to-Equity -0.76 (favorable, unusual negative value) |
| Regulatory Risk | Moderate (US tech sector) | Moderate (US & international exposure) |
| Operational Risk | Negative net margin -35.3% | Negative net margin -25.8% |
| Environmental Risk | Low (software sector) | Low (software sector) |
| Geopolitical Risk | Moderate (global customers) | Moderate (global customers) |
The most likely and impactful risks for these companies stem from their operational losses and financial distress signals. Both have negative net margins and are in the distress zone for bankruptcy risk, indicating high operational risk. Domo’s higher beta suggests greater sensitivity to market fluctuations, while Asana shows elevated debt levels. Caution is warranted given these financial vulnerabilities.
Which Stock to Choose?
Asana, Inc. has shown favorable income growth with a 10.94% revenue increase in 2025 and a strong gross margin of 89.34%. However, its profitability ratios remain unfavorable, including a -35.3% net margin and -112.31% ROE. The company carries moderate debt with a debt-to-equity ratio of 1.18 and a current ratio of 1.44. Its overall financial ratios are slightly unfavorable, and the firm is rated very favorably with a “D+” score despite weak underlying scores.
Domo, Inc. reports a less favorable income evolution with a -0.61% revenue decline in 2025 and a lower gross margin of 74.45%. Profitability is mixed, showing a -25.84% net margin but a favorable 46.23% ROE and very strong ROIC of 194.73%. The company faces higher leverage with a debt-to-assets ratio of 63.23% and weak liquidity (current ratio 0.56). Its financial ratios are neutral overall, supported by a “C” rating that is very favorable but with some mixed score components.
Considering ratings and the comprehensive evaluation of income statements and financial ratios, Domo may appear more favorable for risk-tolerant investors seeking growth and strong returns on invested capital. Conversely, Asana might be more aligned with investors prioritizing companies with improving income growth and stable liquidity metrics despite weaker profitability. Each stock’s appeal depends on the investor’s risk profile and investment strategy.
Disclaimer: Investment carries a risk of loss of initial capital. The past performance is not a reliable indicator of future results. Be sure to understand risks before making an investment decision.
Go Further
I encourage you to read the complete analyses of Asana, Inc. and Domo, Inc. to enhance your investment decisions: