In the dynamic world of software applications, DocuSign, Inc. and Asana, Inc. stand out as key players transforming how businesses operate. Both companies, headquartered in San Francisco, specialize in cloud-based solutions that streamline workflows and enhance productivity, yet they target different aspects of digital collaboration. Comparing their innovation strategies and market positions will help investors identify which stock offers the most compelling opportunity in 2026. Let’s explore which company deserves a place in your portfolio.
Table of contents
Companies Overview
I will begin the comparison between DocuSign and Asana by providing an overview of these two companies and their main differences.
DocuSign Overview
DocuSign, Inc. specializes in electronic signature software, enabling businesses worldwide to digitally prepare, sign, and manage agreements. The company offers advanced contract lifecycle management solutions and AI-powered tools that streamline workflows and enhance legal document analysis. Founded in 2003 and headquartered in San Francisco, DocuSign serves enterprises, commercial, and small businesses, maintaining a strong position in the software application industry.
Asana Overview
Asana, Inc. operates a work management platform designed to help teams coordinate daily tasks and strategic initiatives across various industries, including technology, retail, and healthcare. Established in 2008 and based in San Francisco, Asana supports project management, marketing campaigns, and organization-wide goal setting. The company focuses on improving team productivity through its collaborative software solutions, targeting individuals, team leads, and executives.
Key similarities and differences
Both DocuSign and Asana operate within the software application industry and provide cloud-based solutions that enhance business productivity. DocuSign emphasizes digital agreements and contract automation, leveraging AI for legal workflows, while Asana focuses on task and project management across multiple sectors. Despite their shared technology sector, their core offerings and target customer needs show distinct functional differences.
Income Statement Comparison
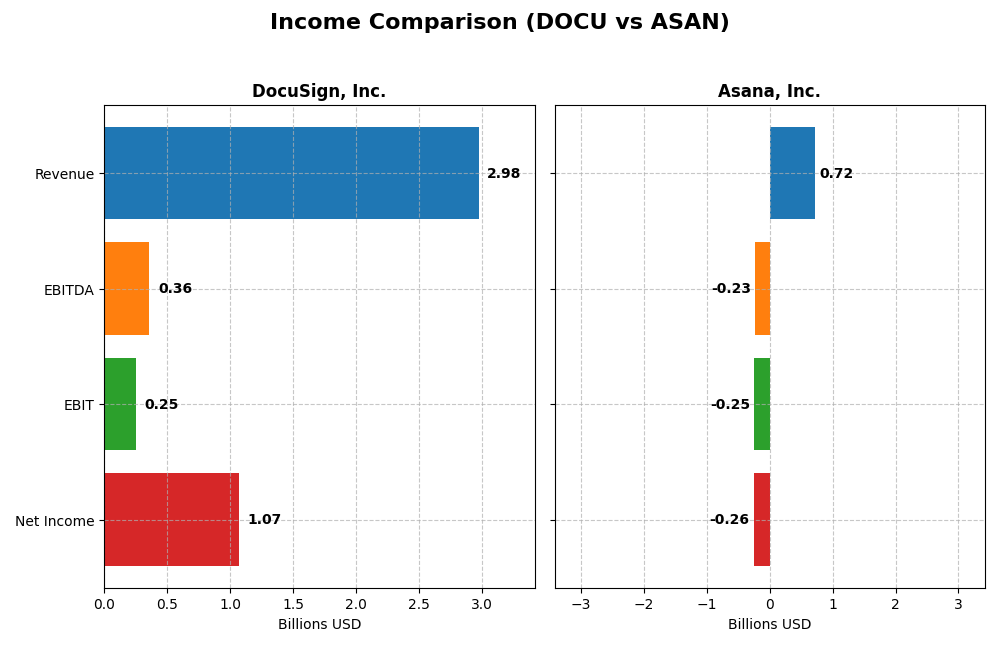
The following table compares key income statement metrics for DocuSign, Inc. and Asana, Inc. based on their most recent fiscal year data.
| Metric | DocuSign, Inc. (DOCU) | Asana, Inc. (ASAN) |
|---|---|---|
| Market Cap | 11.36B | 2.59B |
| Revenue | 2.98B | 724M |
| EBITDA | 357M | -230M |
| EBIT | 249M | -247M |
| Net Income | 1.07B | -256M |
| EPS | 5.23 | -1.11 |
| Fiscal Year | 2025 | 2025 |
Income Statement Interpretations
DocuSign, Inc.
DocuSign’s revenue rose steadily from $1.45B in 2021 to nearly $3B in 2025, accompanied by a strong net income turnaround from a loss of $243M in 2021 to a profit of $1.07B in 2025. Gross margins remained robust around 79%, while net margins improved significantly, reaching 35.9% in 2025. The latest year showed solid revenue growth of 7.8% and a substantial net margin expansion, reflecting improved profitability.
Asana, Inc.
Asana’s revenue increased markedly from $227M in 2021 to $724M in 2025, but net income remained negative, though losses narrowed from $212M in 2021 to $256M in 2025. Gross margin was high at 89.3%, but net margins stayed unfavorable at -35.3%. The most recent year saw a 10.9% revenue rise and modest improvements in net margin and EPS, signaling ongoing operational challenges despite growth.
Which one has the stronger fundamentals?
DocuSign demonstrates stronger fundamentals with consistent revenue growth, positive and expanding net income, and favorable margin trends. Asana shows impressive top-line growth but continues to struggle with sustained net losses and negative net margins. DocuSign’s superior profitability and margin stability outweigh Asana’s growth, suggesting a more solid income statement foundation.
Financial Ratios Comparison
The table below presents a side-by-side comparison of key financial ratios for DocuSign, Inc. (DOCU) and Asana, Inc. (ASAN) based on their most recent fiscal year data available for 2025.
| Ratios | DocuSign, Inc. (DOCU) | Asana, Inc. (ASAN) |
|---|---|---|
| ROE | 53.32% | -112.31% |
| ROIC | 9.09% | -53.03% |
| P/E | 18.51 | -19.16 |
| P/B | 9.87 | 21.52 |
| Current Ratio | 0.81 | 1.44 |
| Quick Ratio | 0.81 | 1.44 |
| D/E (Debt to Equity) | 0.06 | 1.18 |
| Debt-to-Assets | 3.10% | 30.11% |
| Interest Coverage | 129.0 | -72.42 |
| Asset Turnover | 0.74 | 0.81 |
| Fixed Asset Turnover | 7.28 | 2.76 |
| Payout Ratio | 0 | 0 |
| Dividend Yield | 0 | 0 |
All ratios reflect the latest fiscal year 2025 figures reported in USD. Negative values in profitability and coverage ratios for Asana indicate ongoing operating losses and challenges in covering interest expenses. DocuSign shows positive profitability and strong interest coverage ratios.
Interpretation of the Ratios
DocuSign, Inc.
DocuSign shows a mix of strong and weak financial ratios, with favorable marks on net margin (35.87%), ROE (53.32%), and low debt levels, indicating good profitability and manageable leverage. However, the current ratio at 0.81 signals potential liquidity concerns. The company does not pay dividends, reflecting a likely reinvestment strategy focused on growth rather than shareholder payouts.
Asana, Inc.
Asana’s ratios indicate financial challenges, with unfavorable net margin (-35.3%), ROE (-112.31%), and interest coverage, highlighting profitability and solvency issues. Despite a solid current ratio of 1.44 and quick ratio also favorable, high debt-to-equity (1.18) is a concern. Asana does not distribute dividends, consistent with a high-growth phase prioritizing reinvestment and development.
Which one has the best ratios?
DocuSign’s ratios are generally more favorable, showing better profitability, leverage, and coverage metrics, despite some liquidity weakness. Asana faces significant profitability and solvency challenges, with many unfavorable ratios. Overall, DocuSign holds a stronger position based on the 2025 financial ratio evaluations.
Strategic Positioning
This section compares the strategic positioning of DocuSign and Asana, covering market position, key segments, and exposure to technological disruption:
DocuSign, Inc.
- Leading electronic signature software provider facing standard competitive pressures
- Focuses on e-signature solutions, AI-driven contract lifecycle management, and specialized cloud offerings
- Incorporates AI and advanced analytics to enhance contract management and workflow automation
Asana, Inc.
- Operates a work management platform in a competitive software application industry
- Offers a platform for task orchestration and strategic initiatives across multiple industries
- No explicit mention of exposure or adaptation to technological disruption
DocuSign, Inc. vs Asana, Inc. Positioning
DocuSign’s strategy centers on diversified e-signature and contract management products with AI integration, while Asana concentrates on work management software for various sectors. DocuSign’s broader product scope contrasts with Asana’s focused platform approach, each with distinct operational emphases.
Which has the best competitive advantage?
DocuSign holds a slightly favorable moat with growing profitability, indicating improving competitive strength. Asana shows a very unfavorable moat with declining profitability, suggesting weaker competitive advantage based on available data.
Stock Comparison
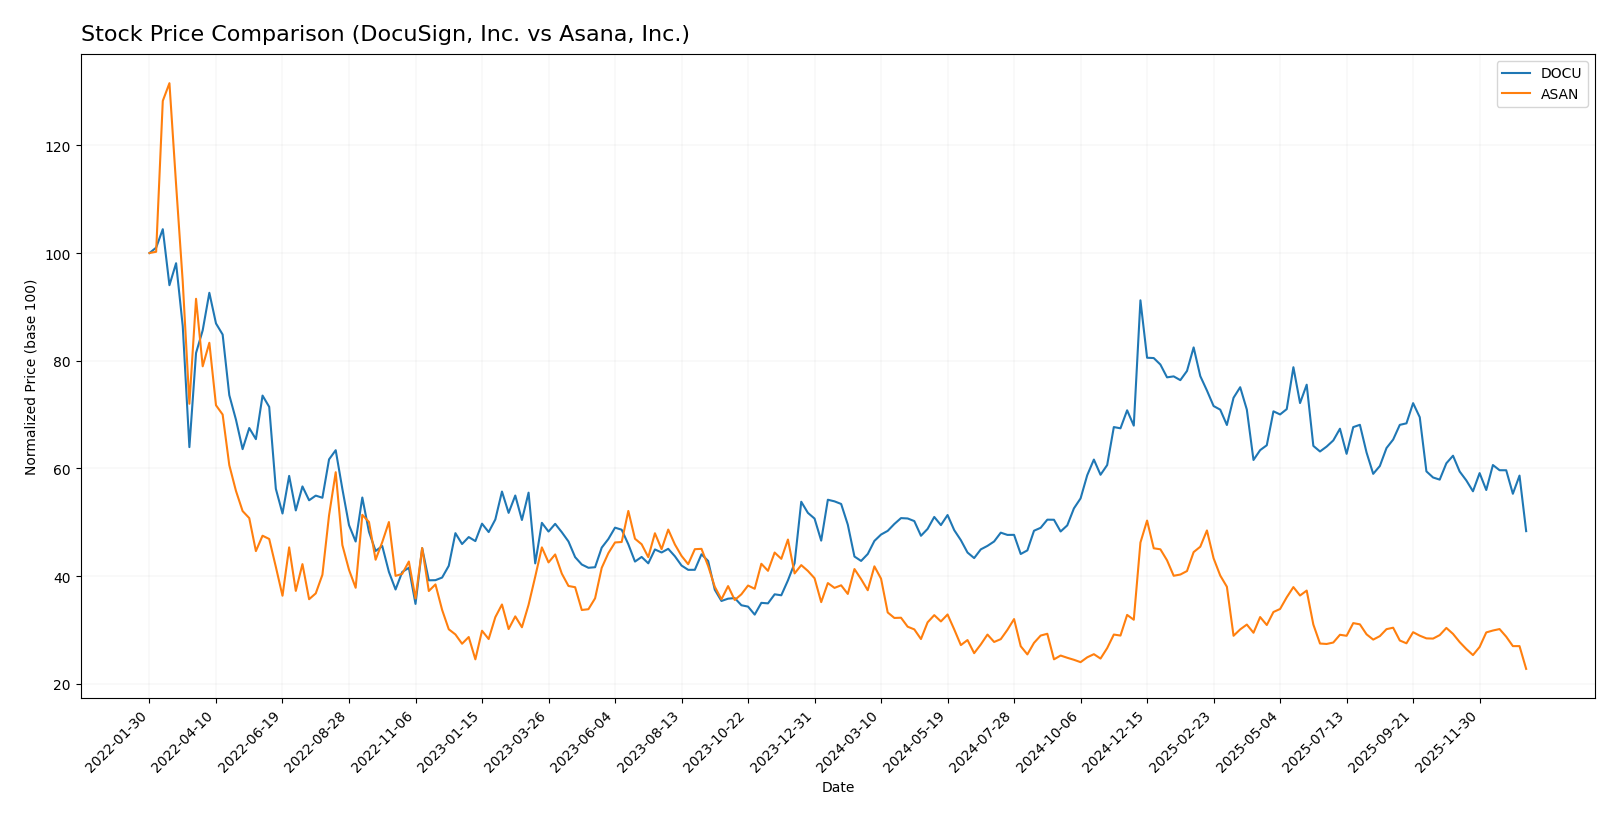
The stock price performance of DocuSign, Inc. (DOCU) and Asana, Inc. (ASAN) over the past 12 months reveals contrasting trends, with DOCU showing overall gains despite recent declines, while ASAN exhibits a sustained downward trajectory.
Trend Analysis
DocuSign’s stock recorded a 9.63% increase over the past year, indicating a bullish trend with decelerating momentum. The price ranged between 50.84 and 106.99, with recent months showing a 22.46% decline.
Asana’s stock dropped 39.07% over the last 12 months, reflecting a bearish trend with deceleration. The price fluctuated from 10.93 to 24.15, and the recent period saw a further 22.21% decrease.
Comparing the two, DocuSign delivered the highest market performance with a positive annual return. Asana’s stock underperformed, showing significant losses throughout the year.
Target Prices
The current analyst consensus presents realistic target price ranges for both DocuSign, Inc. and Asana, Inc.
| Company | Target High | Target Low | Consensus |
|---|---|---|---|
| DocuSign, Inc. | 88 | 70 | 76.86 |
| Asana, Inc. | 18 | 14 | 15.75 |
Analysts expect DocuSign’s price to rise from its current 56.71 USD toward a consensus near 77 USD, indicating upside potential. Asana’s consensus target of 15.75 USD also suggests moderate appreciation from the current price of 10.93 USD.
Analyst Opinions Comparison
This section compares analysts’ ratings and scores for DocuSign, Inc. and Asana, Inc.:
Rating Comparison
DocuSign, Inc. Rating
- Rating: B+, considered Very Favorable overall.
- Discounted Cash Flow Score: 5, Very Favorable.
- ROE Score: 4, Favorable efficiency in equity use.
- ROA Score: 4, Favorable asset utilization.
- Debt To Equity Score: 3, Moderate financial risk.
- Overall Score: 3, Moderate overall standing.
Asana, Inc. Rating
- Rating: D+, considered Very Unfavorable overall.
- Discounted Cash Flow Score: 1, Very Unfavorable.
- ROE Score: 1, Very Unfavorable efficiency.
- ROA Score: 1, Very Unfavorable asset utilization.
- Debt To Equity Score: 1, Very Unfavorable risk.
- Overall Score: 1, Very Unfavorable standing.
Which one is the best rated?
DocuSign, Inc. is clearly better rated than Asana, Inc., with higher scores across all financial metrics and an overall B+ rating versus D+ for Asana, reflecting stronger financial health and performance.
Scores Comparison
Here is a comparison of the Altman Z-Score and Piotroski Score for DocuSign and Asana:
DocuSign Scores
- Altman Z-Score: 4.43, indicating a safe zone with low bankruptcy risk.
- Piotroski Score: 5, classified as average financial strength.
Asana Scores
- Altman Z-Score: -0.27, indicating distress zone and high bankruptcy risk.
- Piotroski Score: 4, classified as average financial strength.
Which company has the best scores?
DocuSign shows a significantly stronger Altman Z-Score, placing it in the safe zone, compared to Asana’s distress zone score. Both companies have similar average Piotroski Scores, with DocuSign slightly higher at 5 versus 4.
Grades Comparison
The following section compares the latest reliable grades assigned to DocuSign, Inc. and Asana, Inc.:
DocuSign, Inc. Grades
This table lists recent grades assigned by well-known financial institutions to DocuSign, Inc.:
| Grading Company | Action | New Grade | Date |
|---|---|---|---|
| RBC Capital | Maintain | Sector Perform | 2026-01-05 |
| Evercore ISI Group | Maintain | In Line | 2025-12-05 |
| UBS | Maintain | Neutral | 2025-12-05 |
| Wells Fargo | Maintain | Equal Weight | 2025-12-05 |
| Piper Sandler | Maintain | Neutral | 2025-12-05 |
| JP Morgan | Maintain | Neutral | 2025-12-05 |
| B of A Securities | Maintain | Neutral | 2025-12-05 |
| Needham | Maintain | Hold | 2025-12-05 |
| Baird | Maintain | Neutral | 2025-12-05 |
DocuSign’s grades predominantly indicate a neutral to hold stance, with no upgrades or downgrades in recent months.
Asana, Inc. Grades
Below are recent grades provided by recognized grading firms for Asana, Inc.:
| Grading Company | Action | New Grade | Date |
|---|---|---|---|
| Citigroup | Upgrade | Buy | 2026-01-15 |
| RBC Capital | Maintain | Underperform | 2026-01-05 |
| Keybanc | Upgrade | Overweight | 2025-12-15 |
| DA Davidson | Maintain | Neutral | 2025-12-04 |
| Citigroup | Maintain | Neutral | 2025-12-03 |
| RBC Capital | Maintain | Underperform | 2025-12-03 |
| UBS | Maintain | Neutral | 2025-12-03 |
| Baird | Maintain | Neutral | 2025-09-04 |
| Morgan Stanley | Maintain | Underweight | 2025-09-04 |
| Piper Sandler | Maintain | Overweight | 2025-09-04 |
Asana shows a mix of ratings with recent upgrades to buy and overweight from Citigroup and Keybanc, indicating some positive sentiment despite ongoing underperform and neutral ratings.
Which company has the best grades?
Asana, Inc. holds better recent grades overall due to multiple upgrades to buy and overweight, whereas DocuSign, Inc. maintains a steady neutral to hold consensus. This difference may influence investors prioritizing growth potential versus stability.
Strengths and Weaknesses
Below is a comparative overview of key strengths and weaknesses for DocuSign, Inc. and Asana, Inc., based on their latest financial and operational data.
| Criterion | DocuSign, Inc. (DOCU) | Asana, Inc. (ASAN) |
|---|---|---|
| Diversification | Moderate: Revenue mainly from subscriptions (2.9B USD in 2025) with small professional services | Limited: Primarily a single SaaS product with no significant diversification |
| Profitability | Strong net margin (35.87%), ROE (53.32%) favorable; ROIC slightly favorable (9.09%) | Negative profitability with net margin -35.3%, ROE -112.31%, ROIC -53.03% |
| Innovation | Growing ROIC trend signals improving efficiency and potential competitive edge | Declining ROIC trend indicates challenges in value creation and innovation impact |
| Global presence | Well-established with significant subscription base globally | Smaller footprint, still expanding market presence |
| Market Share | Solid market share in e-signature and contract management | Smaller market share in work management software, facing intense competition |
Key takeaways: DocuSign shows growing profitability and efficient capital use, supported by strong subscription revenue, making it a more stable investment. Asana struggles with declining profitability and value destruction, indicating higher risk and the need for cautious evaluation before investing.
Risk Analysis
The table below summarizes key risk metrics for DocuSign, Inc. (DOCU) and Asana, Inc. (ASAN) based on the latest 2025 data:
| Metric | DocuSign, Inc. (DOCU) | Asana, Inc. (ASAN) |
|---|---|---|
| Market Risk | Beta 0.994 (moderate) | Beta 0.916 (moderate) |
| Debt level | Low (Debt-to-Equity 0.06, Debt-to-Assets 3.1%) | High (Debt-to-Equity 1.18, Debt-to-Assets 30.11%) |
| Regulatory Risk | Moderate (operates in regulated tech sectors) | Moderate (similar sector exposure) |
| Operational Risk | Moderate (software platform complexity) | Moderate (work management platform risks) |
| Environmental Risk | Low (digital services, limited physical footprint) | Low (digital services, limited physical footprint) |
| Geopolitical Risk | Moderate (global operations exposure) | Moderate (global operations exposure) |
DocuSign’s most impactful risks stem from moderate market exposure and operational complexity, but its low debt and strong Altman Z-score (4.43, safe zone) indicate solid financial stability. In contrast, Asana faces significant financial risk with high leverage, negative profitability, and an Altman Z-score in the distress zone (-0.27), increasing bankruptcy risk despite moderate operational and market risks. Investors should weigh these financial vulnerabilities carefully when considering Asana.
Which Stock to Choose?
DocuSign, Inc. (DOCU) has shown a favorable income evolution with a strong net margin of 35.87% and significant growth in earnings and EPS over 2021-2025. Its financial ratios are slightly favorable, highlighting excellent profitability and low debt, supported by a very favorable B+ rating and a safe Altman Z-Score of 4.43.
Asana, Inc. (ASAN) exhibits favorable revenue growth but struggles with profitability, posting a negative net margin of -35.3% and declining returns on equity and assets. Its financial ratios are slightly unfavorable with high debt levels, reflected in a very unfavorable D+ rating and a distress zone Altman Z-Score below zero.
For investors prioritizing financial stability and profitability, DocuSign’s slightly favorable ratios and very favorable rating could appear more attractive, whereas growth-oriented or risk-tolerant investors might consider Asana’s strong revenue expansion despite its financial challenges. The choice might depend on the investor’s risk appetite and strategy focus.
Disclaimer: Investment carries a risk of loss of initial capital. The past performance is not a reliable indicator of future results. Be sure to understand risks before making an investment decision.
Go Further
I encourage you to read the complete analyses of DocuSign, Inc. and Asana, Inc. to enhance your investment decisions: