In today’s fast-evolving software landscape, Dayforce Inc and Asana, Inc. stand out as influential players shaping workforce and work management solutions. Both companies operate in the application software industry, targeting business productivity through innovative cloud platforms. While Dayforce focuses on human capital management, Asana excels in task orchestration across teams. This article will analyze their strengths and risks to help you decide which stock deserves a place in your portfolio.
Table of contents
Companies Overview
I will begin the comparison between Dayforce Inc and Asana, Inc. by providing an overview of these two companies and their main differences.
Dayforce Inc Overview
Dayforce Inc operates as a human capital management (HCM) software company providing a cloud-based platform that integrates human resources, payroll, benefits, workforce management, and talent management. Headquartered in Minneapolis, it serves the US, Canada, and international markets, targeting both large enterprises with Dayforce and small businesses with Powerpay. The company trades on the NYSE under the ticker DAY and has a market cap of approximately 11.1B USD.
Asana, Inc. Overview
Asana, Inc. offers a work management platform designed to help teams coordinate daily tasks and complex projects across various industries including technology, retail, and healthcare. Based in San Francisco, Asana focuses on improving team productivity and strategic initiative management. It is listed on the NYSE with the ticker ASAN and holds a market capitalization near 2.6B USD, reflecting its specialization in collaborative software solutions.
Key similarities and differences
Both companies operate in the software application industry and are listed on the NYSE. They provide cloud-based platforms designed to enhance organizational efficiency but differ in focus: Dayforce specializes in human capital management and payroll solutions while Asana emphasizes work and project management across diverse sectors. Dayforce is significantly larger by market capitalization and employee count, highlighting its broader enterprise reach compared to Asana’s more niche team collaboration approach.
Income Statement Comparison
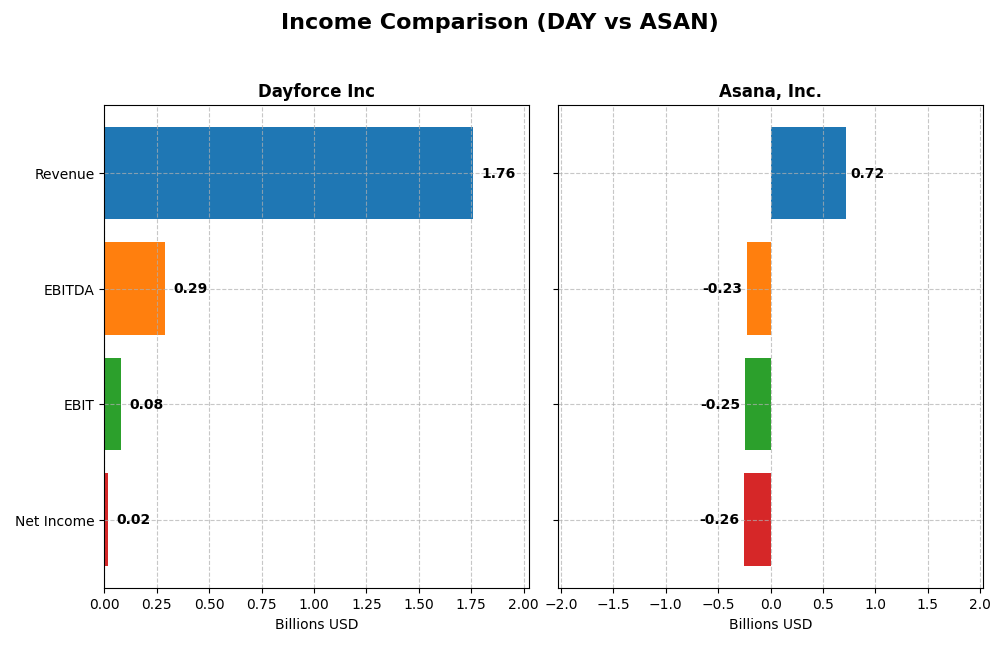
The table below compares the most recent fiscal year income statement metrics for Dayforce Inc and Asana, Inc., highlighting differences in revenue, profitability, and earnings per share.
| Metric | Dayforce Inc (2024) | Asana, Inc. (2025) |
|---|---|---|
| Market Cap | 11.1B | 2.6B |
| Revenue | 1.76B | 724M |
| EBITDA | 288M | -230M |
| EBIT | 78.2M | -247M |
| Net Income | 18.1M | -256M |
| EPS | 0.11 | -1.11 |
| Fiscal Year | 2024 | 2025 |
Income Statement Interpretations
Dayforce Inc
Dayforce Inc’s revenue showed a steady growth from 2020 to 2024, reaching $1.76B in 2024, with net income improving significantly over the period to $18.1M in 2024. Gross margin remained favorable at 46.14%, while net margin was neutral at 1.03%. In 2024, revenue growth accelerated by 16.27%, but net margin and EPS declined sharply, indicating margin pressure despite top-line strength.
Asana, Inc.
Asana, Inc. also saw consistent revenue growth from 2021 to 2025, with revenue hitting $724M in 2025 and gross margin very strong at 89.34%. However, the company posted a significant net loss of $255.5M in 2025, with unfavorable EBIT and net margins. Despite this, Asana showed positive growth in revenue, net margin, and EPS in the latest year, signaling improving operational efficiency.
Which one has the stronger fundamentals?
Both companies have favorable global income statement evaluations, with Asana showing stronger revenue growth and superior gross margins but persistent net losses. Dayforce reports positive net income growth and improved net margins over the period, albeit with recent margin compression. Dayforce’s profitability contrasts with Asana’s ongoing losses, reflecting differing stages of financial maturity and margin sustainability.
Financial Ratios Comparison
The table below compares key financial ratios for Dayforce Inc and Asana, Inc. based on their most recent fiscal year data to provide a snapshot of their financial health and performance.
| Ratios | Dayforce Inc (2024) | Asana, Inc. (2025) |
|---|---|---|
| ROE | 0.71% | -112.31% |
| ROIC | 1.31% | -53.03% |
| P/E | 633.3 | -19.16 |
| P/B | 4.50 | 21.52 |
| Current Ratio | 1.13 | 1.44 |
| Quick Ratio | 1.13 | 1.44 |
| D/E (Debt-to-Equity) | 0.48 | 1.18 |
| Debt-to-Assets | 13.52% | 30.11% |
| Interest Coverage | 2.56 | -72.42 |
| Asset Turnover | 0.19 | 0.81 |
| Fixed Asset Turnover | 7.46 | 2.76 |
| Payout ratio | 0 | 0 |
| Dividend yield | 0 | 0 |
Interpretation of the Ratios
Dayforce Inc
Dayforce exhibits mostly unfavorable financial ratios, with low net margin (1.03%), ROE (0.71%), and ROIC (1.31%), indicating weak profitability and capital efficiency. Its valuation multiples like PE (633.29) and PB (4.5) also appear stretched. The company does not pay dividends, reflecting a probable reinvestment or growth strategy without shareholder distributions.
Asana, Inc.
Asana’s ratios indicate significant challenges, including a deeply negative net margin (-35.3%) and ROE (-112.31%), signaling persistent losses and poor returns. While it has a favorable WACC (7.73%) and PE ratio (negative but favorable), its debt-to-equity ratio (1.18) and interest coverage are concerning. Asana also pays no dividends, consistent with its high-growth, investment-focused phase.
Which one has the best ratios?
Neither company shows strong financial health; Dayforce has more unfavorable ratios (57.14%) than favorable (28.57%), while Asana’s ratios are slightly less unfavorable (50%) with a higher neutral proportion (28.57%). Both lack dividend payments, reflecting growth or reinvestment priorities. Overall, Dayforce’s ratios are more unfavorable, while Asana’s appear slightly less so but still weak.
Strategic Positioning
This section compares the strategic positioning of Dayforce Inc and Asana, Inc., including market position, key segments, and exposure to technological disruption:
Dayforce Inc
- Positioned as a human capital management software leader with competitive pressure in cloud-based HR solutions.
- Focuses on cloud HCM platforms, payroll solutions, and professional services driving recurring revenue streams.
- Exposure to technological disruption through cloud platform innovation in HR and payroll services.
Asana, Inc.
- Operates in work management software with competition across various industries including tech and healthcare.
- Provides a work management platform for teams handling tasks to strategic initiatives across multiple sectors.
- Faces technological disruption risks from evolving work management and collaboration software trends.
Dayforce Inc vs Asana, Inc. Positioning
Dayforce has a diversified focus on HCM and payroll with strong recurring revenues, while Asana concentrates on work management software for diverse industries. Dayforce’s broader product scope contrasts with Asana’s specialized platform approach, each with distinct market dynamics.
Which has the best competitive advantage?
Both companies are shedding value with ROIC below WACC, but Dayforce shows a growing ROIC trend, indicating improving profitability, whereas Asana’s declining ROIC signals weakening competitive positioning.
Stock Comparison
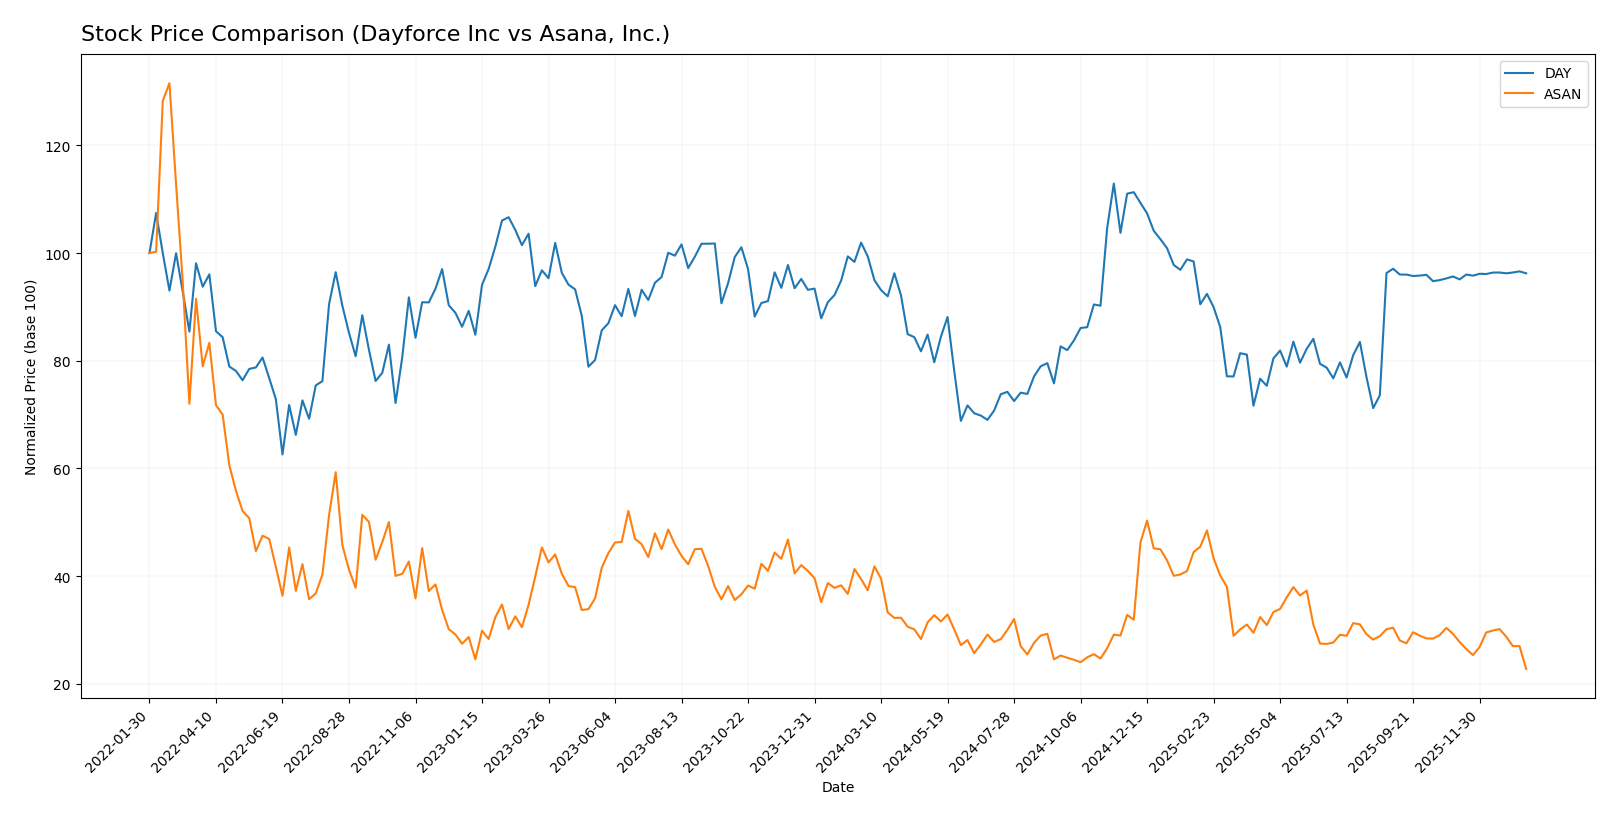
The stock price chart highlights contrasting price movements and trading dynamics over the past 12 months, with Dayforce Inc showing mild recent recovery amid a longer bearish trend, while Asana, Inc. reflects sustained significant declines and seller dominance.
Trend Analysis
Dayforce Inc’s stock experienced a -3.16% decline over the past year, marking a bearish trend with deceleration. The stock ranged between 49.46 and 81.14, showing increased buyer dominance recently.
Asana, Inc. registered a pronounced bearish trend with a -39.07% price change over the past year and deceleration. Its price fluctuated between 10.93 and 24.15, with recent seller dominance accelerating the decline.
Comparing both, Dayforce’s stock outperformed Asana’s, delivering a smaller negative return and showing signs of stabilization, whereas Asana exhibited a far steeper and more persistent downturn.
Target Prices
Analysts present a clear consensus on target prices for Dayforce Inc and Asana, Inc.
| Company | Target High | Target Low | Consensus |
|---|---|---|---|
| Dayforce Inc | 70 | 70 | 70 |
| Asana, Inc. | 18 | 14 | 15.75 |
Dayforce’s consensus target price of $70 aligns closely with its current price of $69.16, suggesting limited upside. Asana’s target consensus at $15.75 indicates potential upside from its current $10.93 price, reflecting more optimistic analyst expectations.
Analyst Opinions Comparison
This section compares analysts’ ratings and grades for Dayforce Inc and Asana, Inc.:
Rating Comparison
Dayforce Inc Rating
- Rating: C- rated as Very Favorable by analysts.
- Discounted Cash Flow Score: 2, evaluated as Moderate.
- ROE Score: 1, rated Very Unfavorable for profitability efficiency.
- ROA Score: 1, rated Very Unfavorable for asset utilization.
- Debt To Equity Score: 2, considered Moderate financial risk.
- Overall Score: 1, rated Very Unfavorable overall financial standing.
Asana, Inc. Rating
- Rating: D+ rated as Very Favorable by analysts.
- Discounted Cash Flow Score: 1, evaluated as Very Unfavorable.
- ROE Score: 1, rated Very Unfavorable for profitability efficiency.
- ROA Score: 1, rated Very Unfavorable for asset utilization.
- Debt To Equity Score: 1, considered Very Unfavorable financial risk.
- Overall Score: 1, rated Very Unfavorable overall financial standing.
Which one is the best rated?
Based strictly on the provided data, Dayforce Inc holds a slightly better rating with a C- versus Asana’s D+, and has moderately better scores in discounted cash flow and debt-to-equity, indicating marginally lower financial risk.
Scores Comparison
Here is a comparison of the financial scores for Dayforce Inc and Asana, Inc.:
Dayforce Inc Scores
- Altman Z-Score: 1.24, indicating financial distress risk.
- Piotroski Score: 5, reflecting average financial strength.
Asana, Inc. Scores
- Altman Z-Score: -0.27, indicating financial distress risk.
- Piotroski Score: 4, reflecting average financial strength.
Which company has the best scores?
Dayforce Inc has a higher Altman Z-Score and Piotroski Score than Asana, Inc., suggesting relatively better financial stability and strength based on these metrics.
Grades Comparison
The following is a comparison of the latest grades from verified grading companies for Dayforce Inc and Asana, Inc.:
Dayforce Inc Grades
This table summarizes recent analyst grades and actions on Dayforce Inc shares.
| Grading Company | Action | New Grade | Date |
|---|---|---|---|
| Needham | Maintain | Hold | 2025-10-30 |
| Stifel | Downgrade | Hold | 2025-09-19 |
| Citigroup | Downgrade | Neutral | 2025-09-17 |
| Wells Fargo | Upgrade | Equal Weight | 2025-08-22 |
| BMO Capital | Downgrade | Market Perform | 2025-08-22 |
| Keybanc | Downgrade | Sector Weight | 2025-08-22 |
| Needham | Downgrade | Hold | 2025-08-22 |
| Barclays | Maintain | Equal Weight | 2025-08-22 |
| Deutsche Bank | Maintain | Hold | 2025-08-22 |
| Jefferies | Maintain | Hold | 2025-08-21 |
Dayforce grades show a general trend of downgrades from Buy to Hold or Neutral, with several maintain ratings at Hold or Equal Weight.
Asana, Inc. Grades
This table presents recent analyst grades and actions for Asana, Inc. shares.
| Grading Company | Action | New Grade | Date |
|---|---|---|---|
| Citigroup | Upgrade | Buy | 2026-01-15 |
| RBC Capital | Maintain | Underperform | 2026-01-05 |
| Keybanc | Upgrade | Overweight | 2025-12-15 |
| DA Davidson | Maintain | Neutral | 2025-12-04 |
| Citigroup | Maintain | Neutral | 2025-12-03 |
| RBC Capital | Maintain | Underperform | 2025-12-03 |
| UBS | Maintain | Neutral | 2025-12-03 |
| Baird | Maintain | Neutral | 2025-09-04 |
| Morgan Stanley | Maintain | Underweight | 2025-09-04 |
| Piper Sandler | Maintain | Overweight | 2025-09-04 |
Asana’s grades indicate some upgrades to Buy and Overweight, balanced by several maintains at Neutral or Underperform/Underweight.
Which company has the best grades?
Asana, Inc. holds a stronger grade consensus with recent upgrades to Buy and Overweight ratings, whereas Dayforce Inc mostly experienced downgrades to Hold or Neutral. This divergence suggests differing analyst outlooks that may influence investor sentiment and portfolio decisions.
Strengths and Weaknesses
Below is a comparison of key strengths and weaknesses for Dayforce Inc and Asana, Inc. based on their latest financial and operational data.
| Criterion | Dayforce Inc (DAY) | Asana, Inc. (ASAN) |
|---|---|---|
| Diversification | Strong recurring revenue from Cloud Dayforce & Powerpay (~1.52B USD in 2024) | Limited product segmentation data; focus mainly on software collaboration tools |
| Profitability | Low net margin (1.03%), ROIC (1.31%) below WACC (8.69%) – slightly unfavorable | Negative net margin (-35.3%) and ROIC (-53%) indicating heavy losses and value destruction |
| Innovation | Growing ROIC trend (+2304%) suggests improving operational efficiency | Declining ROIC trend (-74%) signals decreasing profitability and innovation challenges |
| Global presence | Moderate; no explicit data but recurring cloud services suggest wide reach | Global SaaS presence but struggling financially |
| Market Share | Established in HR and payroll cloud services with significant recurring revenue | Competes in crowded collaboration software market but financials indicate struggles |
Key takeaways: Dayforce shows a strong revenue base with improving profitability trends but still struggles to create significant value relative to its cost of capital. Asana faces deeper financial challenges with declining profitability and value destruction, increasing risk for investors. Caution and close monitoring of profitability improvements are advisable.
Risk Analysis
Below is a risk comparison table for Dayforce Inc and Asana, Inc., based on the most recent data for 2025-2026:
| Metric | Dayforce Inc (DAY) | Asana, Inc. (ASAN) |
|---|---|---|
| Market Risk | Beta 1.18, moderate volatility | Beta 0.92, moderate volatility |
| Debt Level | Debt/Equity 0.48, favorable | Debt/Equity 1.18, unfavorable |
| Regulatory Risk | Moderate, operates mainly in US/Canada | Moderate, US-based with international reach |
| Operational Risk | Large workforce 9,600, stable operations | Smaller workforce 1,819, higher growth risk |
| Environmental Risk | Low direct impact, standard compliance | Low direct impact, standard compliance |
| Geopolitical Risk | US and Canada focus, moderate exposure | US-centric, moderate exposure |
Synthesis: Both companies face moderate market and regulatory risks typical of the software sector. Dayforce exhibits better debt management and operational stability but suffers from low profitability and financial distress signals. Asana has heavier debt burden and negative margins, indicating higher financial risk. The most impactful risk for both is their financial health, with Altman Z-Scores placing them in distress zones, signaling caution for investors.
Which Stock to Choose?
Dayforce Inc (DAY) shows a favorable income evolution with 16.27% revenue growth in 2024 and strong overall period gains. Despite unfavorable profitability ratios and a slight value destruction indicated by ROIC below WACC, its financial health includes some favorable debt and liquidity ratios. The company holds a very favorable rating of C- but shows weaknesses in return and valuation metrics.
Asana, Inc. (ASAN) has a favorable income trend with 10.94% revenue growth in 2025 and strong gross margins, yet suffers from persistent unprofitability and value destruction, with ROIC well below WACC and declining profitability. Its financial ratios are slightly unfavorable overall, with weaknesses in leverage and valuation, despite a very favorable rating of D+ and moderate liquidity metrics.
For investors prioritizing growth potential and improved profitability trends, Dayforce’s favorable income statement and improving ROIC might appear more attractive, while those accepting higher risk and focused on revenue growth in emerging firms might see Asana’s profile as fitting. Both stocks carry risks highlighted by financial distress zone scores and bearish price trends.
Disclaimer: Investment carries a risk of loss of initial capital. The past performance is not a reliable indicator of future results. Be sure to understand risks before making an investment decision.
Go Further
I encourage you to read the complete analyses of Dayforce Inc and Asana, Inc. to enhance your investment decisions: