Datadog, Inc. and Asana, Inc. are prominent players in the software application industry, each offering innovative platforms that enhance business operations. Datadog focuses on cloud monitoring and analytics, while Asana excels in work management and team collaboration. Their overlapping markets and distinct approaches to innovation make them compelling candidates for investors. In this article, I will help you decide which company holds the most promise for your investment portfolio.
Table of contents
Companies Overview
I will begin the comparison between Datadog and Asana by providing an overview of these two companies and their main differences.
Datadog Overview
Datadog, Inc. offers a SaaS platform that delivers monitoring and analytics for developers, IT operations, and business users globally. Its integrated solutions cover infrastructure, application performance, log management, and security monitoring, providing real-time observability of technology stacks. Founded in 2010 and based in New York City, Datadog operates in the software application industry with a market cap of $41.7B and employs about 6,500 people.
Asana Overview
Asana, Inc. provides a work management platform designed to help teams and executives coordinate daily tasks and strategic initiatives. It supports various industries including technology, healthcare, and finance, managing workflows from product launches to organizational goals. Founded in 2008 and headquartered in San Francisco, Asana serves the software application sector with a market cap of $2.6B and approximately 1,819 employees.
Key similarities and differences
Both Datadog and Asana operate in the software application industry and offer cloud-based platforms aimed at improving business productivity. Datadog focuses on IT infrastructure monitoring and analytics, while Asana specializes in work and project management solutions. Datadog’s larger scale is reflected in its higher market cap and employee count, whereas Asana targets a broad range of industries with a slightly lower market valuation and workforce size.
Income Statement Comparison
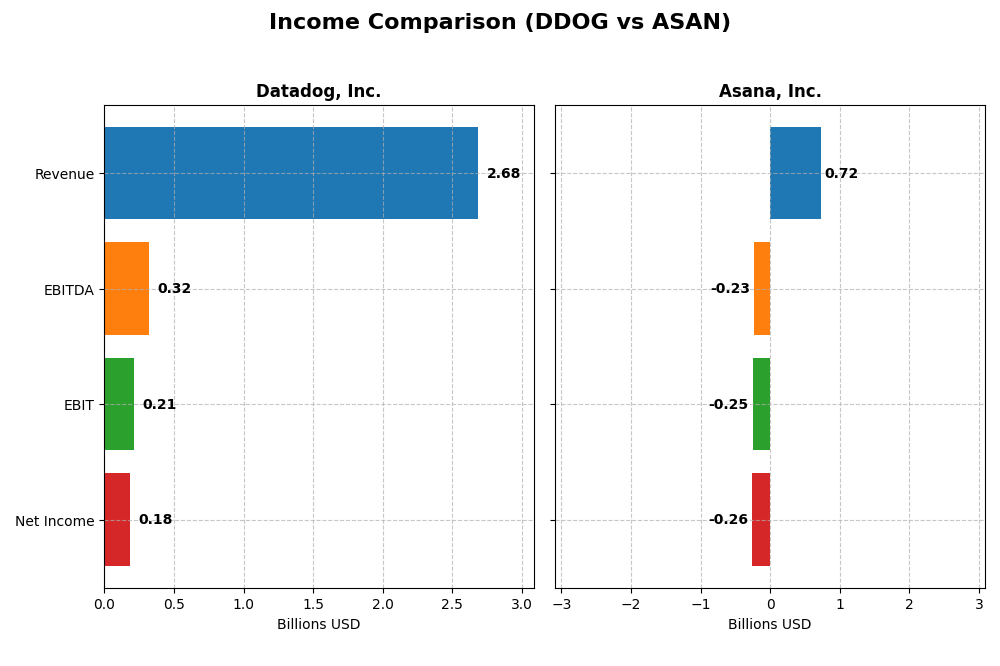
This table compares the key income statement metrics for Datadog, Inc. and Asana, Inc. for their most recent fiscal years, providing a snapshot of their financial performance.
| Metric | Datadog, Inc. (DDOG) | Asana, Inc. (ASAN) |
|---|---|---|
| Market Cap | 41.7B | 2.6B |
| Revenue | 2.68B | 724M |
| EBITDA | 318M | -230M |
| EBIT | 211M | -247M |
| Net Income | 184M | -256M |
| EPS | 0.55 | -1.11 |
| Fiscal Year | 2024 | 2025 |
Income Statement Interpretations
Datadog, Inc.
Datadog posted consistent revenue growth from 2020 to 2024, rising from $603M to $2.68B, with net income turning positive and reaching $184M in 2024. Gross margins remained strong at 80.76%, while net margin expanded favorably to 6.85%. The latest year showed accelerated revenue growth of 26.12%, alongside a significant net income improvement, reflecting increasing profitability.
Asana, Inc.
Asana’s revenue advanced steadily from $227M in 2021 to $724M in 2025, with a 10.94% increase in the most recent year. However, net losses persisted, though reduced to $256M in 2025 from a deeper loss in prior years. Gross margin stayed high at 89.34%, but the company’s negative net margin of -35.3% signals ongoing challenges in controlling expenses despite favorable revenue growth.
Which one has the stronger fundamentals?
Datadog demonstrates stronger fundamentals with substantial revenue and net income growth, improving margins, and a positive net margin in 2024. Asana, while growing revenue, continues to operate at significant net losses and negative EBIT margins, indicating weaker profitability. Datadog’s favorable income statement metrics outweigh Asana’s mixed results, highlighting more robust financial health.
Financial Ratios Comparison
This table presents the latest key financial ratios for Datadog, Inc. and Asana, Inc., providing a straightforward comparison of their profitability, liquidity, leverage, and efficiency metrics as of the most recent fiscal year.
| Ratios | Datadog, Inc. (2024) | Asana, Inc. (2025) |
|---|---|---|
| ROE | 6.77% | -112.31% |
| ROIC | 1.07% | -53.03% |
| P/E | 261.42 | -19.16 |
| P/B | 17.70 | 21.52 |
| Current Ratio | 2.64 | 1.44 |
| Quick Ratio | 2.64 | 1.44 |
| D/E | 0.68 | 1.18 |
| Debt-to-Assets | 31.84% | 30.11% |
| Interest Coverage | 7.68 | -72.42 |
| Asset Turnover | 0.46 | 0.81 |
| Fixed Asset Turnover | 6.72 | 2.76 |
| Payout ratio | 0 | 0 |
| Dividend yield | 0 | 0 |
Interpretation of the Ratios
Datadog, Inc.
Datadog shows a mixed ratio profile with favorable liquidity and interest coverage but unfavorable profitability and valuation metrics, including a high PE of 261.42 and a low ROE of 6.77%. Asset turnover is weak despite strong fixed asset efficiency. The company does not pay dividends, reflecting its reinvestment focus amid growth and high R&D expenses.
Asana, Inc.
Asana’s ratios reveal significant challenges, notably negative profitability with a net margin of -35.3% and ROE at -112.31%. Liquidity measures are moderate but debt levels are relatively high with unfavorable interest coverage. The firm also does not pay dividends, consistent with its high growth phase and emphasis on platform expansion and R&D investment.
Which one has the best ratios?
Both companies have slightly unfavorable overall ratio profiles, with Datadog benefiting from stronger liquidity and interest coverage metrics, while Asana struggles with deeper losses and weaker profitability ratios. Neither pays dividends, reflecting their growth and reinvestment strategies, but Datadog presents somewhat less risk in operational and financial stability based on the available ratios.
Strategic Positioning
This section compares the strategic positioning of Datadog, Inc. and Asana, Inc., focusing on market position, key segments, and exposure to technological disruption:
Datadog, Inc.
- Established cloud monitoring leader facing competitive pressure in SaaS application monitoring.
- Focuses on cloud infrastructure monitoring, application performance, security, and observability.
- Operates a SaaS platform integrating monitoring and security; potential disruption from cloud tech advances.
Asana, Inc.
- Work management platform competing in diverse industries with moderate competitive pressure.
- Targets work orchestration across teams, managing tasks and strategic initiatives.
- Platform enables collaborative work management; exposed to digital workplace technology shifts.
Datadog, Inc. vs Asana, Inc. Positioning
Datadog pursues a diversified SaaS strategy emphasizing cloud infrastructure, while Asana concentrates on work management software. Datadog’s broader scope offers multiple growth drivers, whereas Asana’s focus aligns with organizational productivity tools but with narrower market reach.
Which has the best competitive advantage?
Both companies are currently shedding value, but Datadog shows improving profitability, indicating a slightly unfavorable moat. Asana faces declining profitability and a very unfavorable moat, suggesting weaker competitive advantage.
Stock Comparison
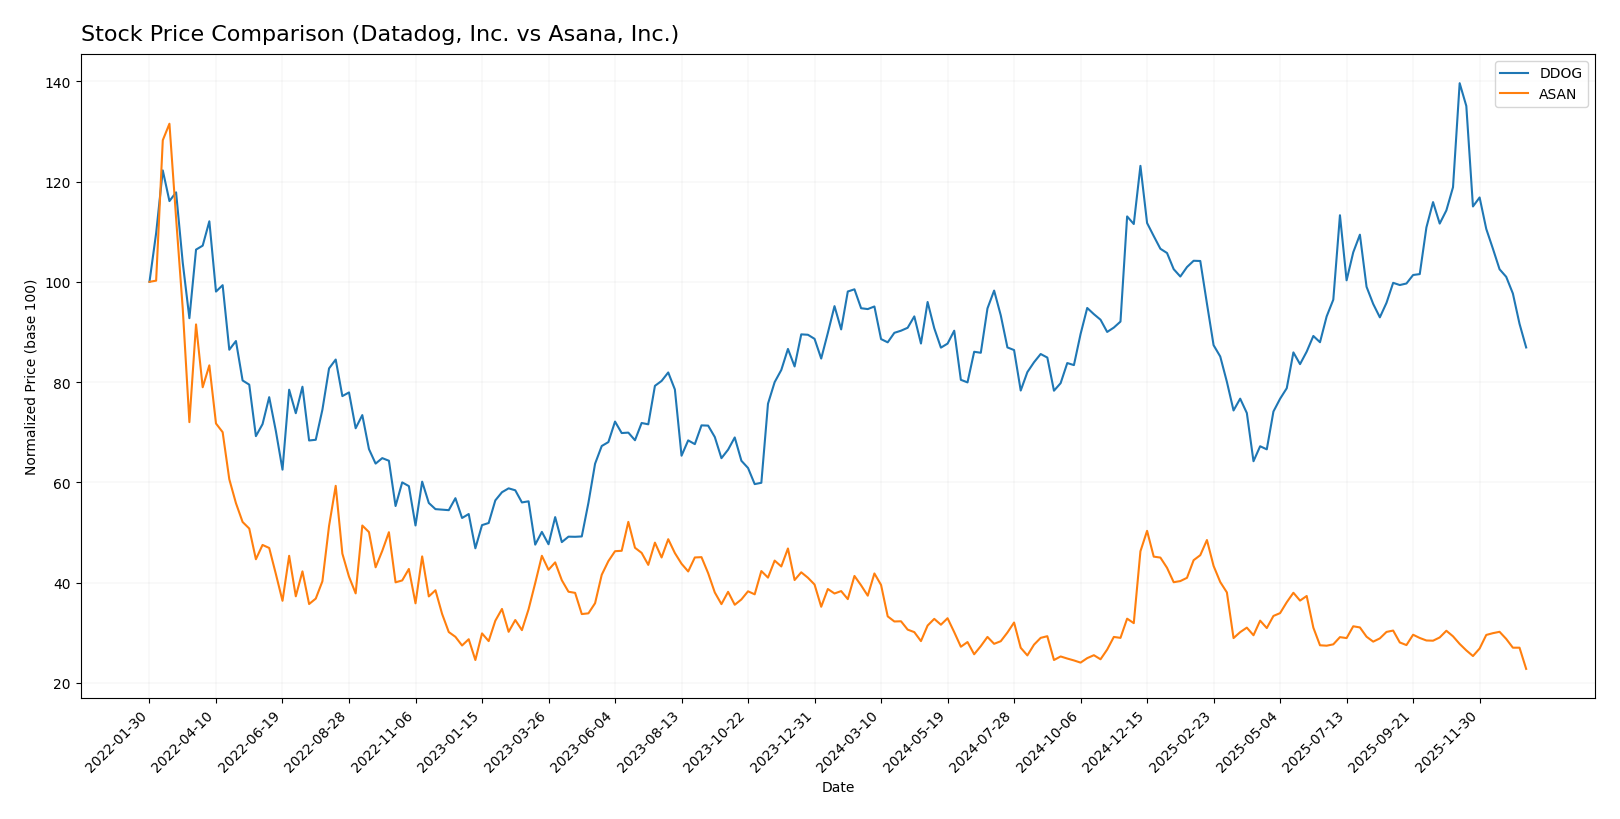
The stock prices of Datadog, Inc. (DDOG) and Asana, Inc. (ASAN) over the past 12 months reveal notable bearish trends with decelerating momentum, marked by significant price declines and varying volume dynamics.
Trend Analysis
Datadog, Inc. (DDOG) experienced a bearish trend over the past year with an 8.1% price decline and deceleration in trend momentum. The stock showed high volatility, ranging from $87.93 to $191.24, with increasing volume but recent seller dominance.
Asana, Inc. (ASAN) also showed a bearish trend with a sharper 39.07% price drop and deceleration. Volatility was lower compared to DDOG, with prices between $10.93 and $24.15, and slightly seller-dominant volume in the recent period.
Comparing both stocks, Datadog delivered a higher market performance with a smaller percentage loss than Asana, despite both showing bearish trends and decelerating prices over the past year.
Target Prices
Analysts provide a clear consensus on target prices for Datadog, Inc. and Asana, Inc., indicating potential upside from current levels.
| Company | Target High | Target Low | Consensus |
|---|---|---|---|
| Datadog, Inc. | 215 | 105 | 177.67 |
| Asana, Inc. | 18 | 14 | 15.75 |
The consensus target prices suggest that Datadog’s stock, currently at $119.02, has significant upside potential, while Asana’s stock at $10.93 is expected to rise moderately to meet analyst expectations.
Analyst Opinions Comparison
This section compares analysts’ ratings and grades for Datadog, Inc. and Asana, Inc.:
Rating Comparison
Datadog, Inc. Rating
- Rating: C+ indicating a very favorable status.
- Discounted Cash Flow Score: 4, considered favorable.
- ROE Score: 2, moderate performance in profit generation.
- ROA Score: 3, moderate effectiveness in asset utilization.
- Debt To Equity Score: 2, moderate financial risk.
- Overall Score: 2, moderate overall financial standing.
Asana, Inc. Rating
- Rating: D+ indicating a very favorable status.
- Discounted Cash Flow Score: 1, very unfavorable.
- ROE Score: 1, very unfavorable in profit generation.
- ROA Score: 1, very unfavorable effectiveness in asset utilization.
- Debt To Equity Score: 1, very unfavorable financial risk.
- Overall Score: 1, very unfavorable overall financial standing.
Which one is the best rated?
Datadog holds better ratings and scores than Asana in all evaluated categories, including discounted cash flow, ROE, ROA, debt to equity, and overall score, indicating a stronger financial profile based on the data provided.
Scores Comparison
Here is the comparison of the Altman Z-Score and Piotroski Score for both companies:
Datadog Scores
- Altman Z-Score: 11.37, indicating strong financial stability in the safe zone.
- Piotroski Score: 6, reflecting average financial strength.
Asana Scores
- Altman Z-Score: -0.27, indicating financial distress in the distress zone.
- Piotroski Score: 4, reflecting average financial strength.
Which company has the best scores?
Datadog shows a significantly stronger Altman Z-Score, placing it firmly in the safe zone, while Asana is in financial distress. Both have average Piotroski Scores, with Datadog slightly higher. Overall, Datadog’s scores indicate better financial health.
Grades Comparison
The following grades summarize recent analyst assessments for Datadog, Inc. and Asana, Inc.:
Datadog, Inc. Grades
This table lists recent grades from major financial institutions for Datadog, Inc.:
| Grading Company | Action | New Grade | Date |
|---|---|---|---|
| Citigroup | Maintain | Buy | 2026-01-16 |
| Morgan Stanley | Upgrade | Overweight | 2026-01-12 |
| Barclays | Maintain | Overweight | 2026-01-12 |
| Keybanc | Maintain | Overweight | 2026-01-12 |
| Truist Securities | Maintain | Hold | 2026-01-07 |
| Jefferies | Maintain | Buy | 2026-01-05 |
| RBC Capital | Maintain | Outperform | 2026-01-05 |
| Piper Sandler | Maintain | Overweight | 2026-01-05 |
Datadog’s grades predominantly reflect positive sentiment, with multiple buy and overweight ratings and only one hold, indicating general confidence among analysts.
Asana, Inc. Grades
This table shows recent grades from major financial institutions for Asana, Inc.:
| Grading Company | Action | New Grade | Date |
|---|---|---|---|
| Citigroup | Upgrade | Buy | 2026-01-15 |
| RBC Capital | Maintain | Underperform | 2026-01-05 |
| Keybanc | Upgrade | Overweight | 2025-12-15 |
| DA Davidson | Maintain | Neutral | 2025-12-04 |
| Citigroup | Maintain | Neutral | 2025-12-03 |
| RBC Capital | Maintain | Underperform | 2025-12-03 |
| UBS | Maintain | Neutral | 2025-12-03 |
| Baird | Maintain | Neutral | 2025-09-04 |
| Morgan Stanley | Maintain | Underweight | 2025-09-04 |
| Piper Sandler | Maintain | Overweight | 2025-09-04 |
Asana’s ratings are mixed, with upgrades to buy and overweight balanced by underperform and neutral opinions, reflecting some analyst caution.
Which company has the best grades?
Datadog, Inc. has received more consistent and favorable grades, including numerous buy and overweight ratings, compared to Asana, Inc.’s more mixed and cautious outlook. This suggests stronger analyst confidence in Datadog’s prospects, potentially impacting investor sentiment and risk assessments accordingly.
Strengths and Weaknesses
The table below summarizes the key strengths and weaknesses of Datadog, Inc. (DDOG) and Asana, Inc. (ASAN) based on their recent financial and strategic data.
| Criterion | Datadog, Inc. (DDOG) | Asana, Inc. (ASAN) |
|---|---|---|
| Diversification | Moderate product focus on cloud monitoring and analytics, with steady innovation | Narrow product range focused on work management software, limited diversification |
| Profitability | Slightly profitable with a net margin of 6.85%, but ROIC (1.07%) below WACC (9.53%) | Negative profitability, net margin at -35.3%, and declining ROIC (-53.03%) |
| Innovation | Growing ROIC trend (+224%), signaling improving efficiency and innovation | Declining ROIC trend (-74%), indicating challenges in innovation and capital efficiency |
| Global presence | Strong with favorable liquidity ratios (current and quick ratios at 2.64) | Moderate global reach with neutral liquidity (current ratio 1.44) |
| Market Share | High valuation multiples (PE 261.42, PB 17.7) reflect market optimism but pose risk | High PB (21.52) but negative PE, indicating market skepticism and financial instability |
Key takeaways: Datadog shows improving profitability and innovation despite current value destruction, while Asana struggles with declining profitability and efficiency. Both companies exhibit slightly unfavorable financial ratios, warranting cautious investment consideration.
Risk Analysis
Below is a comparative table highlighting key risks for Datadog, Inc. (DDOG) and Asana, Inc. (ASAN) based on the most recent data available in 2026:
| Metric | Datadog, Inc. (DDOG) | Asana, Inc. (ASAN) |
|---|---|---|
| Market Risk | Moderate (Beta 1.26) | Moderate-Low (Beta 0.92) |
| Debt level | Moderate (Debt-to-Equity 0.68) | High (Debt-to-Equity 1.18) |
| Regulatory Risk | Low | Low |
| Operational Risk | Moderate (Tech sector dynamics) | Moderate (Scaling challenges) |
| Environmental Risk | Low | Low |
| Geopolitical Risk | Moderate (Global cloud exposure) | Moderate (Global client base) |
Datadog’s primary risks stem from a moderately high market volatility and operational challenges inherent to the fast-evolving cloud monitoring sector. Asana faces more pronounced financial risk due to its higher leverage and ongoing operational losses, reflected in its distress-level Altman Z-Score and negative profitability metrics. Investors should weigh Asana’s higher financial risk against its growth potential, while Datadog offers relatively greater financial stability but with valuation pressures.
Which Stock to Choose?
Datadog, Inc. (DDOG) shows strong income growth with a 344.81% revenue increase over 2020-2024 and favorable margins, alongside improving profitability. Financial ratios reveal a mixed picture: some favorable liquidity and coverage metrics, but an overall slightly unfavorable ratio profile. Debt levels are moderate, and the company holds a very favorable C+ rating.
Asana, Inc. (ASAN) has favorable gross margin and revenue growth (218.88% overall), but suffers from persistent negative profitability and declining returns on invested capital. Financial ratios are mostly unfavorable, with higher leverage and weak coverage. Its debt is higher relative to equity, and it holds a very unfavorable D+ rating.
Investors prioritizing growth and improving profitability might find DDOG’s favorable income statement and stable rating more appealing, while those with a higher risk tolerance and focus on potential turnaround opportunities could interpret ASAN’s profile as a speculative choice despite its challenges. Overall, DDOG’s stronger rating and income metrics suggest it may appear more favorable for quality or stability-oriented profiles, whereas ASAN might be seen as more suited to risk-tolerant strategies.
Disclaimer: Investment carries a risk of loss of initial capital. The past performance is not a reliable indicator of future results. Be sure to understand risks before making an investment decision.
Go Further
I encourage you to read the complete analyses of Datadog, Inc. and Asana, Inc. to enhance your investment decisions: