In today’s fast-evolving tech landscape, choosing the right software company to invest in demands careful analysis. Cadence Design Systems, Inc. (CDNS) and Asana, Inc. (ASAN) both operate within the software application sector but target distinct niches—Cadence focuses on advanced integrated circuit design tools, while Asana provides innovative work management solutions. This article will explore their market positions and innovation strategies to help you identify the most compelling investment opportunity.
Table of contents
Companies Overview
I will begin the comparison between Cadence Design Systems and Asana by providing an overview of these two companies and their main differences.
Cadence Design Systems Overview
Cadence Design Systems, Inc. focuses on providing software, hardware, services, and reusable integrated circuit design blocks worldwide. Its offerings include functional verification, digital IC design, physical implementation, custom IC design, and system design products. The company serves diverse markets like 5G communications, aerospace, automotive, industrial, and healthcare. Headquartered in San Jose, CA, Cadence is a well-established player in the application software industry with a market cap of $86.4B.
Asana Overview
Asana, Inc. operates a work management platform designed for individuals, teams, and executives to manage tasks and strategic initiatives. The platform supports industries including technology, retail, education, and healthcare. Asana is headquartered in San Francisco, CA, and is a younger company incorporated in 2008, with a market cap of approximately $2.6B. It focuses on streamlining collaboration and project management through cloud-based software solutions.
Key similarities and differences
Both Cadence and Asana operate in the software application sector and provide solutions that enhance productivity and efficiency. However, Cadence targets integrated circuit design and verification markets, serving hardware-focused industries, while Asana delivers a cloud-based platform for work and project management across various service sectors. Cadence’s business is more hardware-software integrated, whereas Asana emphasizes software-only workflow orchestration.
Income Statement Comparison
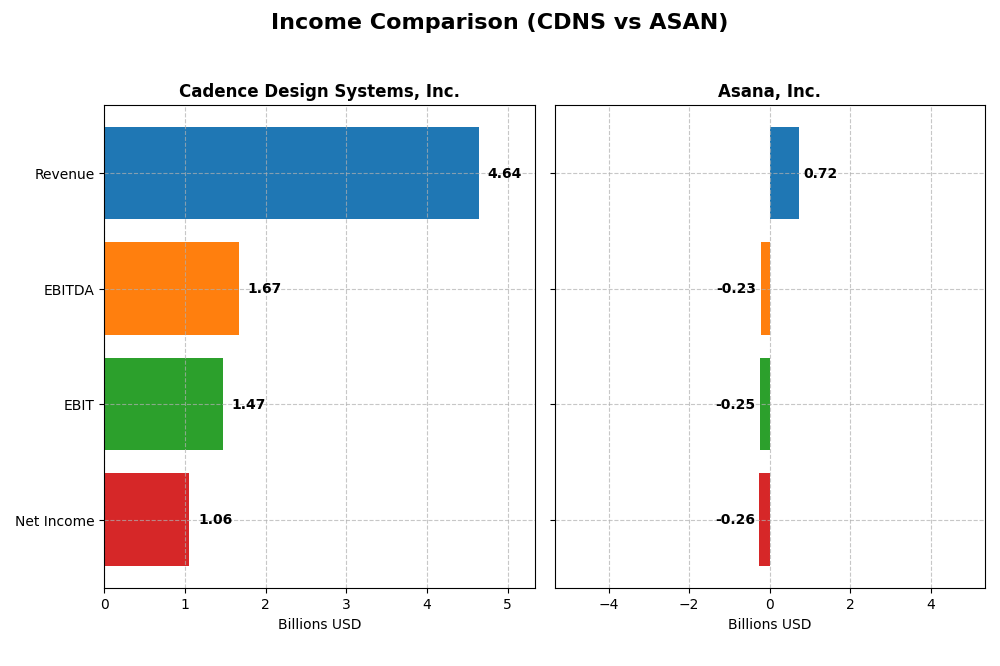
This table compares the most recent fiscal year income statement metrics for Cadence Design Systems, Inc. and Asana, Inc., highlighting key financial performance indicators.
| Metric | Cadence Design Systems, Inc. | Asana, Inc. |
|---|---|---|
| Market Cap | 86.4B | 2.6B |
| Revenue | 4.64B | 724M |
| EBITDA | 1.67B | -230M |
| EBIT | 1.47B | -247M |
| Net Income | 1.06B | -256M |
| EPS | 3.89 | -1.11 |
| Fiscal Year | 2024 | 2025 |
Income Statement Interpretations
Cadence Design Systems, Inc.
Cadence Design Systems has shown strong revenue growth from $2.68B in 2020 to $4.64B in 2024, with net income growing from $591M to $1.06B over the same period. Margins have remained robust, with a gross margin averaging above 86% and a net margin near 23% in 2024. The latest year saw 13.5% revenue growth, stable operating expenses, and a slight dip in net margin growth.
Asana, Inc.
Asana’s revenue increased significantly from $227M in 2021 to $724M in 2025, reflecting rapid expansion. Despite this, net income remained negative, though losses narrowed from -$212M to -$256M. Gross margin stayed high at 89%, but EBIT and net margins remain deeply negative. The 2025 fiscal year showed continued revenue growth of nearly 11% and improvements in net margin and EPS.
Which one has the stronger fundamentals?
Cadence Design Systems exhibits stronger fundamentals with consistent profitability, favorable margins, and sustained net income growth. Asana, while growing revenue rapidly, remains unprofitable with substantial net losses and negative EBIT margins. Cadence’s stable income and margin metrics contrast with Asana’s ongoing operating deficits, indicating more established financial health for Cadence over the period analyzed.
Financial Ratios Comparison
The table below presents the most recent key financial ratios for Cadence Design Systems, Inc. (CDNS) and Asana, Inc. (ASAN) as of their latest fiscal year-end.
| Ratios | Cadence Design Systems, Inc. (CDNS) FY 2024 | Asana, Inc. (ASAN) FY 2025 |
|---|---|---|
| ROE | 22.6% | -112.3% |
| ROIC | 13.4% | -53.0% |
| P/E | 77.2 | -19.2 |
| P/B | 17.4 | 21.5 |
| Current Ratio | 2.93 | 1.44 |
| Quick Ratio | 2.74 | 1.44 |
| D/E (Debt-to-Equity) | 0.55 | 1.18 |
| Debt-to-Assets | 28.8% | 30.1% |
| Interest Coverage | 17.8 | -72.4 |
| Asset Turnover | 0.52 | 0.81 |
| Fixed Asset Turnover | 7.68 | 2.76 |
| Payout Ratio | 0 | 0 |
| Dividend Yield | 0 | 0 |
Interpretation of the Ratios
Cadence Design Systems, Inc.
Cadence Design Systems exhibits generally strong financial ratios, with favorable net margin (22.74%), ROE (22.58%), and ROIC (13.43%), indicating solid profitability and efficient capital use. However, valuation metrics like P/E (77.2) and P/B (17.44) appear high and unfavorable, suggesting the stock may be expensive. The company does not pay dividends, likely reinvesting earnings to support growth.
Asana, Inc.
Asana’s ratios reflect challenges, with significantly unfavorable net margin (-35.3%), ROE (-112.31%), and ROIC (-53.03%), pointing to losses and inefficient capital allocation. The debt-to-equity ratio (1.18) and interest coverage ratio (-67.09) are also concerning, indicating higher financial risk. Asana does not pay dividends, consistent with its negative earnings and focus on growth and development.
Which one has the best ratios?
Cadence Design Systems has the more favorable ratio profile, with strong profitability and manageable financial leverage, despite its high valuation multiples. Asana’s ratios show significant weaknesses in profitability and financial stability, reflecting its growth phase and operational losses. Overall, Cadence’s ratios suggest a healthier financial position compared to Asana.
Strategic Positioning
This section compares the strategic positioning of Cadence Design Systems, Inc. and Asana, Inc. in terms of market position, key segments, and exposure to technological disruption:
Cadence Design Systems, Inc.
- Leading software provider in IC design with strong NASDAQ presence and significant market cap of 86B USD.
- Focuses on semiconductor design tools, IP products, and services for diverse markets including 5G, automotive, and aerospace.
- Operates in a specialized, complex hardware and software environment with ongoing innovation in chip verification and design.
Asana, Inc.
- Smaller NYSE-listed software company focused on work management with a market cap of 2.6B USD.
- Provides a work management platform for various industries including technology, retail, and healthcare.
- Faces disruption risk from evolving collaboration and productivity technologies in a competitive SaaS market.
Cadence Design Systems, Inc. vs Asana, Inc. Positioning
Cadence maintains a diversified approach with multiple product lines across hardware, software, and services targeting high-tech industries, while Asana concentrates on a single work management platform serving broad industry verticals. Cadence’s diversified portfolio supports resilience, whereas Asana’s focused model may offer agility but depends heavily on SaaS market dynamics.
Which has the best competitive advantage?
Cadence shows a slightly favorable economic moat by creating value despite declining profitability, reflecting efficient capital use in a complex market. Asana’s very unfavorable moat with shrinking returns indicates weaker competitive advantages and challenges in sustaining value creation.
Stock Comparison
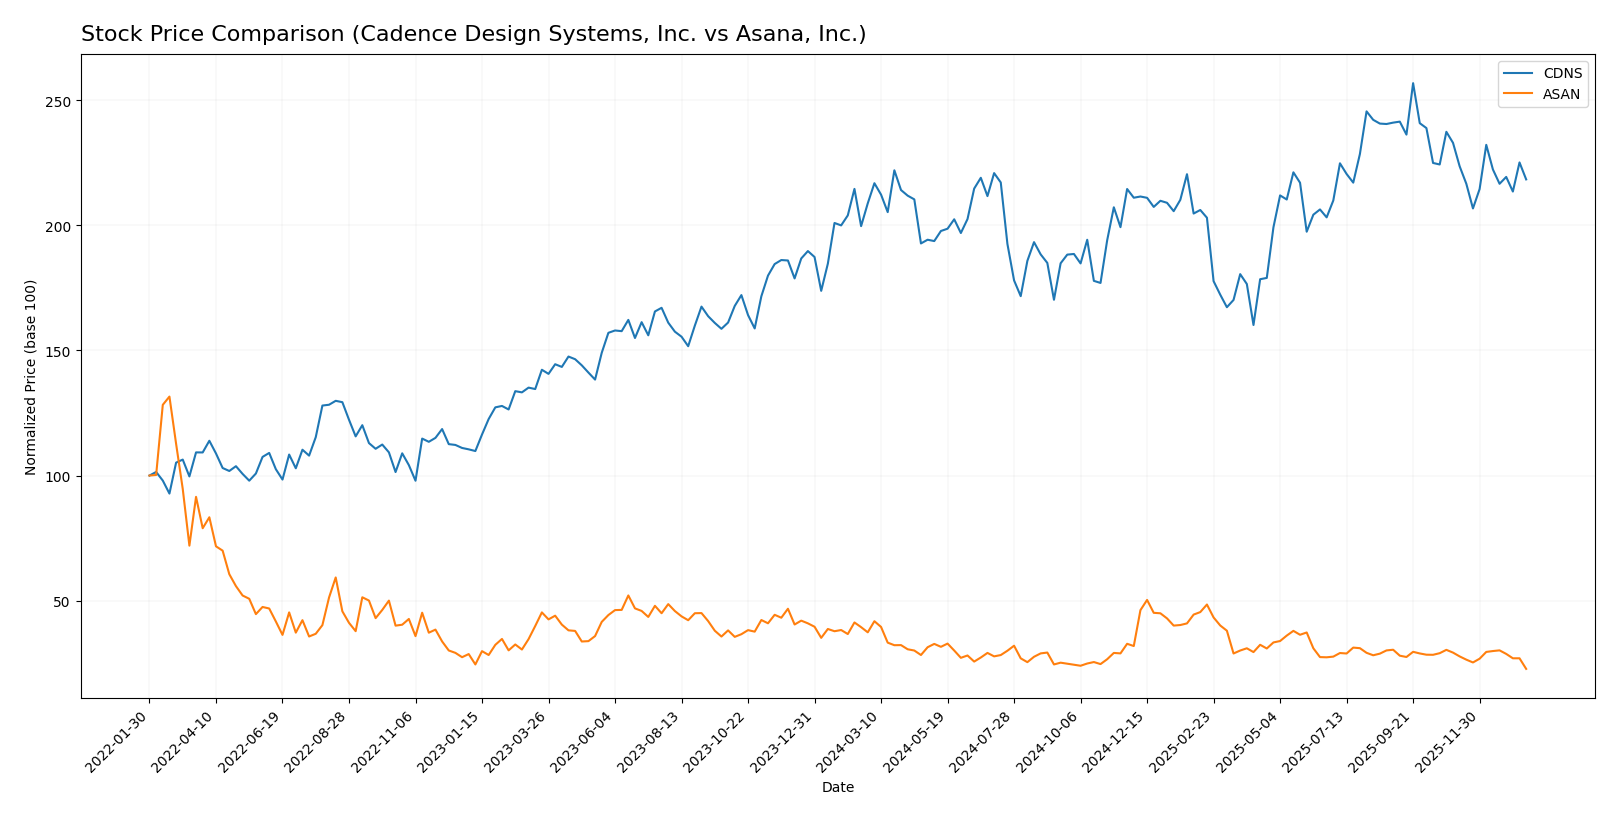
The stock prices of Cadence Design Systems, Inc. (CDNS) and Asana, Inc. (ASAN) have exhibited contrasting movements over the past 12 months, with CDNS showing modest growth and ASAN experiencing significant declines amid shifting trading dynamics.
Trend Analysis
Cadence Design Systems, Inc. demonstrated a bullish trend over the past 12 months with a 4.59% price increase, though the upward momentum showed deceleration. The stock ranged between 232.88 and 373.35, with a relatively high volatility reflected by a 29.12 standard deviation.
Asana, Inc. recorded a bearish trend over the same period, with a 39.07% price decline and decelerating downward momentum. Price fluctuations were narrower, between 10.93 and 24.15, supported by a low volatility level of 2.87 standard deviation.
Comparing the two, Cadence Design Systems delivered the highest market performance, maintaining a positive growth trajectory, whereas Asana faced a notable decrease in stock value throughout the year.
Target Prices
Here is the consensus target price overview based on reliable analyst estimates for these companies:
| Company | Target High | Target Low | Consensus |
|---|---|---|---|
| Cadence Design Systems, Inc. | 418 | 275 | 381 |
| Asana, Inc. | 18 | 14 | 15.75 |
Analysts expect Cadence Design Systems to trade significantly above its current price of 317.45 USD, indicating potential upside. Asana’s consensus target of 15.75 USD also suggests moderate appreciation from its current price of 10.93 USD.
Analyst Opinions Comparison
This section compares analysts’ ratings and grades for Cadence Design Systems, Inc. and Asana, Inc.:
Rating Comparison
CDNS Rating
- Rating: B, classified as Very Favorable by analysts.
- Discounted Cash Flow Score: 3, indicating a moderate valuation based on future cash flows.
- ROE Score: 4, showing favorable efficiency in generating profit from shareholders’ equity.
- ROA Score: 5, considered very favorable for asset utilization in earnings generation.
- Debt To Equity Score: 2, a moderate level indicating some financial risk.
- Overall Score: 3, representing a moderate overall financial standing.
ASAN Rating
- Rating: D+, also classified as Very Favorable.
- Discounted Cash Flow Score: 1, signaling a very unfavorable valuation.
- ROE Score: 1, reflecting very unfavorable efficiency.
- ROA Score: 1, rated very unfavorable for asset utilization.
- Debt To Equity Score: 1, very unfavorable, indicating higher financial risk.
- Overall Score: 1, very unfavorable overall financial standing.
Which one is the best rated?
Based strictly on the provided data, Cadence Design Systems, Inc. is better rated with a B rating and higher scores in key financial metrics, while Asana, Inc. holds a D+ rating with uniformly very unfavorable scores.
Scores Comparison
Here is a comparison of the financial health scores for Cadence Design Systems, Inc. and Asana, Inc.:
CDNS Scores
- Altman Z-Score: 14.51, indicating a safe zone status.
- Piotroski Score: 7, reflecting strong financial health.
ASAN Scores
- Altman Z-Score: -0.27, indicating a distress zone status.
- Piotroski Score: 4, reflecting average financial health.
Which company has the best scores?
Based on the provided data, Cadence Design Systems shows a significantly higher Altman Z-Score and a stronger Piotroski Score compared to Asana, indicating better financial stability and strength.
Grades Comparison
The grades for Cadence Design Systems, Inc. and Asana, Inc. from various reputable grading companies are as follows:
Cadence Design Systems, Inc. Grades
The following table summarizes recent grades assigned by well-known grading firms for Cadence Design Systems, Inc.:
| Grading Company | Action | New Grade | Date |
|---|---|---|---|
| Needham | Maintain | Buy | 2025-12-22 |
| Wells Fargo | Maintain | Overweight | 2025-10-28 |
| Baird | Maintain | Outperform | 2025-10-28 |
| Needham | Maintain | Buy | 2025-10-28 |
| JP Morgan | Maintain | Overweight | 2025-10-28 |
| Oppenheimer | Maintain | Underperform | 2025-10-28 |
| Rosenblatt | Maintain | Neutral | 2025-10-28 |
| Rosenblatt | Maintain | Neutral | 2025-10-22 |
| Needham | Maintain | Buy | 2025-07-29 |
| Loop Capital | Maintain | Buy | 2025-07-29 |
Cadence Design Systems has predominantly received positive grades such as Buy, Overweight, and Outperform, with a few Neutral and one Underperform rating.
Asana, Inc. Grades
The following table presents recent grades from recognized grading companies for Asana, Inc.:
| Grading Company | Action | New Grade | Date |
|---|---|---|---|
| Citigroup | Upgrade | Buy | 2026-01-15 |
| RBC Capital | Maintain | Underperform | 2026-01-05 |
| Keybanc | Upgrade | Overweight | 2025-12-15 |
| DA Davidson | Maintain | Neutral | 2025-12-04 |
| Citigroup | Maintain | Neutral | 2025-12-03 |
| RBC Capital | Maintain | Underperform | 2025-12-03 |
| UBS | Maintain | Neutral | 2025-12-03 |
| Baird | Maintain | Neutral | 2025-09-04 |
| Morgan Stanley | Maintain | Underweight | 2025-09-04 |
| Piper Sandler | Maintain | Overweight | 2025-09-04 |
Asana’s grades reflect a mix of Buy and Overweight upgrades alongside multiple Neutral and Underperform ratings, indicating varied analyst sentiment.
Which company has the best grades?
Cadence Design Systems, Inc. has received more consistently positive grades with a majority of Buy, Overweight, and Outperform ratings compared to Asana, Inc.’s more mixed profile including several Underperform and Neutral grades. This divergence may influence investor confidence and perceived stability differently for each stock.
Strengths and Weaknesses
The table below compares key strengths and weaknesses of Cadence Design Systems, Inc. (CDNS) and Asana, Inc. (ASAN) based on their recent performance and financial metrics.
| Criterion | Cadence Design Systems, Inc. (CDNS) | Asana, Inc. (ASAN) |
|---|---|---|
| Diversification | Strong revenue base with $4.2B in product and maintenance, plus growing tech services segment | Limited diversification, primarily focused on project management software |
| Profitability | High net margin (22.74%), ROIC (13.43%), and ROE (22.58%) indicating solid profitability | Negative net margin (-35.3%), ROIC (-53.03%), and ROE (-112.31%) showing losses |
| Innovation | Consistent investment in technology services driving innovation | Innovation efforts present but profitability challenges hinder scalability |
| Global presence | Established global footprint in semiconductor design software | Growing presence but less established globally |
| Market Share | Strong market position in electronic design automation | Smaller market share in collaborative work management |
Key takeaways: Cadence exhibits strong profitability, diversification, and global reach but faces a declining ROIC trend, which requires monitoring. Asana struggles with profitability and value creation, reflecting a high-risk profile despite growth potential. Investors should weigh Cadence’s stability against Asana’s challenges carefully.
Risk Analysis
Below is a comparative risk table for Cadence Design Systems, Inc. (CDNS) and Asana, Inc. (ASAN) based on the most recent data from 2025-2026:
| Metric | Cadence Design Systems, Inc. (CDNS) | Asana, Inc. (ASAN) |
|---|---|---|
| Market Risk | Moderate beta of 1.02, tech sector exposure | Slightly lower beta of 0.92, volatile growth stock |
| Debt level | Moderate debt-to-equity ratio of 0.55, interest coverage strong at 19.4x | High debt-to-equity of 1.18, negative interest coverage |
| Regulatory Risk | Moderate, technology sector compliance | Moderate, with SaaS privacy and data security concerns |
| Operational Risk | Low, diversified product lines and strong verification platforms | Higher, reliant on platform adoption and subscription growth |
| Environmental Risk | Low, software-focused with limited physical impact | Low, primarily cloud-based services |
| Geopolitical Risk | Moderate, global supply chain exposure in semiconductor tools | Moderate, global customer base but less supply chain risk |
Synthesis: The most impactful risks lie in Asana’s financial distress, evidenced by high debt and negative interest coverage, coupled with unfavorable profitability ratios. Cadence shows moderate market and geopolitical risks but maintains strong financial health and operational stability, making it less risky overall.
Which Stock to Choose?
Cadence Design Systems, Inc. (CDNS) shows favorable income evolution with 13.48% revenue growth in 2024 and strong profitability metrics, including a 22.74% net margin. Financial ratios are mostly favorable, with low debt levels and a solid current ratio of 2.93. The company holds a very favorable B rating and demonstrates a slightly favorable moat despite a declining ROIC.
Asana, Inc. (ASAN) exhibits favorable revenue growth of 10.94% in 2025 but suffers from negative profitability, with a -35.3% net margin and unfavorable financial ratios overall. Debt levels are higher and interest coverage is negative. The firm carries a very unfavorable overall rating of D+ and a very unfavorable moat, indicating ongoing value destruction.
Investors focused on financial stability and quality might view CDNS more favorably due to its consistent value creation and strong financial health. Conversely, those with a higher risk tolerance and growth-oriented strategy might find ASAN’s substantial revenue growth and improving income statement metrics more aligned with their profile, despite its current challenges.
Disclaimer: Investment carries a risk of loss of initial capital. The past performance is not a reliable indicator of future results. Be sure to understand risks before making an investment decision.
Go Further
I encourage you to read the complete analyses of Cadence Design Systems, Inc. and Asana, Inc. to enhance your investment decisions: