In the dynamic software industry, Bentley Systems, Incorporated (BSY) and Asana, Inc. (ASAN) stand out as innovators with distinct yet overlapping market focuses. Bentley excels in infrastructure engineering applications, while Asana leads in work management platforms for diverse industries. Both companies leverage technology to streamline complex workflows, making their comparison vital for investors seeking growth and stability. Join me as we analyze which company presents the most compelling investment opportunity.
Table of contents
Companies Overview
I will begin the comparison between Bentley Systems and Asana by providing an overview of these two companies and their main differences.
Bentley Systems Overview
Bentley Systems, Incorporated develops infrastructure engineering software solutions across the Americas, Europe, the Middle East, Africa, and Asia-Pacific. Its offerings include open modeling, simulation applications, project delivery systems, and asset performance systems tailored for civil, structural, geotechnical, and geoscience engineering professionals. Founded in 1984, Bentley is headquartered in Exton, Pennsylvania, and employs around 5,500 people.
Asana Overview
Asana, Inc. operates a work management platform designed for individuals, team leads, and executives globally. The platform supports orchestration of daily tasks to strategic initiatives across industries like technology, retail, healthcare, and financial services. Founded in 2008 and based in San Francisco, California, Asana employs approximately 1,819 people and focuses on facilitating collaborative work management.
Key similarities and differences
Both Bentley Systems and Asana operate in the software application industry within the technology sector, targeting business productivity and operational efficiency. Bentley specializes in infrastructure engineering software and project delivery, serving engineering and construction professionals, while Asana provides a broader work management platform for diverse industries and organizational roles. Bentley employs significantly more staff and has a larger market capitalization compared to Asana.
Income Statement Comparison
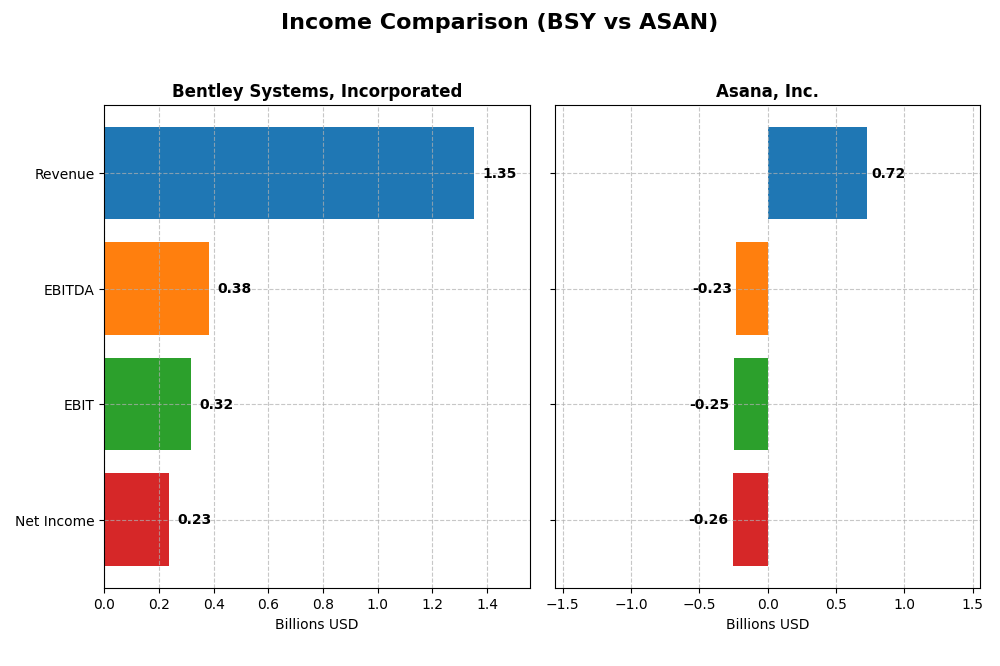
The following table presents the key income statement metrics for Bentley Systems, Incorporated and Asana, Inc. for their most recent fiscal years.
| Metric | Bentley Systems, Incorporated | Asana, Inc. |
|---|---|---|
| Market Cap | 11.4B | 2.6B |
| Revenue | 1.35B | 724M |
| EBITDA | 382M | -230M |
| EBIT | 318M | -247M |
| Net Income | 235M | -256M |
| EPS | 0.75 | -1.11 |
| Fiscal Year | 2024 | 2025 |
Income Statement Interpretations
Bentley Systems, Incorporated
Bentley Systems’ revenue rose steadily by 68.8% from 2020 to 2024, reaching $1.35B in 2024. Net income grew 85.6% over the same period, although it declined by 28% in the latest year to $235M. Gross and EBIT margins remained favorable at 81.0% and 23.5%. Despite higher operating expenses, EBIT surged 41.4% in 2024, indicating strong operational leverage.
Asana, Inc.
Asana’s revenue expanded rapidly, increasing 218.9% over 2021-2025 to $724M in 2025. However, net losses persisted, with a $256M deficit in 2025 despite a 10.4% improvement in net margin. Gross margin remained high at 89.3%, but EBIT margin stayed negative at -34.1%. Growth in operating expenses matched revenue growth, leading to modest EBIT improvement but continued net losses.
Which one has the stronger fundamentals?
Bentley Systems displays stronger fundamentals with consistent profitability, positive net margin of 17.4%, and robust EBIT growth, supported by stable gross margins. Asana shows impressive top-line growth but struggles with ongoing net losses and negative EBIT margins, reflecting higher risk. Both companies have favorable income statement evaluations, but Bentley’s profitability and margin stability suggest more established financial strength.
Financial Ratios Comparison
The table below presents key financial ratios for Bentley Systems, Incorporated (BSY) and Asana, Inc. (ASAN) for their most recent fiscal years, providing a snapshot of their financial health and market valuation.
| Ratios | Bentley Systems, Incorporated (BSY) | Asana, Inc. (ASAN) |
|---|---|---|
| ROE | 22.55% | -112.31% |
| ROIC | 9.30% | -53.03% |
| P/E | 62.63 | -19.16 |
| P/B | 14.13 | 21.52 |
| Current Ratio | 0.54 | 1.44 |
| Quick Ratio | 0.54 | 1.44 |
| D/E (Debt-to-Equity) | 1.37 | 1.18 |
| Debt-to-Assets | 42.0% | 30.1% |
| Interest Coverage | 12.20 | -72.42 |
| Asset Turnover | 0.40 | 0.81 |
| Fixed Asset Turnover | 20.47 | 2.76 |
| Payout Ratio | 30.72% | 0% |
| Dividend Yield | 0.49% | 0% |
Interpretation of the Ratios
Bentley Systems, Incorporated
Bentley Systems shows strengths in profitability with a favorable net margin of 17.35% and ROE at 22.55%, but faces concerns with liquidity as its current and quick ratios are both low at 0.54. Debt levels are somewhat high with a debt-to-equity ratio of 1.37. The dividend yield is modest at 0.49%, supported by steady dividend payments, but payout sustainability could be an area to monitor due to limited free cash flow to equity.
Asana, Inc.
Asana’s ratios reveal challenges including a negative net margin of -35.3% and deeply negative ROE at -112.31%, reflecting ongoing losses and operational inefficiencies. The company maintains a neutral to favorable liquidity profile with a current ratio of 1.44 and quick ratio also at 1.44. Asana does not pay dividends, consistent with its high-growth phase and reinvestment focus, prioritizing R&D and share buybacks instead.
Which one has the best ratios?
Both companies have a slightly unfavorable global ratios opinion, but Bentley displays stronger profitability and dividend returns, tempered by weaker liquidity and valuation metrics. Asana struggles with profitability and coverage ratios but maintains better liquidity and operational reinvestment capacity. Investors should weigh these contrasting financial profiles based on risk tolerance and investment horizon.
Strategic Positioning
This section compares the strategic positioning of Bentley Systems and Asana, focusing on market position, key segments, and exposure to technological disruption:
Bentley Systems, Incorporated
- Established market presence in infrastructure software with moderate competitive pressure.
- Focuses on infrastructure engineering software and project delivery systems serving engineers and planners globally.
- Exposure through software innovation in infrastructure simulation and project collaboration tools.
Asana, Inc.
- Emerging presence in work management software with competitive pressure in the tech sector.
- Provides a work management platform for teams across diverse industries including tech and healthcare.
- Faces technological disruption risks typical of software platforms in fast-evolving digital workflows.
Bentley Systems, Incorporated vs Asana, Inc. Positioning
Bentley Systems has a diversified infrastructure software portfolio targeting engineering professionals worldwide, while Asana concentrates on work management solutions for varied industries. Bentley’s broad segment coverage contrasts with Asana’s focused platform approach, each with distinct market reach and operational scale.
Which has the best competitive advantage?
Bentley Systems holds a slightly unfavorable moat with declining but positive value creation, whereas Asana’s moat is very unfavorable with significant value destruction and declining profitability, indicating Bentley currently maintains a stronger competitive advantage.
Stock Comparison
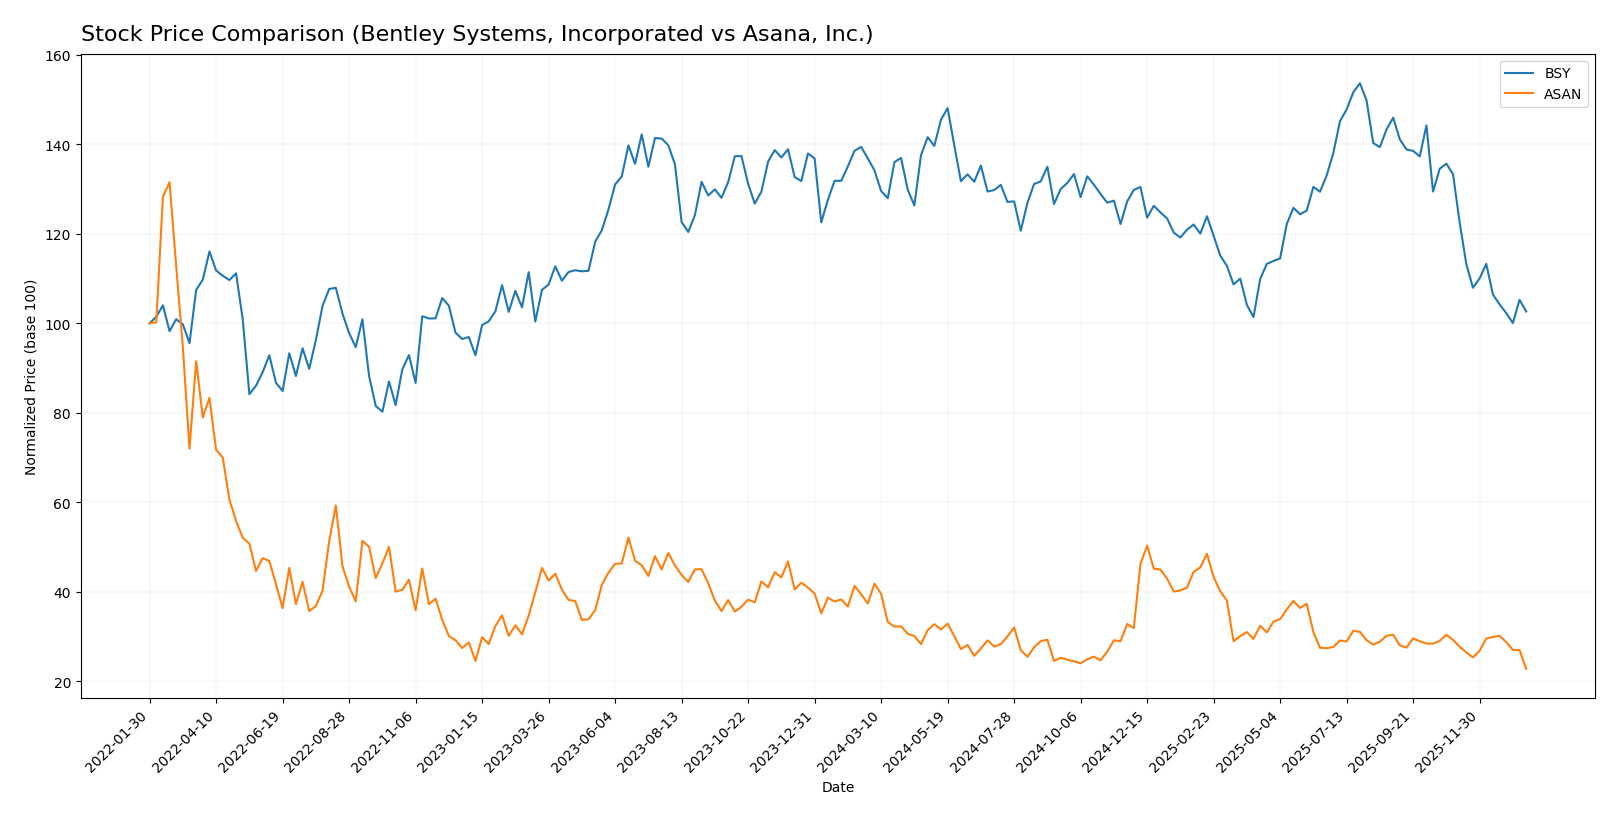
The stock price movements of Bentley Systems, Incorporated (BSY) and Asana, Inc. (ASAN) over the past 12 months reveal significant bearish trends with notable deceleration in losses and distinct trading volume dynamics.
Trend Analysis
Bentley Systems, Incorporated (BSY) experienced a 24.99% price decline over the past year, marking a bearish trend with deceleration. The stock showed a high of 58.59 and a low of 38.15, with overall volatility at 4.63%.
Asana, Inc. (ASAN) saw a steeper 39.07% drop in stock price over the same period, also bearish with deceleration. The price ranged between 24.15 and 10.93, with lower volatility at 2.87%.
Comparing both, BSY delivered the highest market performance despite both stocks declining. BSY’s smaller percentage loss indicates relatively stronger stability than ASAN within the analyzed timeframe.
Target Prices
Analysts provide a clear target price consensus for Bentley Systems and Asana, reflecting moderate upside potential.
| Company | Target High | Target Low | Consensus |
|---|---|---|---|
| Bentley Systems, Incorporated | 55 | 45 | 48.75 |
| Asana, Inc. | 18 | 14 | 15.75 |
The target consensus for Bentley Systems at 48.75 is notably above its current price of 39.14, suggesting expected growth. Similarly, Asana’s consensus target of 15.75 exceeds the current price of 10.93, indicating bullish analyst sentiment.
Analyst Opinions Comparison
This section compares analysts’ ratings and grades for Bentley Systems, Incorporated and Asana, Inc.:
Rating Comparison
Bentley Systems, Incorporated Rating
- Rating: B-, classified as Very Favorable by analysts.
- Discounted Cash Flow Score: 4, indicating a favorable valuation.
- ROE Score: 4, showing efficient profit generation from equity.
- ROA Score: 4, demonstrating effective use of assets for earnings.
- Debt To Equity Score: 1, a very unfavorable level of financial risk.
- Overall Score: 3, rated as moderate overall financial standing.
Asana, Inc. Rating
- Rating: D+, also classified as Very Favorable by analysts.
- Discounted Cash Flow Score: 1, indicating a very unfavorable valuation.
- ROE Score: 1, reflecting very unfavorable efficiency.
- ROA Score: 1, indicating very unfavorable asset utilization.
- Debt To Equity Score: 1, also very unfavorable financial risk.
- Overall Score: 1, rated very unfavorable overall financial standing.
Which one is the best rated?
Bentley Systems holds significantly higher scores in discounted cash flow, ROE, ROA, and overall financial standing compared to Asana, which scores very low across all metrics. Based strictly on the data, Bentley Systems is better rated.
Scores Comparison
Here is a comparison of the Altman Z-Score and Piotroski Score for Bentley Systems (BSY) and Asana (ASAN):
BSY Scores
- Altman Z-Score: 3.74, indicating a safe zone with low bankruptcy risk.
- Piotroski Score: 9, classified as very strong financial health.
ASAN Scores
- Altman Z-Score: -0.27, indicating distress zone with high bankruptcy risk.
- Piotroski Score: 4, classified as average financial health.
Which company has the best scores?
Bentley Systems shows significantly stronger financial stability with a safe Altman Z-Score and a very strong Piotroski Score. Asana’s scores indicate financial distress and average health, suggesting higher investment risk based on these metrics.
Grades Comparison
Here is the comparison of the latest reliable grades for Bentley Systems, Incorporated and Asana, Inc.:
Bentley Systems, Incorporated Grades
This table summarizes recent grades from reputable grading companies for Bentley Systems:
| Grading Company | Action | New Grade | Date |
|---|---|---|---|
| Piper Sandler | Downgrade | Neutral | 2026-01-13 |
| Barclays | Maintain | Equal Weight | 2026-01-12 |
| RBC Capital | Maintain | Outperform | 2026-01-05 |
| Baird | Maintain | Outperform | 2025-11-06 |
| Rosenblatt | Maintain | Buy | 2025-11-06 |
| Piper Sandler | Maintain | Overweight | 2025-11-06 |
| JP Morgan | Maintain | Neutral | 2025-11-06 |
| Rosenblatt | Upgrade | Buy | 2025-10-17 |
| Piper Sandler | Maintain | Overweight | 2025-08-07 |
| Goldman Sachs | Maintain | Sell | 2025-08-07 |
Bentley Systems shows a mostly positive grade trend with several Buy and Outperform ratings, though recent downgrades to Neutral indicate some caution.
Asana, Inc. Grades
This table summarizes recent grades from reputable grading companies for Asana, Inc.:
| Grading Company | Action | New Grade | Date |
|---|---|---|---|
| Citigroup | Upgrade | Buy | 2026-01-15 |
| RBC Capital | Maintain | Underperform | 2026-01-05 |
| Keybanc | Upgrade | Overweight | 2025-12-15 |
| DA Davidson | Maintain | Neutral | 2025-12-04 |
| Citigroup | Maintain | Neutral | 2025-12-03 |
| RBC Capital | Maintain | Underperform | 2025-12-03 |
| UBS | Maintain | Neutral | 2025-12-03 |
| Baird | Maintain | Neutral | 2025-09-04 |
| Morgan Stanley | Maintain | Underweight | 2025-09-04 |
| Piper Sandler | Maintain | Overweight | 2025-09-04 |
Asana’s grades are mixed, with several Neutral and Underperform ratings but also notable upgrades to Buy and Overweight.
Which company has the best grades?
Both companies have a consensus rating of Buy, but Bentley Systems has more consistent Outperform and Buy ratings, while Asana shows a wider range including Underperform grades. This suggests Bentley may be viewed as having a more stable outlook, which could influence investor confidence differently.
Strengths and Weaknesses
Below is a comparative overview of key strengths and weaknesses for Bentley Systems, Incorporated (BSY) and Asana, Inc. (ASAN) based on the most recent financial and operational data.
| Criterion | Bentley Systems, Incorporated (BSY) | Asana, Inc. (ASAN) |
|---|---|---|
| Diversification | Strong product mix with substantial subscription & license revenues (>$1.2B in 2024) and professional services | Limited diversification; primarily software services with no detailed revenue segmentation available |
| Profitability | Positive net margin (17.35%) and ROE (22.55%), but ROIC slightly above WACC with declining trend | Negative net margin (-35.3%) and ROE (-112.31%), with steeply declining ROIC; value destroying |
| Innovation | Moderate innovation indicated by strong fixed asset turnover (20.47) and established subscription models | Innovation challenged by negative profitability and negative interest coverage; struggling to convert R&D into profits |
| Global presence | Established global footprint via diversified subscription licenses and service offerings | Global presence less clear due to limited data; primarily cloud-based collaboration software |
| Market Share | Solid, with growing subscription revenues and enterprise license subscriptions | Market share growth uncertain; financial performance suggests challenges in scaling profitably |
Key takeaways: Bentley Systems shows a solid revenue base and profitability, though its ROIC is declining, indicating caution. Asana is facing significant profitability issues and value destruction, posing higher risk for investors despite potential in innovation and cloud services. Risk management suggests closer monitoring of both companies’ operational efficiency and profitability trends before committing.
Risk Analysis
Below is a comparative table of key risks for Bentley Systems, Incorporated (BSY) and Asana, Inc. (ASAN) based on the most recent data from 2025–2026.
| Metric | Bentley Systems, Incorporated (BSY) | Asana, Inc. (ASAN) |
|---|---|---|
| Market Risk | Moderate (Beta 1.21, tech sector) | Moderate (Beta 0.92, tech sector) |
| Debt level | High (Debt/Equity 1.37, 42% debt/assets) | High (Debt/Equity 1.18, 30% debt/assets) |
| Regulatory Risk | Low (US-based, stable sector) | Low (US-based, stable sector) |
| Operational Risk | Moderate (Complex infrastructure software) | Moderate (Cloud-based platform) |
| Environmental Risk | Low (Software company, minimal direct impact) | Low (Software company, minimal direct impact) |
| Geopolitical Risk | Moderate (Global operations) | Low (Primarily US & international markets) |
The most impactful and likely risks are Bentley’s high leverage and operational complexity in infrastructure software, posing financial and execution risks. Asana faces significant financial distress risk with negative profitability and a distress-zone Altman Z-score, signaling caution despite moderate debt and operational risks.
Which Stock to Choose?
Bentley Systems, Incorporated (BSY) shows favorable income evolution with strong revenue and net income growth over 2020-2024, supported by high gross and EBIT margins. Its profitability ratios like ROE at 22.55% are favorable, but debt levels and liquidity ratios remain unfavorable, reflected in a slightly unfavorable global financial ratios opinion and a very favorable B- rating.
Asana, Inc. (ASAN) demonstrates rapid revenue growth overall but suffers from persistent net losses and negative profitability ratios, including a -112.31% ROE and -35.3% net margin in 2025. Its financial ratios are mostly unfavorable with a very unfavorable rating of D+, and the company faces declining profitability and value destruction indicated by its moat evaluation.
Considering ratings and the global evaluation of income statements and financial ratios, BSY might appear more suitable for investors seeking quality and profitability, while ASAN could be interpreted as aligning with growth-focused investors tolerating higher risk due to its rapid revenue expansion but weak earnings and financial health.
Disclaimer: Investment carries a risk of loss of initial capital. The past performance is not a reliable indicator of future results. Be sure to understand risks before making an investment decision.
Go Further
I encourage you to read the complete analyses of Bentley Systems, Incorporated and Asana, Inc. to enhance your investment decisions: