In the dynamic world of software applications, Autodesk, Inc. and Asana, Inc. stand out as influential players shaping how professionals design and manage work. Autodesk excels in 3D design and engineering software, while Asana focuses on work management platforms for diverse teams. Both companies innovate within overlapping technology industries, making their comparison essential for investors seeking growth and stability. Let’s explore which stock offers the most compelling opportunity for your portfolio.

Table of contents
Companies Overview
I will begin the comparison between Autodesk and Asana by providing an overview of these two companies and their main differences.
Autodesk Overview
Autodesk, Inc. develops and provides 3D design, engineering, and entertainment software globally. Its offerings include AutoCAD Civil 3D, BIM 360, Fusion 360, and Maya, targeting professionals in architecture, engineering, construction, product design, manufacturing, and media industries. Headquartered in San Rafael, California, Autodesk supports complex design and manufacturing workflows through a broad software portfolio and reseller network.
Asana Overview
Asana, Inc. operates a work management platform that helps teams and executives coordinate tasks and strategic projects. Its software is used across various sectors such as technology, retail, healthcare, and government to manage workflows including product launches and marketing campaigns. Based in San Francisco, California, Asana focuses on enhancing organizational productivity through its cloud-based collaboration tools.
Key similarities and differences
Both Autodesk and Asana operate in the software application industry, providing cloud-based solutions that improve productivity for professionals and organizations. However, Autodesk specializes in 3D design and engineering software with an emphasis on creative and technical industries, while Asana focuses on work management and team collaboration across diverse service sectors. Their target customers and product scopes differ, reflecting distinct business models within the technology sector.
Income Statement Comparison
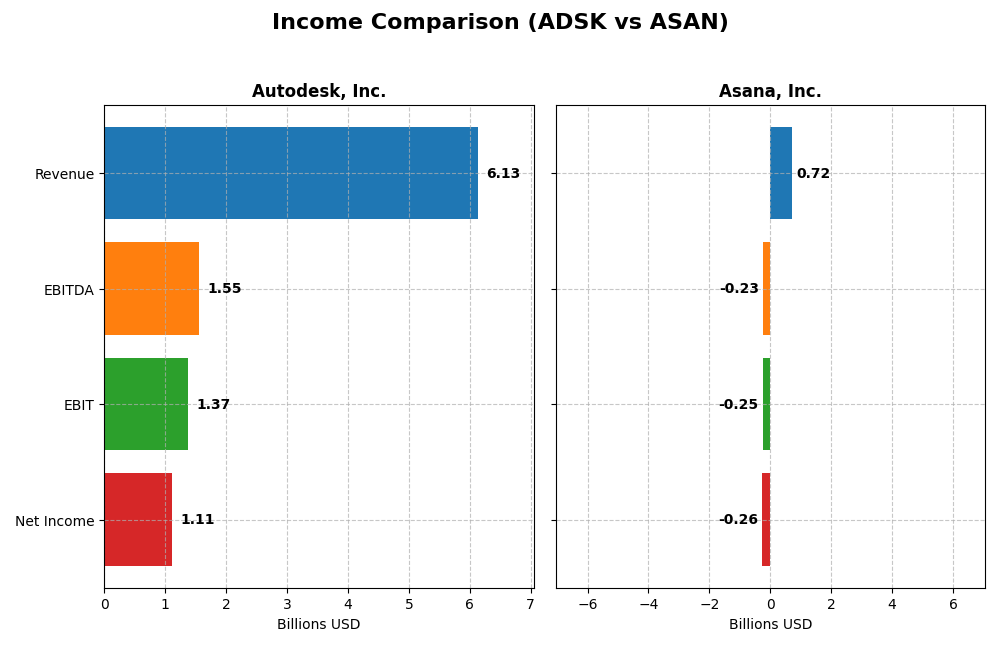
Below is a comparison of key income statement metrics for Autodesk, Inc. and Asana, Inc. based on their most recent fiscal year data.
| Metric | Autodesk, Inc. (ADSK) | Asana, Inc. (ASAN) |
|---|---|---|
| Market Cap | 56.6B | 2.6B |
| Revenue | 6.13B | 724M |
| EBITDA | 1.55B | -230M |
| EBIT | 1.37B | -247M |
| Net Income | 1.11B | -256M |
| EPS | 5.17 | -1.11 |
| Fiscal Year | 2025 | 2025 |
Income Statement Interpretations
Autodesk, Inc.
Autodesk’s revenue demonstrated a consistent upward trend from $3.79B in 2021 to $6.13B in 2025, with net income fluctuating but reaching $1.11B in 2025. Margins remained strong, with a gross margin of 90.57% and a net margin of 18.14% in 2025. The latest year showed favorable growth with revenue up 12.7% and net margin improving by 8.9%.
Asana, Inc.
Asana’s revenue grew substantially from $227M in 2021 to $724M in 2025, despite net losses persisting at -$256M in 2025. The gross margin stayed favorable at 89.34%, but EBIT and net margins remained negative, reflecting unprofitability. However, recent growth was positive with a 10.94% increase in revenue and a 10.38% improvement in net margin over the last year.
Which one has the stronger fundamentals?
Autodesk exhibits stronger fundamentals with high and stable margins, positive net income, and solid revenue growth over five years. Asana shows impressive revenue expansion but continues to face net losses and negative EBIT margins. Both companies have favorable income statement evaluations overall, though Autodesk’s profitability metrics are notably more robust.
Financial Ratios Comparison
The table below presents a side-by-side comparison of key financial ratios for Autodesk, Inc. (ADSK) and Asana, Inc. (ASAN) based on their most recent fiscal year data, illustrating their financial performance and stability.
| Ratios | Autodesk, Inc. (ADSK) | Asana, Inc. (ASAN) |
|---|---|---|
| ROE | 42.4% | -112.3% |
| ROIC | 18.0% | -53.0% |
| P/E | 60.2 | -19.2 |
| P/B | 25.5 | 21.5 |
| Current Ratio | 0.68 | 1.44 |
| Quick Ratio | 0.68 | 1.44 |
| D/E | 0.98 | 1.18 |
| Debt-to-Assets | 23.6% | 30.1% |
| Interest Coverage | 0 | -72.4 |
| Asset Turnover | 0.57 | 0.81 |
| Fixed Asset Turnover | 21.4 | 2.76 |
| Payout Ratio | 0 | 0 |
| Dividend Yield | 0% | 0% |
Interpretation of the Ratios
Autodesk, Inc.
Autodesk shows strong profitability with a net margin of 18.14%, a very high return on equity of 42.43%, and a solid return on invested capital at 18.01%. However, valuation metrics such as a PE ratio of 60.2 and a PB ratio of 25.54 are unfavorable, alongside a weak current ratio of 0.68, indicating liquidity concerns. The company pays no dividends, likely prioritizing reinvestment and growth.
Asana, Inc.
Asana’s financial ratios indicate weakness, with a negative net margin of -35.3%, a deeply negative ROE of -112.31%, and a poor ROIC at -53.03%. Liquidity appears adequate with a current ratio of 1.44 and a favorable quick ratio. The company does not pay dividends, reflecting its ongoing investment in growth and operational expansion amid losses and negative cash flow.
Which one has the best ratios?
Autodesk has a more favorable overall ratio profile, with strong profitability and return measures despite some valuation and liquidity weaknesses. Asana’s ratios reveal significant operational and profitability challenges, with many unfavorable indicators and negative returns. Overall, Autodesk’s financial ratios are more balanced and robust compared to Asana’s slightly unfavorable profile.
Strategic Positioning
This section compares the strategic positioning of Autodesk, Inc. and Asana, Inc. in terms of market position, key segments, and exposure to technological disruption:
Autodesk, Inc.
- Leading application software provider with strong competitive pressure in tech sector.
- Diverse segments: architecture, engineering, construction, manufacturing, media.
- Exposure to disruption mitigated by broad product portfolio and established market presence.
Asana, Inc.
- Smaller market cap with moderate competitive pressure in work management software.
- Focused on work management platform for various industries including tech and healthcare.
- Potentially exposed due to concentrated product focus and evolving work management technologies.
Autodesk vs Asana Positioning
Autodesk adopts a diversified approach across multiple industries, enhancing resilience and revenue streams but facing intense competition. Asana concentrates on work management, offering focused solutions but with higher risk from market fluctuations and disruption.
Which has the best competitive advantage?
Autodesk holds a very favorable moat with growing ROIC and value creation, indicating durable competitive advantage. Asana’s moat is very unfavorable with declining ROIC, reflecting value destruction and weaker competitive positioning.
Stock Comparison
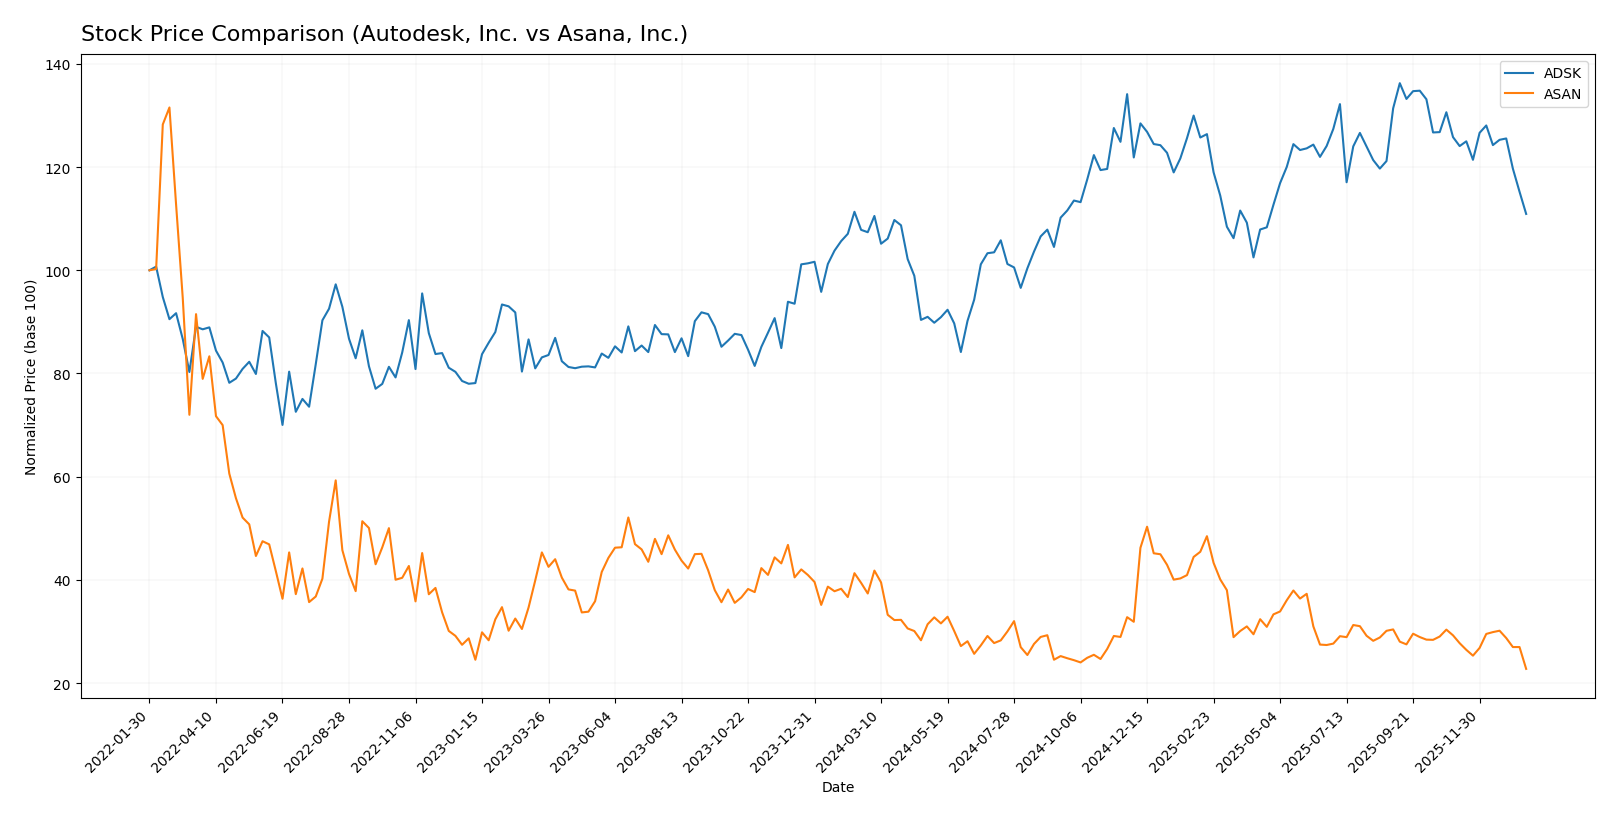
The stock price movements of Autodesk, Inc. (ADSK) and Asana, Inc. (ASAN) over the past 12 months reveal contrasting trading dynamics, with ADSK showing moderate gains amid decelerating momentum, while ASAN experiences a significant decline in value.
Trend Analysis
Autodesk, Inc. (ADSK) exhibited a 3.3% price increase over the past year, indicating a bullish trend with decelerating momentum. The stock ranged between 201.6 and 326.37, showing moderate volatility with a standard deviation of 29.87.
Asana, Inc. (ASAN) showed a 39.07% decline in stock price over the same period, reflecting a bearish trend with deceleration. The price fluctuated between 10.93 and 24.15, with lower volatility measured by a 2.87 standard deviation.
Comparing both stocks, Autodesk, Inc. delivered the highest market performance with a positive 3.3% gain, contrasting with Asana, Inc.’s substantial 39.07% loss over the past year.
Target Prices
The current analyst consensus projects promising upside potential for both Autodesk, Inc. and Asana, Inc.
| Company | Target High | Target Low | Consensus |
|---|---|---|---|
| Autodesk, Inc. | 400 | 343 | 373 |
| Asana, Inc. | 18 | 14 | 15.75 |
Autodesk’s target consensus of 373 significantly exceeds its current price near 266, indicating considerable growth expectations. Asana’s consensus target of 15.75 also suggests upside potential from its current price around 10.93, reflecting positive analyst sentiment.
Analyst Opinions Comparison
This section compares analysts’ ratings and grades for Autodesk, Inc. and Asana, Inc.:
Rating Comparison
Autodesk, Inc. Rating
- Rating: B-, classified as Very Favorable by analysts.
- Discounted Cash Flow Score: Moderate at 3 out of 5.
- ROE Score: Very Favorable with a high score of 5.
- ROA Score: Favorable, scoring 4 out of 5.
- Debt To Equity Score: Very Unfavorable, scoring only 1.
- Overall Score: Moderate at 3 out of 5.
Asana, Inc. Rating
- Rating: D+, also classified as Very Favorable.
- Discounted Cash Flow Score: Very Unfavorable at 1 out of 5.
- ROE Score: Very Unfavorable with a low score of 1.
- ROA Score: Very Unfavorable, with the lowest score of 1.
- Debt To Equity Score: Very Unfavorable, also scoring 1.
- Overall Score: Very Unfavorable at 1 out of 5.
Which one is the best rated?
Based strictly on the provided data, Autodesk, Inc. holds a better rating overall with a B- and higher scores in discounted cash flow, ROE, ROA, and overall score. Asana, Inc. shows consistently very unfavorable scores and a lower D+ rating.
Scores Comparison
Here is a comparison of the financial health scores for Autodesk, Inc. and Asana, Inc.:
Autodesk, Inc. Scores
- Altman Z-Score: 5.05, indicating a safe zone with low bankruptcy risk.
- Piotroski Score: 8, classified as very strong financial health.
Asana, Inc. Scores
- Altman Z-Score: -0.27, indicating distress zone with high bankruptcy risk.
- Piotroski Score: 4, indicating average financial strength.
Which company has the best scores?
Autodesk, Inc. demonstrates stronger financial stability with a safe zone Altman Z-Score and a very strong Piotroski Score, compared to Asana, Inc.’s distress zone and average Piotroski Score.
Grades Comparison
Here is a comparison of the recent grades and ratings from established grading companies for Autodesk, Inc. and Asana, Inc.:
Autodesk, Inc. Grades
The following table displays recent grades assigned by reputable grading companies for Autodesk, Inc.:
| Grading Company | Action | New Grade | Date |
|---|---|---|---|
| Barclays | Maintain | Overweight | 2025-11-26 |
| Wells Fargo | Maintain | Overweight | 2025-11-26 |
| Deutsche Bank | Upgrade | Buy | 2025-11-26 |
| B of A Securities | Maintain | Neutral | 2025-11-26 |
| Rosenblatt | Maintain | Buy | 2025-11-26 |
| Macquarie | Maintain | Outperform | 2025-11-26 |
| BMO Capital | Maintain | Market Perform | 2025-11-26 |
| Baird | Maintain | Outperform | 2025-11-26 |
| Rosenblatt | Maintain | Buy | 2025-11-24 |
| Baird | Maintain | Outperform | 2025-11-18 |
Autodesk shows a predominance of buy and outperform grades, with several upgrades and consistent maintenance of positive ratings.
Asana, Inc. Grades
The following table presents recent grades assigned by reputable grading companies for Asana, Inc.:
| Grading Company | Action | New Grade | Date |
|---|---|---|---|
| Citigroup | Upgrade | Buy | 2026-01-15 |
| RBC Capital | Maintain | Underperform | 2026-01-05 |
| Keybanc | Upgrade | Overweight | 2025-12-15 |
| DA Davidson | Maintain | Neutral | 2025-12-04 |
| Citigroup | Maintain | Neutral | 2025-12-03 |
| RBC Capital | Maintain | Underperform | 2025-12-03 |
| UBS | Maintain | Neutral | 2025-12-03 |
| Baird | Maintain | Neutral | 2025-09-04 |
| Morgan Stanley | Maintain | Underweight | 2025-09-04 |
| Piper Sandler | Maintain | Overweight | 2025-09-04 |
Asana’s ratings display a mix of neutral and underperform grades, with a few upgrades to buy and overweight, indicating a more cautious consensus.
Which company has the best grades?
Autodesk, Inc. has received more positive and consistent buy and outperform grades compared to Asana, Inc., which shows a wider range of neutral to underperform ratings alongside some upgrades. This disparity may influence investor perceptions of stability and growth potential between the two companies.
Strengths and Weaknesses
Below is a comparison table highlighting key strengths and weaknesses of Autodesk, Inc. (ADSK) and Asana, Inc. (ASAN) based on recent financial and strategic data:
| Criterion | Autodesk, Inc. (ADSK) | Asana, Inc. (ASAN) |
|---|---|---|
| Diversification | Highly diversified across Architecture, Manufacturing, Media, and AutoCAD product lines, with $2.9B revenue from Architecture and AEC in 2025 | Limited diversification; primarily focused on work management software |
| Profitability | Strong profitability: Net margin 18.14%, ROE 42.43%, ROIC 18.01% | Negative profitability: Net margin -35.3%, ROE -112.31%, ROIC -53.03% |
| Innovation | Demonstrates durable competitive advantage with growing ROIC (+15.4%) indicating successful innovation and value creation | Declining ROIC (-74%), value destruction, suggesting innovation challenges or execution issues |
| Global presence | Significant global footprint with broad industry reach and varied product portfolio | More limited international scale and market penetration |
| Market Share | Leading market positions in CAD and AEC software segments | Smaller market share in project management software, facing strong competition |
Key takeaways: Autodesk shows robust diversification, strong profitability, and sustained innovation delivering value and growth. In contrast, Asana struggles with profitability and value creation, indicating higher risk for investors seeking stable returns.
Risk Analysis
Below is a comparative table highlighting key risks for Autodesk, Inc. (ADSK) and Asana, Inc. (ASAN) based on the latest 2025 data:
| Metric | Autodesk, Inc. (ADSK) | Asana, Inc. (ASAN) |
|---|---|---|
| Market Risk | Moderate (Beta 1.47; tech sector volatility) | Lower (Beta 0.92; niche SaaS market) |
| Debt Level | Moderate (Debt/Equity 0.98; manageable) | Higher (Debt/Equity 1.18; elevated leverage) |
| Regulatory Risk | Moderate (global software regulations) | Moderate (data privacy and SaaS compliance) |
| Operational Risk | Moderate (complex product portfolio) | Higher (growth-stage challenges, negative margins) |
| Environmental Risk | Low (software firm with limited physical impact) | Low (primarily cloud-based services) |
| Geopolitical Risk | Moderate (US-based with international sales) | Moderate (US-based with growing global presence) |
The most impactful risks center on Asana’s financial distress, indicated by its Altman Z-Score in the distress zone and negative profitability metrics, posing a significant bankruptcy risk. Autodesk’s higher market beta and valuation multiples present market and price risks but remains financially stable with a strong Altman Z-Score and solid profitability. Investors should weigh Asana’s growth potential against its financial instability, while Autodesk offers a safer, albeit more expensive, investment profile.
Which Stock to Choose?
Autodesk, Inc. (ADSK) shows favorable income evolution with 12.7% revenue growth in 2025 and strong profitability metrics including an 18.14% net margin and a 42.43% ROE. Its debt levels are moderate with a net debt to EBITDA of 0.62, and the company holds a very favorable overall rating of B-.
Asana, Inc. (ASAN) reports positive revenue growth of 10.94% in 2025 but suffers from negative profitability, with a -35.3% net margin and a -112.31% ROE. Its debt to equity ratio is higher than ADSK’s, and the overall rating is very unfavorable at D+, reflecting financial challenges and value destruction.
From a ratings and financial perspective, ADSK could appear more favorable for investors seeking quality and value creation due to its strong profitability and rating. Conversely, ASAN might be more suited to investors with a high risk tolerance who focus on growth potential despite current profitability issues.
Disclaimer: Investment carries a risk of loss of initial capital. The past performance is not a reliable indicator of future results. Be sure to understand risks before making an investment decision.
Go Further
I encourage you to read the complete analyses of Autodesk, Inc. and Asana, Inc. to enhance your investment decisions: