In the fast-evolving software application industry, Atlassian Corporation and Asana, Inc. stand out as key players driving innovation in work and project management solutions. Both companies offer platforms that enhance team collaboration and productivity, targeting overlapping markets with distinct approaches. This comparative analysis will explore their strengths and risks to help you decide which company presents the most compelling investment opportunity today.
Table of contents
Companies Overview
I will begin the comparison between Atlassian Corporation and Asana, Inc. by providing an overview of these two companies and their main differences.
Atlassian Corporation Overview
Atlassian Corporation, headquartered in Sydney, Australia, develops and licenses software products designed to improve team collaboration and project management. Its portfolio includes Jira, Confluence, Trello, and other tools that connect technical and business teams to organize, track, and manage work efficiently. The company focuses on enterprise agility, software development, and service management solutions, serving a global technology market.
Asana, Inc. Overview
Asana, Inc., based in San Francisco, California, operates a work management platform aimed at individuals, team leads, and executives. Its software helps organize daily tasks and strategic initiatives across various industries such as technology, retail, healthcare, and finance. Asana emphasizes orchestration of work from task management to organization-wide goal setting, targeting a broad user base with a focus on workflow coordination.
Key similarities and differences
Both Atlassian and Asana operate in the software application industry, providing platforms that enhance team productivity and project management. While Atlassian offers a broader suite of products targeting enterprise agility and technical collaboration, Asana focuses more on work orchestration for diverse sectors with a simpler task management approach. Atlassian’s larger scale and extensive product portfolio contrast with Asana’s more streamlined platform and smaller workforce.
Income Statement Comparison
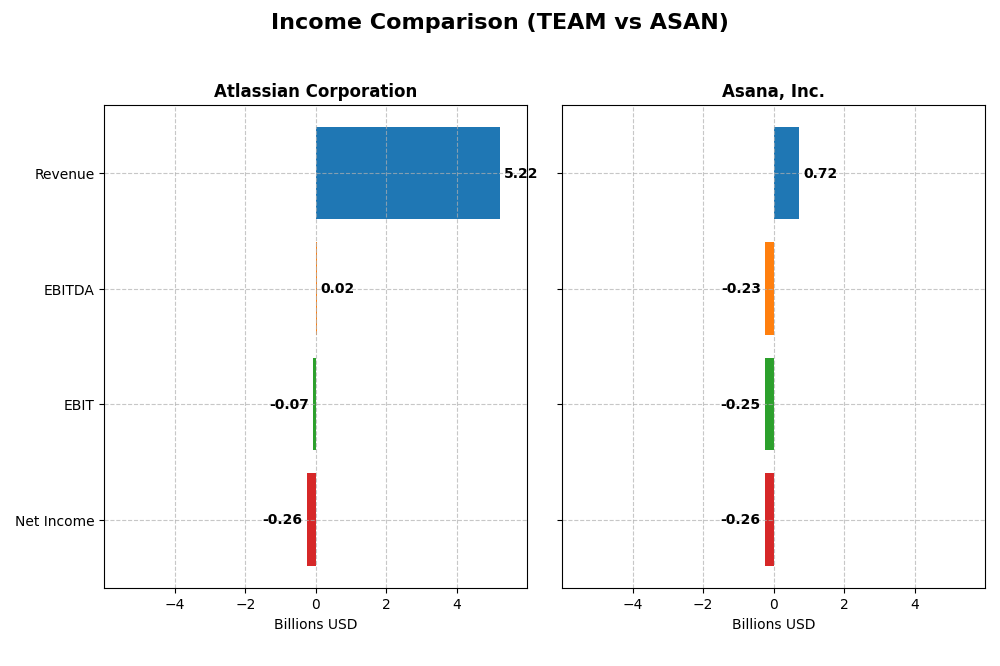
The following table presents a side-by-side comparison of key income statement metrics for Atlassian Corporation and Asana, Inc. for their most recent fiscal year.
| Metric | Atlassian Corporation | Asana, Inc. |
|---|---|---|
| Market Cap | 31.1B | 2.6B |
| Revenue | 5.22B | 724M |
| EBITDA | 24.0M | -230M |
| EBIT | -68.3M | -247M |
| Net Income | -257M | -256M |
| EPS | -0.98 | -1.11 |
| Fiscal Year | 2025 | 2025 |
Income Statement Interpretations
Atlassian Corporation
Atlassian’s revenue rose significantly from $2.1B in 2021 to $5.2B in 2025, with net income losses narrowing from -$579M to -$257M. Gross margins remained strong and favorable at 82.8%, but EBIT margin stayed negative at -1.3%. The latest year showed solid revenue growth of 19.7%, improved net margin, yet EBIT declined by 33.1%, indicating mixed operational efficiency.
Asana, Inc.
Asana’s revenue increased from $227M in 2021 to $724M in 2025, but net losses remained substantial, improving slightly from -$212M to -$256M. Gross margin was high at 89.3%, though EBIT margin was deeply negative at -34.1%. The last year saw a 10.9% revenue gain, stable EBIT, and a modest net margin improvement, reflecting steady but challenging profitability progress.
Which one has the stronger fundamentals?
Both companies exhibit favorable global income statement evaluations with 71.4% favorable metrics. Atlassian shows stronger overall revenue and net income growth, with improving margins despite negative EBIT. Asana has higher gross margins but more significant net losses and less net income growth. Atlassian’s fundamentals appear more robust due to larger scale and better margin improvements.
Financial Ratios Comparison
The table below presents the most recent financial ratios for Atlassian Corporation and Asana, Inc., providing a snapshot of their profitability, liquidity, leverage, efficiency, and dividend metrics as of their latest fiscal years.
| Ratios | Atlassian Corporation (2025) | Asana, Inc. (2025) |
|---|---|---|
| ROE | -19.1% | -112.3% |
| ROIC | -4.48% | -53.0% |
| P/E | -207.1 | -19.2 |
| P/B | 39.5 | 21.5 |
| Current Ratio | 1.22 | 1.44 |
| Quick Ratio | 1.22 | 1.44 |
| D/E (Debt-to-Equity) | 0.92 | 1.18 |
| Debt-to-Assets | 20.5% | 30.1% |
| Interest Coverage | -4.27 | -72.4 |
| Asset Turnover | 0.86 | 0.81 |
| Fixed Asset Turnover | 19.0 | 2.76 |
| Payout Ratio | 0 | 0 |
| Dividend Yield | 0% | 0% |
Interpretation of the Ratios
Atlassian Corporation
Atlassian’s financial ratios present a mixed picture with several unfavorable metrics, including a negative net margin (-4.92%) and return on equity (-19.08%), indicating profitability challenges. However, favorable aspects such as a low debt-to-assets ratio (20.51%) and a strong quick ratio (1.22) suggest reasonable liquidity and moderate leverage. The company does not pay dividends, reflecting a reinvestment strategy aligned with its growth ambitions.
Asana, Inc.
Asana exhibits several weak financial ratios, including a deeply negative net margin (-35.3%) and return on equity (-112.31%), signaling significant losses and inefficiencies. While the low weighted average cost of capital (7.73%) is favorable, high debt-to-equity (1.18) and poor interest coverage ratios raise concerns about financial risk. Asana also does not distribute dividends, likely prioritizing reinvestment and development during its growth phase.
Which one has the best ratios?
Both Atlassian and Asana show slightly unfavorable overall ratio evaluations, but Atlassian has a higher proportion of favorable ratios (35.71% vs. 21.43%) and better leverage metrics. Despite this, both companies face profitability and coverage challenges, making their financial health comparably cautious for investors to consider.
Strategic Positioning
This section compares the strategic positioning of Atlassian Corporation and Asana, Inc., including Market position, Key segments, and exposure to technological disruption:
Atlassian Corporation
- Large market cap of 31B with diversified software products, facing moderate competitive pressure in software sector.
- Key segments include project management, collaboration, developer tools, and security software driving revenues.
- Exposure to disruption through continuous innovation in cloud collaboration and enterprise software solutions.
Asana, Inc.
- Smaller market cap of 2.6B, focused on work management platform, facing competitive pressure.
- Focused on work orchestration across industries like tech, retail, and healthcare.
- Exposure to disruption tied to evolving work management needs and cross-industry platform adoption.
Atlassian Corporation vs Asana, Inc. Positioning
Atlassian’s diversified product portfolio spans multiple software categories, offering broader business drivers. Asana concentrates on its core work management platform, targeting a wide range of industries but with fewer product lines. Atlassian’s scale provides scope advantages, while Asana’s focus may limit diversification.
Which has the best competitive advantage?
Both companies have very unfavorable MOAT evaluations with declining ROIC trends and value destruction. Atlassian shows a smaller negative gap between ROIC and WACC, indicating marginally less severe value erosion than Asana.
Stock Comparison
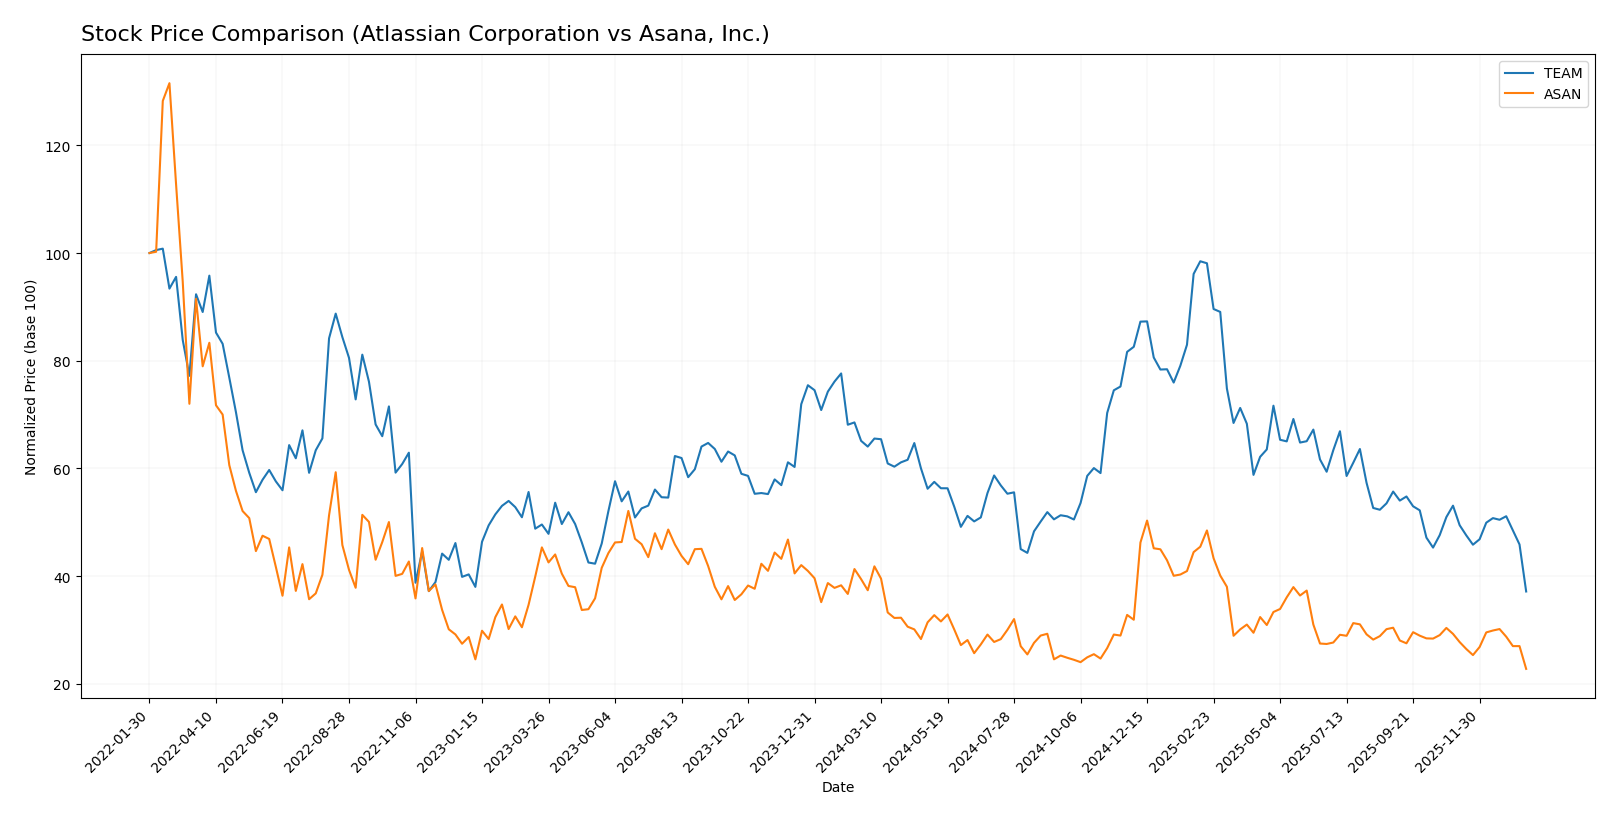
The stock price movements of Atlassian Corporation (TEAM) and Asana, Inc. (ASAN) over the past twelve months reveal pronounced bearish trends with notable deceleration and differing volatility levels.
Trend Analysis
Atlassian Corporation’s stock declined by 42.01% over the past year, indicating a bearish trend with decelerating losses. The price ranged between 314.28 and 118.55, showing high volatility with a standard deviation of 41.22.
Asana, Inc. experienced a 39.07% price decrease over the same period, also reflecting a bearish trend and deceleration. Its price fluctuated between 24.15 and 10.93 with notably lower volatility, evidenced by a standard deviation of 2.87.
Comparing both, Atlassian’s stock showed a slightly larger decline than Asana’s over the last year, delivering the lower market performance among the two companies.
Target Prices
The target price consensus from recognized analysts for these companies shows a positive outlook.
| Company | Target High | Target Low | Consensus |
|---|---|---|---|
| Atlassian Corporation | 290 | 185 | 234.14 |
| Asana, Inc. | 18 | 14 | 15.75 |
Analysts expect Atlassian Corporation’s stock to appreciate significantly from its current price of 118.55 USD, while Asana, Inc.’s consensus target also suggests a substantial upside from the current 10.93 USD.
Analyst Opinions Comparison
This section compares analysts’ ratings and scores for Atlassian Corporation and Asana, Inc.:
Rating Comparison
Atlassian Corporation Rating
- Rating: C, evaluated as Very Favorable by analysts.
- Discounted Cash Flow Score: 5, indicating a Very Favorable DCF outlook.
- ROE Score: 1, marked as Very Unfavorable for return on equity.
- ROA Score: 1, considered Very Unfavorable for asset returns.
- Debt To Equity Score: 1, rated Very Unfavorable for financial risk.
- Overall Score: 2, classified as Moderate overall financial standing.
Asana, Inc. Rating
- Rating: D+, also evaluated as Very Favorable.
- Discounted Cash Flow Score: 1, reflecting a Very Unfavorable DCF outlook.
- ROE Score: 1, also Very Unfavorable for return on equity.
- ROA Score: 1, similarly Very Unfavorable for asset returns.
- Debt To Equity Score: 1, equally Very Unfavorable for financial risk.
- Overall Score: 1, classified as Very Unfavorable overall.
Which one is the best rated?
Atlassian Corporation holds a stronger position with a higher overall score of 2 (Moderate) compared to Asana’s 1 (Very Unfavorable). Atlassian notably outperforms Asana in discounted cash flow, indicating a more favorable valuation outlook.
Scores Comparison
Here is a comparison of the Altman Z-Score and Piotroski Score for Atlassian Corporation and Asana, Inc.:
Atlassian Scores
- Altman Z-Score: 4.70, indicating a safe zone from bankruptcy risk.
- Piotroski Score: 5, classified as average financial strength.
Asana Scores
- Altman Z-Score: -0.27, indicating a distress zone with high bankruptcy risk.
- Piotroski Score: 4, also classified as average financial strength.
Which company has the best scores?
Atlassian shows a significantly stronger Altman Z-Score, placing it in the safe zone, while Asana falls in the distress zone. Both companies have similar average Piotroski Scores, but Atlassian’s overall financial stability appears stronger based on these scores.
Grades Comparison
The following is a comparison of recent reliable grades for Atlassian Corporation and Asana, Inc.:
Atlassian Corporation Grades
Below is a summary table of recent grades provided by reputable grading companies for Atlassian Corporation:
| Grading Company | Action | New Grade | Date |
|---|---|---|---|
| BTIG | Maintain | Buy | 2026-01-13 |
| Piper Sandler | Maintain | Overweight | 2026-01-05 |
| Bernstein | Maintain | Outperform | 2025-11-18 |
| Macquarie | Maintain | Outperform | 2025-11-03 |
| Mizuho | Maintain | Outperform | 2025-10-31 |
| Bernstein | Maintain | Outperform | 2025-10-31 |
| TD Cowen | Maintain | Hold | 2025-10-27 |
| BMO Capital | Maintain | Outperform | 2025-10-24 |
| UBS | Maintain | Neutral | 2025-10-24 |
| Keybanc | Maintain | Overweight | 2025-10-23 |
Atlassian’s grades consistently lean towards positive ratings, with multiple “Outperform” and “Buy” assessments and no downgrades.
Asana, Inc. Grades
Below is a summary table of recent grades provided by reputable grading companies for Asana, Inc.:
| Grading Company | Action | New Grade | Date |
|---|---|---|---|
| Citigroup | Upgrade | Buy | 2026-01-15 |
| RBC Capital | Maintain | Underperform | 2026-01-05 |
| Keybanc | Upgrade | Overweight | 2025-12-15 |
| DA Davidson | Maintain | Neutral | 2025-12-04 |
| Citigroup | Maintain | Neutral | 2025-12-03 |
| RBC Capital | Maintain | Underperform | 2025-12-03 |
| UBS | Maintain | Neutral | 2025-12-03 |
| Baird | Maintain | Neutral | 2025-09-04 |
| Morgan Stanley | Maintain | Underweight | 2025-09-04 |
| Piper Sandler | Maintain | Overweight | 2025-09-04 |
Asana’s grades display a range of ratings from “Buy” to “Underperform,” indicating mixed analyst opinions and some recent upgrades.
Which company has the best grades?
Atlassian Corporation has received more consistently positive grades such as “Buy” and “Outperform,” while Asana, Inc. shows a more varied rating profile with notable underperform and neutral grades. This disparity may influence investors’ perception of risk and potential upside differently for each company.
Strengths and Weaknesses
Below is a comparative overview of Atlassian Corporation (TEAM) and Asana, Inc. (ASAN) based on their most recent financial and operational data.
| Criterion | Atlassian Corporation (TEAM) | Asana, Inc. (ASAN) |
|---|---|---|
| Diversification | Moderate product and service mix with strong License and Service revenue (~4.93B USD in 2025) | Limited diversification; focused primarily on project management software |
| Profitability | Negative net margin (-4.92%) and ROIC (-4.48%), company shedding value | More severe losses with net margin at -35.3% and ROIC at -53.03%, value destruction |
| Innovation | High fixed asset turnover (19.02) indicating efficient asset use | Lower fixed asset turnover (2.76), less efficient asset utilization |
| Global presence | Established global footprint with diverse customer base | Growing presence but smaller scale compared to TEAM |
| Market Share | Strong position in collaboration software market | Smaller market share, still gaining traction |
Key takeaways: Both companies are currently unprofitable with declining returns on invested capital. Atlassian shows better asset efficiency and a more diversified revenue base, while Asana faces greater challenges in profitability and leverage. Caution is advised when considering investments in these firms given their ongoing value destruction.
Risk Analysis
Below is a comparative table highlighting key risk factors for Atlassian Corporation (TEAM) and Asana, Inc. (ASAN) based on the most recent 2025 data.
| Metric | Atlassian Corporation (TEAM) | Asana, Inc. (ASAN) |
|---|---|---|
| Market Risk | Beta 0.89, moderate volatility | Beta 0.92, moderate volatility |
| Debt level | Debt-to-Equity 0.92 (neutral) | Debt-to-Equity 1.18 (unfavorable) |
| Regulatory Risk | Moderate, software industry regulation | Moderate, software industry regulation |
| Operational Risk | Moderate, product diversification | Higher, smaller scale and growth challenges |
| Environmental Risk | Low, mainly digital products | Low, mainly digital products |
| Geopolitical Risk | Exposure due to Australian HQ, global operations | US-based, global exposure moderate |
The most impactful risks include Asana’s higher debt load and weaker profitability, increasing financial distress risk, reflected by its Altman Z-Score in the distress zone. Atlassian presents moderate market risk but maintains a safer financial profile with a strong Altman Z-Score, despite some operational margin pressures. Investors should monitor Asana’s debt and cash flow closely, while Atlassian’s risks are more related to market dynamics and operational execution.
Which Stock to Choose?
Atlassian Corporation (TEAM) shows favorable income growth with a 19.66% revenue increase in 2025 and a strong gross margin of 82.84%. However, profitability ratios like net margin (-4.92%) and ROE (-19.08%) remain unfavorable. The company carries moderate debt with a net debt to EBITDA ratio of -53 and holds a slightly unfavorable global financial ratio profile. TEAM’s rating is very favorable despite some weaknesses, supported by a safe zone Altman Z-Score of 4.7 and average Piotroski score of 5.
Asana, Inc. (ASAN) reports solid revenue growth of 10.94% and a higher gross margin of 89.34%, but suffers from poor profitability metrics such as a net margin of -35.3% and ROE of -112.31%. Its financial ratios are more unfavorable than TEAM’s, with a higher debt-to-equity ratio and a distress zone Altman Z-Score below zero. ASAN’s rating remains very favorable but shows very unfavorable scores overall, reflecting ongoing challenges in financial stability and profitability.
Investors seeking growth with better income statement trends and a stronger credit profile might find Atlassian more appealing, given its safer financial scores and moderate debt. Conversely, those with higher risk tolerance focused on aggressive growth could consider Asana’s higher revenue growth potential despite its financial fragility. Both companies display declining ROIC and value destruction, suggesting caution for value-oriented or risk-averse profiles.
Disclaimer: Investment carries a risk of loss of initial capital. The past performance is not a reliable indicator of future results. Be sure to understand risks before making an investment decision.
Go Further
I encourage you to read the complete analyses of Atlassian Corporation and Asana, Inc. to enhance your investment decisions: