Home > Comparison > Financial Services > AJG vs WTW
The strategic rivalry between Arthur J. Gallagher & Co. and Willis Towers Watson defines the trajectory of the global insurance brokerage sector. Arthur J. Gallagher operates as a capital-intensive brokerage and risk management firm with extensive global reach. In contrast, Willis Towers Watson focuses on advisory and consulting services with a technology-driven approach. This analysis will assess which business model offers a superior risk-adjusted return for a diversified portfolio in financial services.
Table of contents
Companies Overview
Arthur J. Gallagher & Co. and Willis Towers Watson dominate global insurance brokerage and advisory markets with distinct strategic approaches.
Arthur J. Gallagher & Co.: Global Insurance Brokerage Leader
Arthur J. Gallagher & Co. focuses on insurance brokerage and risk management. It generates revenue by placing specialized insurance and offering consulting and claims settlement services. In 2026, it prioritizes expanding brokerage wholesaling and risk consulting across multiple international markets, reinforcing its competitive network of correspondent brokers.
Willis Towers Watson Public Limited Company: Advisory and Broking Powerhouse
Willis Towers Watson operates as a leading insurance broker and advisory firm. Its revenue stems from health, wealth, career consulting, and risk broking services worldwide. In 2026, it concentrates on integrating actuarial, benefits outsourcing, and investment consulting to enhance client total rewards and risk management solutions with a technology-driven focus.
Strategic Collision: Similarities & Divergences
Both firms excel in insurance brokerage, yet Arthur J. Gallagher emphasizes wholesale distribution and risk management services, while Willis Towers Watson blends consulting with benefits and investment advisory. Their primary battleground lies in capturing global commercial and employee benefits markets. Investors face contrasting profiles: Gallagher’s broad brokerage network versus Willis Towers Watson’s integrated advisory model.
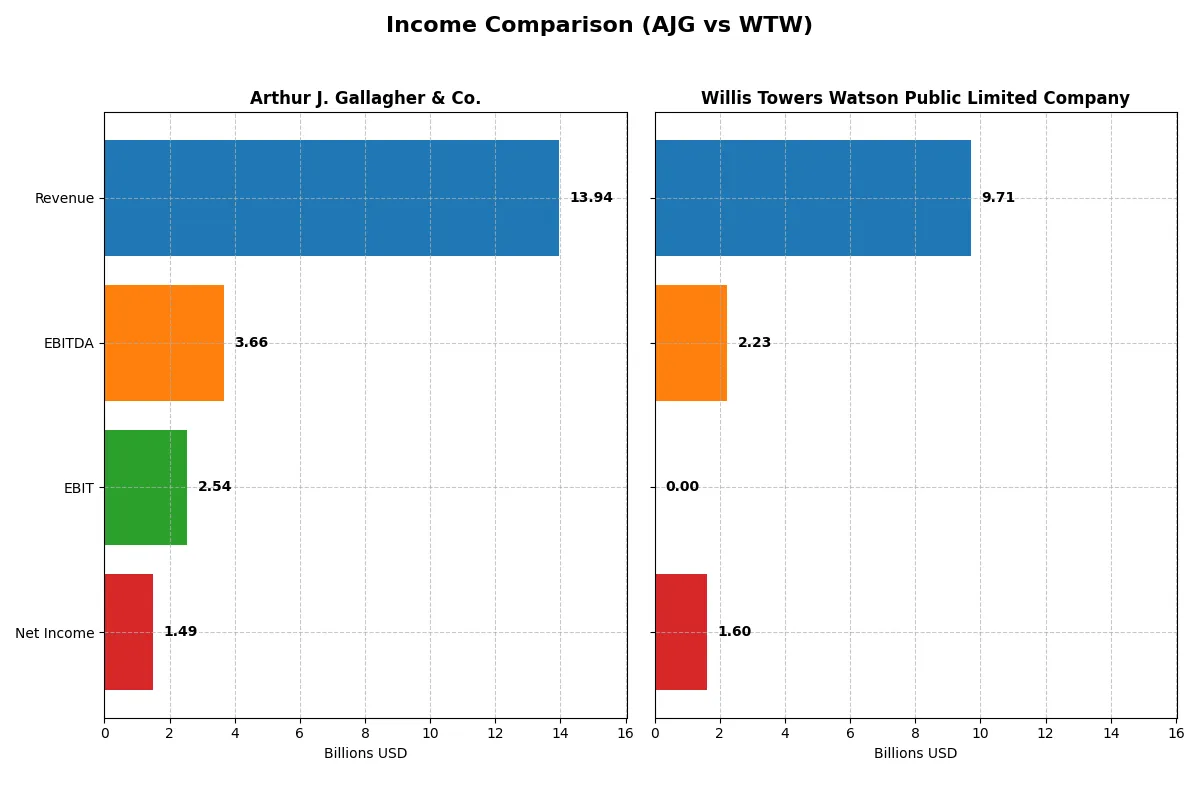
Income Statement Comparison
This data dissects the core profitability and scalability of both corporate engines to reveal who dominates the bottom line:
| Metric | Arthur J. Gallagher & Co. (AJG) | Willis Towers Watson (WTW) |
|---|---|---|
| Revenue | 13.94B | 9.71B |
| Cost of Revenue | 6.31B | 0 |
| Operating Expenses | 5.08B | 0 |
| Gross Profit | 7.63B | 0 |
| EBITDA | 3.66B | 2.23B |
| EBIT | 2.54B | 0 |
| Interest Expense | 639M | -260M |
| Net Income | 1.49B | 1.61B |
| EPS | 5.83 | 16.34 |
| Fiscal Year | 2025 | 2025 |
Income Statement Analysis: The Bottom-Line Duel
This income statement comparison reveals the true efficiency and profit generation strength of Arthur J. Gallagher & Co. versus Willis Towers Watson.
Arthur J. Gallagher & Co. Analysis
Arthur J. Gallagher & Co. shows robust revenue growth, reaching $13.9B in 2025, up 20.7% year-over-year. Net income climbs steadily to $1.49B with a solid net margin of 10.7%, reflecting strong operational discipline. Gross margin remains healthy at 54.8%, while EBIT margin of 18.2% confirms efficient cost control and positive momentum in profitability.
Willis Towers Watson Analysis
Willis Towers Watson reports $9.7B revenue in 2025, slightly down from prior years, with volatile gross profit data. Despite a net income rebound to $1.6B and a strong net margin of 16.5%, the absence of reported gross and EBIT margins signals irregular cost structures. The sharp EPS surge contrasts with underlying revenue declines, suggesting profit gains from non-operational factors rather than core business growth.
Margin Reliability vs. Earnings Volatility
Arthur J. Gallagher & Co. outperforms with consistent revenue expansion and margin stability, confirming a solid earnings engine. Willis Towers Watson’s higher net margin reflects episodic gains, not sustained operational efficiency. For investors, Gallagher’s steady margin reliability offers a clearer picture of durable profitability over Willis Towers Watson’s volatile earnings profile.
Financial Ratios Comparison
These vital ratios act as a diagnostic tool to expose the underlying fiscal health, valuation premiums, and capital efficiency of the companies compared:
| Ratios | Arthur J. Gallagher & Co. (AJG) | Willis Towers Watson (WTW) |
|---|---|---|
| ROE | 7.26% (2024) | -1.23% (2024) |
| ROIC | 5.05% (2024) | -3.49% (2024) |
| P/E | 42.8x (2024) | 20.1x (2025) |
| P/B | 3.11x (2024) | 4.02x (2024) |
| Current Ratio | 1.51 (2024) | 1.20 (2024) |
| Quick Ratio | 1.51 (2024) | 1.20 (2024) |
| D/E | 0.67 (2024) | 0.75 (2024) |
| Debt-to-Assets | 21.0% (2024) | 21.4% (2024) |
| Interest Coverage | 5.99x (2024) | 2.38x (2024) |
| Asset Turnover | 0.18 (2024) | 0.36 (2024) |
| Fixed Asset Turnover | 11.2x (2024) | 8.66x (2024) |
| Payout ratio | 36.0% (2024) | -361.2% (2024) |
| Dividend yield | 0.84% (2024) | 1.11% (2024) |
| Fiscal Year | 2025 | 2025 |
Efficiency & Valuation Duel: The Vital Signs
Ratios serve as a company’s financial DNA, exposing hidden risks and revealing operational strengths or weaknesses beneath surface numbers.
Arthur J. Gallagher & Co. (AJG)
AJG shows a solid net margin of 10.72%, but its return on equity and invested capital register unfavorably at zero. The stock trades at a stretched P/E of 45.1, suggesting high valuation. Dividend yield is modest at 1.0%, balancing shareholder returns amid limited reinvestment signals.
Willis Towers Watson Public Limited Company (WTW)
WTW delivers a favorable net margin of 16.53%, outperforming AJG on profitability, while ROE and ROIC remain unfavorable at zero. Its P/E ratio stands at a neutral 20.06, indicating more reasonable valuation. Dividend yield slightly exceeds AJG’s at 1.11%, reflecting steady shareholder income.
Valuation Stretch vs. Profitability Edge
Both companies face slightly unfavorable ratio profiles, yet WTW’s stronger net margin and lower P/E suggest a better risk-reward balance. AJG’s high valuation demands cautious scrutiny. Investors prioritizing profitability and valuation discipline may find WTW’s profile more aligned with their goals.
Which one offers the Superior Shareholder Reward?
Arthur J. Gallagher (AJG) maintains a modest 1.0% dividend yield with a steady 45% payout ratio, balancing income with sustainable reinvestment. Willis Towers Watson (WTW) offers a slightly higher 1.1% yield but a lower payout around 22%, signaling aggressive buybacks and growth focus. AJG’s consistent dividend and moderate payout ratio suggest a safer, sustainable model. WTW’s larger free cash flow per share ($18 vs. AJG’s $11) funds robust buybacks, enhancing total return but with higher leverage risk. Given WTW’s superior free cash flow and buyback intensity, I find WTW’s shareholder reward more attractive for total return in 2026, albeit with increased risk compared to AJG’s conservative distribution approach.
Comparative Score Analysis: The Strategic Profile
The radar chart reveals the fundamental DNA and trade-offs of Arthur J. Gallagher & Co. and Willis Towers Watson Public Limited Company:
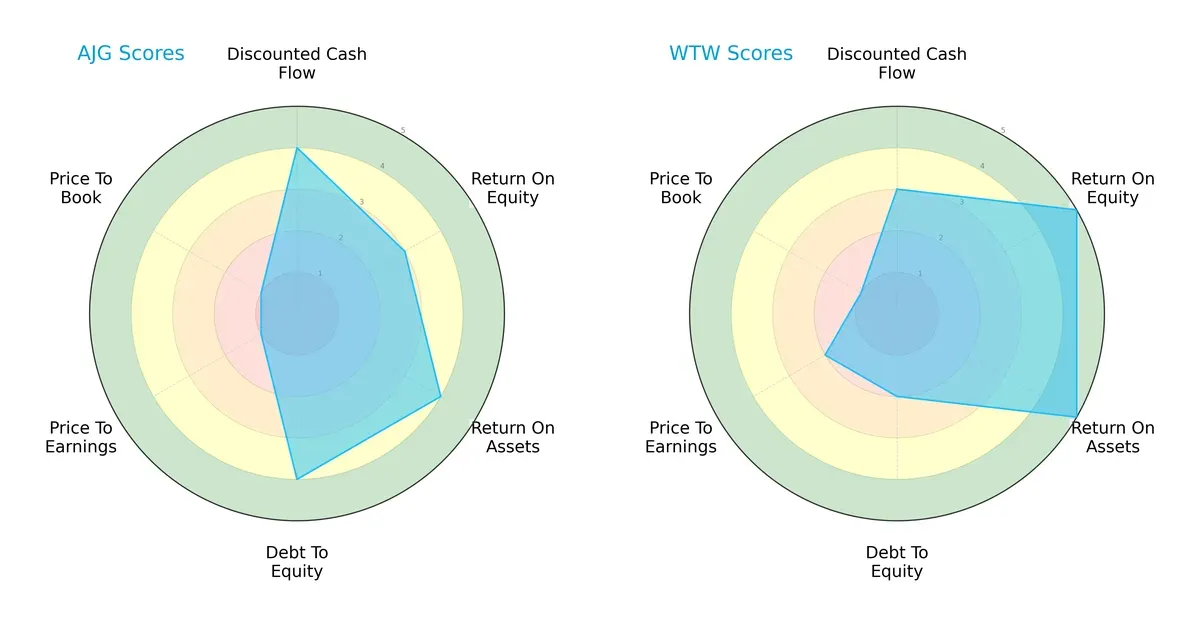
Arthur J. Gallagher & Co. shows strength in discounted cash flow, asset returns, and low leverage. Willis Towers Watson excels in equity and asset returns but carries higher debt. Gallagher presents a more balanced risk-return profile, while Willis Towers Watson leans on operational efficiency and profitability.
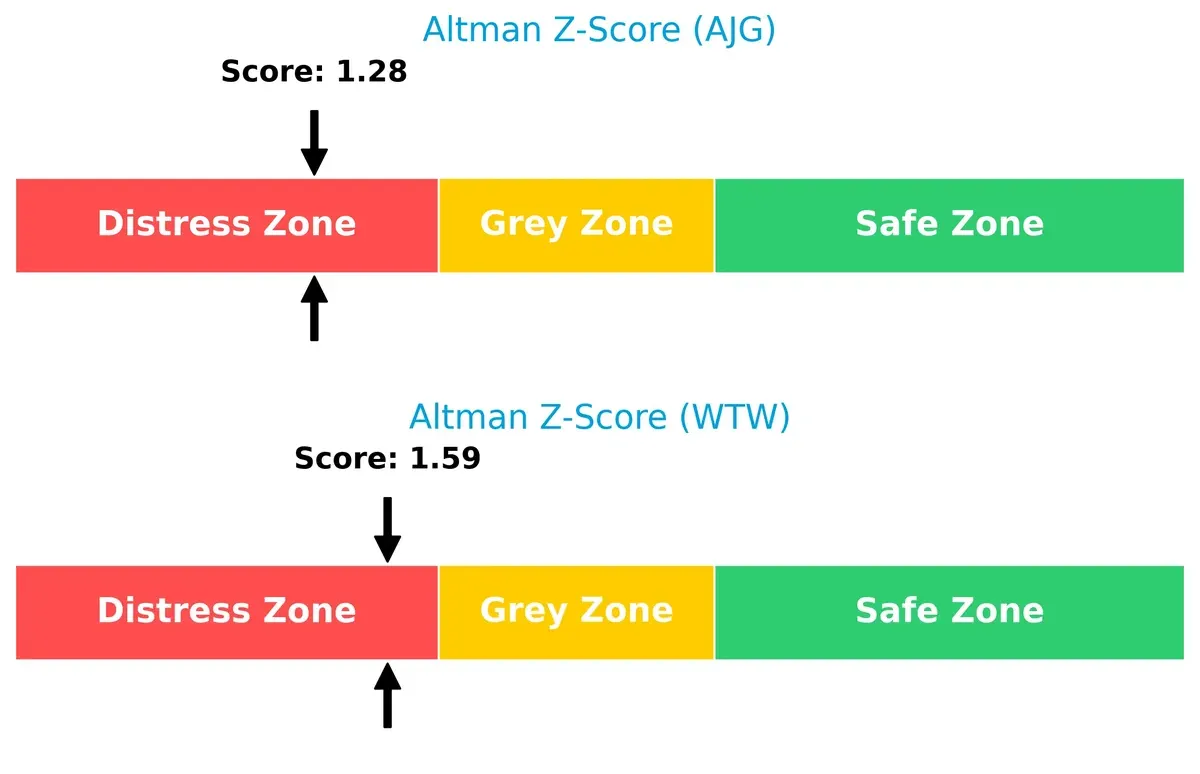
Bankruptcy Risk: Solvency Showdown
The Altman Z-Scores place both firms in the distress zone, signaling elevated bankruptcy risk amid current market pressures:
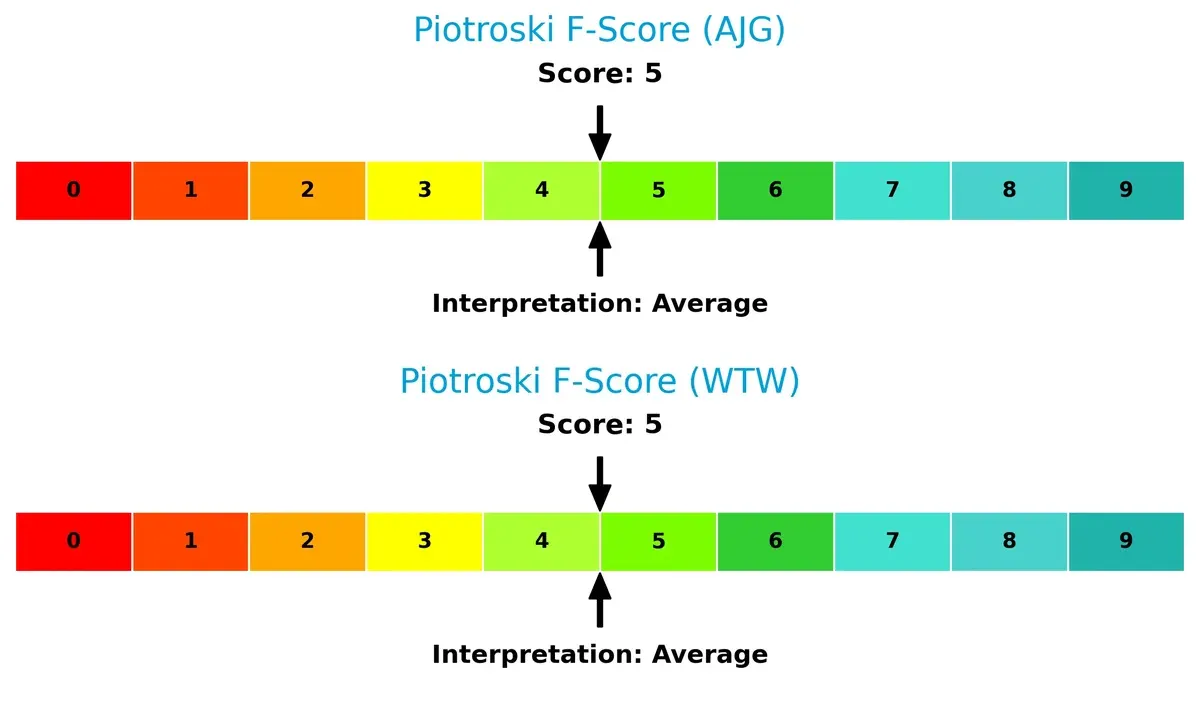
Financial Health: Quality of Operations
Both companies score a 5 on the Piotroski F-Score, indicating average financial health without glaring internal red flags:
How are the two companies positioned?
This section dissects the operational DNA of AJG and WTW by comparing their revenue distribution by segment alongside their core strengths and weaknesses. The final objective is to confront their economic moats and identify which business model offers the most resilient, sustainable advantage in today’s market.
Revenue Segmentation: The Strategic Mix
This visual comparison dissects how Arthur J. Gallagher & Co. and Willis Towers Watson diversify their income streams and reveals their primary sector bets:
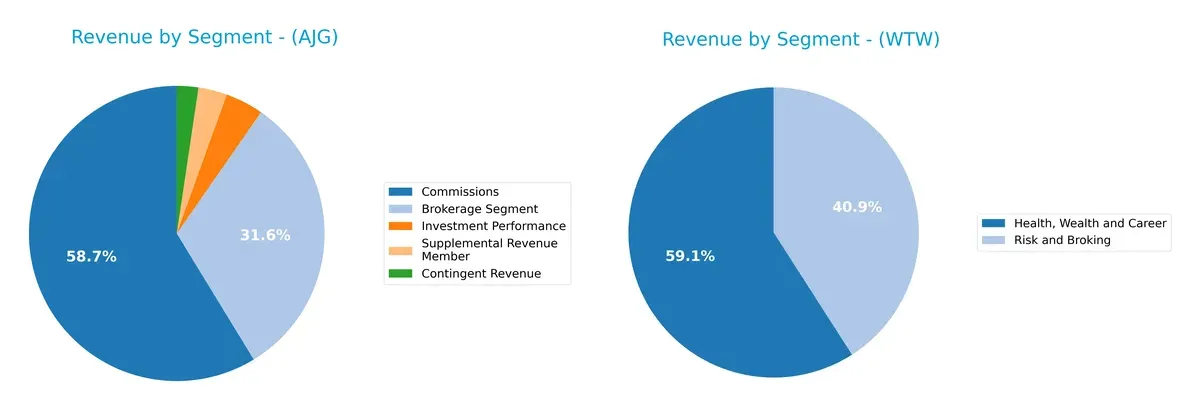
Arthur J. Gallagher leans heavily on its Brokerage Segment, generating $3.6B in 2024, while Willis Towers Watson pivots between Health, Wealth and Career ($5.8B) and Risk and Broking ($4.1B). AJG’s reliance on brokerage suggests strong ecosystem lock-in but exposes concentration risk. WTW’s balanced split across two major segments indicates diversification and resilience, cushioning volatility in any single sector.
Strengths and Weaknesses Comparison
This table compares the Strengths and Weaknesses of Arthur J. Gallagher & Co. (AJG) and Willis Towers Watson (WTW):
AJG Strengths
- Diverse revenue streams including brokerage, commissions, and investment performance
- Strong global presence with significant US and UK markets
- Favorable net margin of 10.72%
- Low debt-to-assets ratio and favorable debt equity metrics
WTW Strengths
- Higher net margin at 16.53% indicating stronger profitability
- Balanced revenue from Health, Wealth, Career, and Risk Broking segments
- Favorable debt-to-assets and debt equity ratios
- Solid presence in US, UK, and Rest of World markets
AJG Weaknesses
- Unfavorable ROE and ROIC indicating weak capital efficiency
- High P/E of 45.1 suggests overvaluation risk
- Unavailable WACC metric hinders cost of capital assessment
- Weak liquidity ratios (current and quick ratio at 0)
- Low asset turnover and fixed asset turnover
WTW Weaknesses
- Unfavorable ROE and ROIC reflect poor returns on invested capital
- Negative interest coverage raises concerns on debt servicing
- Neutral P/E at 20.06 offers less valuation upside
- Weak liquidity with current and quick ratios at 0
- Low asset turnover and fixed asset turnover metrics
Overall, both AJG and WTW show strengths in market diversification and favorable leverage ratios. However, they share weaknesses in capital efficiency and liquidity, which are critical for sustaining growth and managing risks in competitive markets.
The Moat Duel: Analyzing Competitive Defensibility
A structural moat is the sole barrier protecting long-term profits from relentless competition erosion. Let’s dissect how these firms defend their turf:
Arthur J. Gallagher & Co.: Switching Costs Fortress
Gallagher’s moat hinges on switching costs embedded in complex insurance brokerage relationships. Its steady margins and 18% EBIT reflect this stability. Expansion in specialty markets could deepen its moat in 2026.
Willis Towers Watson: Intangible Assets Stronghold
Willis Towers Watson leverages intangible assets—actuarial expertise and data analytics—differentiating it from Gallagher’s cost-based moat. Despite recent revenue softness, its advisory services maintain strong client stickiness. Innovation in health and benefits consulting offers growth levers.
Verdict: Switching Costs vs. Intangible Expertise
Gallagher’s switching cost moat appears wider, bolstered by margin stability and client integration. Willis Towers Watson’s intangible asset moat is deep but currently challenged by uneven revenue trends. Gallagher is better positioned to defend market share amid competitive pressures.
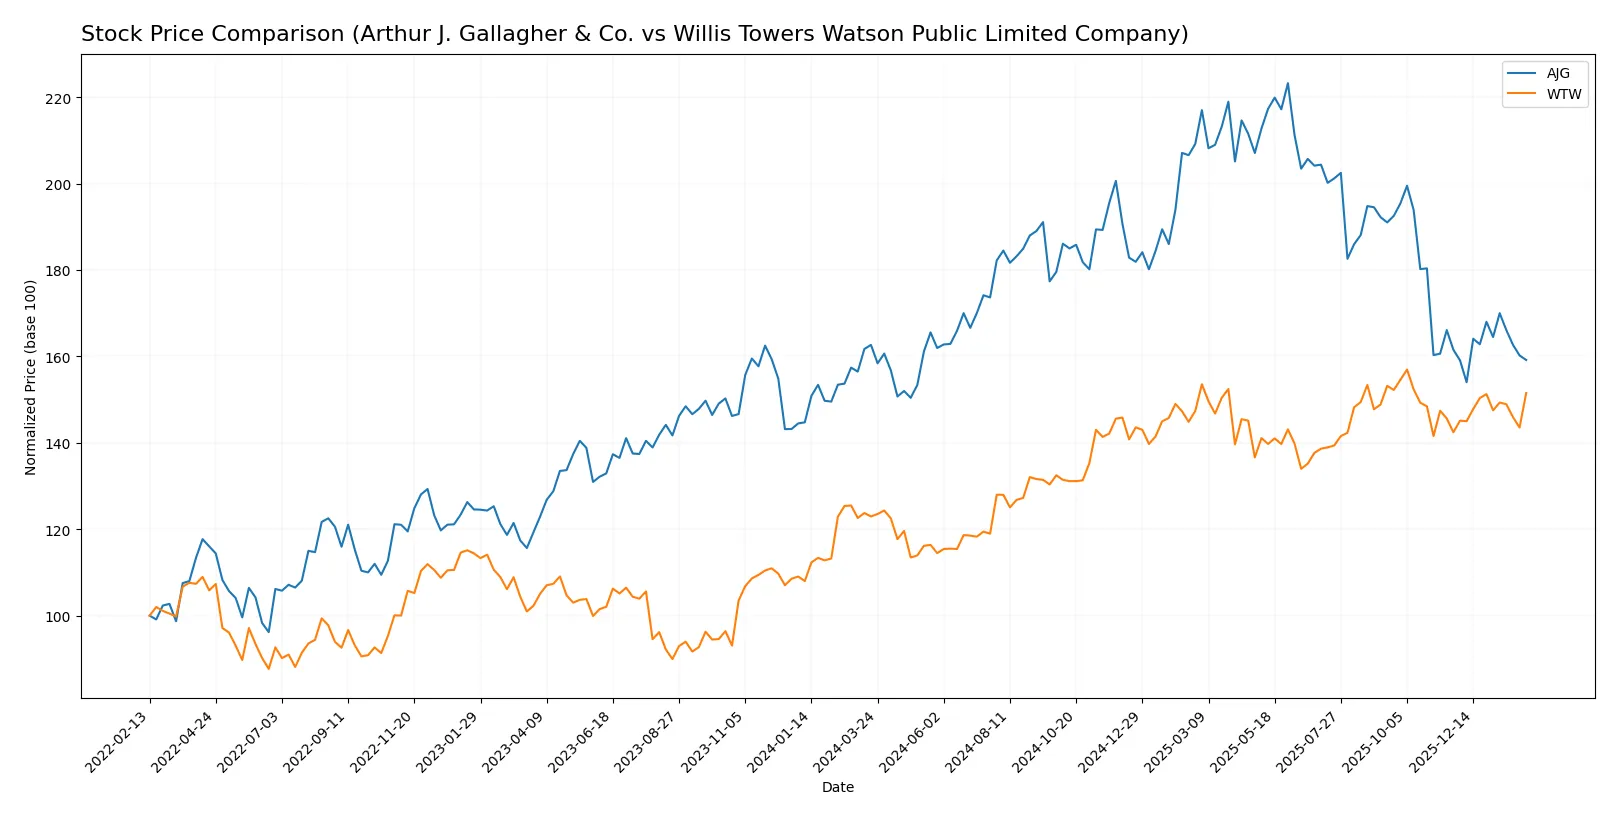
Which stock offers better returns?
Over the past year, Willis Towers Watson’s shares gained over 23%, showing strong upward momentum, while Arthur J. Gallagher’s stock declined just over 2%, reflecting bearish pressure.
Trend Comparison
Arthur J. Gallagher’s stock declined 2.15% over the last 12 months, marking a bearish trend with accelerating downward momentum and notable volatility (std dev 29.86). The price ranged between 234.11 and 347.44.
Willis Towers Watson’s stock rose 23.22% in the same period, a bullish trend with decelerating gains and slightly lower volatility (std dev 26.11). The price fluctuated between 250.95 and 347.14.
Willis Towers Watson outperformed Arthur J. Gallagher, delivering higher market returns with sustained bullish momentum over the past year.
Target Prices
Analysts present a solid target price consensus for Arthur J. Gallagher & Co. and Willis Towers Watson, reflecting confidence in both firms.
| Company | Target Low | Target High | Consensus |
|---|---|---|---|
| Arthur J. Gallagher & Co. | 247 | 334 | 282.23 |
| Willis Towers Watson PLC | 318 | 398 | 367.22 |
The consensus target for Arthur J. Gallagher sits slightly above its current price of 247.73, implying moderate upside. Willis Towers Watson’s consensus target exceeds its current 335.1 price significantly, signaling stronger growth expectations.

Don’t Let Luck Decide Your Entry Point
Optimize your entry points with our advanced ProRealTime indicators. You’ll get efficient buy signals with precise price targets for maximum performance. Start outperforming now!
How do institutions grade them?
Arthur J. Gallagher & Co. Grades
Here are the recent grades from reputable financial institutions for Arthur J. Gallagher & Co.:
| Grading Company | Action | New Grade | Date |
|---|---|---|---|
| Keefe, Bruyette & Woods | Maintain | Market Perform | 2026-01-30 |
| Wells Fargo | Maintain | Overweight | 2026-01-30 |
| Piper Sandler | Maintain | Neutral | 2026-01-30 |
| Cantor Fitzgerald | Downgrade | Neutral | 2026-01-14 |
| Wells Fargo | Maintain | Overweight | 2026-01-13 |
| BMO Capital | Downgrade | Market Perform | 2026-01-13 |
| Barclays | Maintain | Underweight | 2026-01-08 |
| Piper Sandler | Downgrade | Neutral | 2026-01-07 |
| Keefe, Bruyette & Woods | Maintain | Market Perform | 2026-01-06 |
| Wells Fargo | Maintain | Overweight | 2025-12-23 |
Willis Towers Watson Public Limited Company Grades
Below are the recent institutional grades for Willis Towers Watson Public Limited Company:
| Grading Company | Action | New Grade | Date |
|---|---|---|---|
| Cantor Fitzgerald | Maintain | Neutral | 2026-01-14 |
| Wells Fargo | Maintain | Overweight | 2026-01-13 |
| Barclays | Maintain | Underweight | 2026-01-08 |
| Evercore ISI Group | Maintain | Outperform | 2026-01-07 |
| Keefe, Bruyette & Woods | Maintain | Outperform | 2026-01-06 |
| Keefe, Bruyette & Woods | Maintain | Outperform | 2025-12-12 |
| Wells Fargo | Maintain | Overweight | 2025-12-12 |
| Barclays | Maintain | Underweight | 2025-11-20 |
| TD Cowen | Maintain | Buy | 2025-11-10 |
| Keefe, Bruyette & Woods | Maintain | Outperform | 2025-11-04 |
Which company has the best grades?
Willis Towers Watson consistently earns stronger grades, including multiple “Outperform” ratings, compared to Arthur J. Gallagher’s mixed “Market Perform” and “Neutral” grades. Investors may view Willis Towers Watson as having more bullish institutional sentiment, potentially signaling better growth expectations.
Risks specific to each company
The following categories identify the critical pressure points and systemic threats facing both firms in the 2026 market environment:
1. Market & Competition
Arthur J. Gallagher & Co.
- Faces intense competition in insurance brokerage with pressure on margins.
Willis Towers Watson Public Limited Company
- Operates globally with broad advisory and broking services but faces fierce competition in consulting and risk management.
2. Capital Structure & Debt
Arthur J. Gallagher & Co.
- Maintains favorable debt-to-equity metrics and moderate interest coverage at 3.97x.
Willis Towers Watson Public Limited Company
- Also shows favorable debt ratios but interest coverage is negative, a red flag for financial risk.
3. Stock Volatility
Arthur J. Gallagher & Co.
- Beta of 0.658 indicates below-market volatility, providing relative stability.
Willis Towers Watson Public Limited Company
- Slightly lower beta at 0.619, suggesting marginally less sensitivity to market swings.
4. Regulatory & Legal
Arthur J. Gallagher & Co.
- Subject to regulatory scrutiny typical for US-based insurance brokers.
Willis Towers Watson Public Limited Company
- Faces complex regulatory environments across multiple jurisdictions, increasing compliance risk.
5. Supply Chain & Operations
Arthur J. Gallagher & Co.
- Operations rely on broad network of brokers; risk of disruption in agent relationships.
Willis Towers Watson Public Limited Company
- Extensive global operations create operational complexity, demanding strong management controls.
6. ESG & Climate Transition
Arthur J. Gallagher & Co.
- ESG initiatives are growing but not yet a clear moat; climate risks in underwriting exposure.
Willis Towers Watson Public Limited Company
- Increasing focus on ESG advisory creates opportunity, but transition risks remain material.
7. Geopolitical Exposure
Arthur J. Gallagher & Co.
- Primarily US-based with moderate international exposure, limiting geopolitical risk.
Willis Towers Watson Public Limited Company
- Global footprint, especially in Europe and Asia, heightens exposure to geopolitical uncertainties.
Which company shows a better risk-adjusted profile?
Arthur J. Gallagher’s strongest risk lies in competitive pressure on brokerage margins, while Willis Towers Watson faces financial risk from poor interest coverage despite higher profitability. Both show distress-level Altman Z-scores, signaling bankruptcy risk, but Willis Towers Watson’s superior return metrics and diversified services improve its risk-adjusted profile. The negative interest coverage in Willis Towers Watson demands caution, yet its higher net margin and moderate beta suggest a better balance between risk and reward.
Final Verdict: Which stock to choose?
Arthur J. Gallagher & Co. shines through its operational resilience and steady cash flow generation, a true cash machine in the insurance brokerage space. Its main point of vigilance lies in its stretched valuation multiples and mixed liquidity metrics. It suits investors seeking aggressive growth with a tolerance for valuation risk.
Willis Towers Watson boasts a strategic moat rooted in its diversified consulting services and recurring revenue streams, offering superior margin profiles. Relative to AJG, it provides better price stability and a more balanced risk-reward profile. It fits well in a GARP (Growth at a Reasonable Price) portfolio seeking measured growth with defensive traits.
If you prioritize aggressive expansion and market capture, AJG might be the compelling choice due to its operational efficiency and cash flow strength despite valuation concerns. However, if you seek more stability and a reliable moat in consulting services, WTW offers better stability and margin resilience, commanding a more moderate valuation premium. Both demand careful risk assessment given their respective financial nuances.
Disclaimer: Investment carries a risk of loss of initial capital. The past performance is not a reliable indicator of future results. Be sure to understand risks before making an investment decision.
Go Further
I encourage you to read the complete analyses of Arthur J. Gallagher & Co. and Willis Towers Watson Public Limited Company to enhance your investment decisions: