Home > Comparison > Financial Services > AJG vs ERIE
The strategic rivalry between Arthur J. Gallagher & Co. and Erie Indemnity Company shapes the competitive landscape of the insurance brokerage sector. Arthur J. Gallagher dominates as a global, diversified brokerage and risk management firm, while Erie Indemnity operates a focused managing attorney-in-fact model for its insurance exchange. This analysis pits broad market reach against specialized operational efficiency to identify which trajectory offers superior risk-adjusted returns for a diversified portfolio.

Table of contents
Companies Overview
Arthur J. Gallagher & Co. and Erie Indemnity Company hold significant roles in the U.S. insurance brokerage market.
Arthur J. Gallagher & Co.: Global Insurance Brokerage Leader
Arthur J. Gallagher & Co. dominates as a global insurance broker. It generates revenue mainly through retail and wholesale brokerage, managing specialized insurance placements. In 2026, its strategic focus lies in expanding risk management and claims services across multiple regions, including the U.S., Australia, and the U.K., leveraging a vast network of correspondent brokers.
Erie Indemnity Company: Specialized Managing Attorney-in-Fact
Erie Indemnity Company operates primarily as a managing attorney-in-fact for the Erie Insurance Exchange. It earns revenue by providing underwriting, sales, and policy services directly to policyholders. In 2026, its strategy centers on strengthening agent compensation and sales support to enhance market penetration within the U.S., emphasizing underwriting efficiency and customer service.
Strategic Collision: Similarities & Divergences
Both firms compete in insurance brokerage but differ strategically. Gallagher embraces a broad global distribution model, while Erie focuses on a tightly controlled, regional underwriting framework. Their battleground is client acquisition and risk management sophistication. Gallagher offers a diversified platform; Erie maintains deep operational control. These distinctions shape contrasting investment profiles: scale and diversification versus focused, controlled growth.
Income Statement Comparison
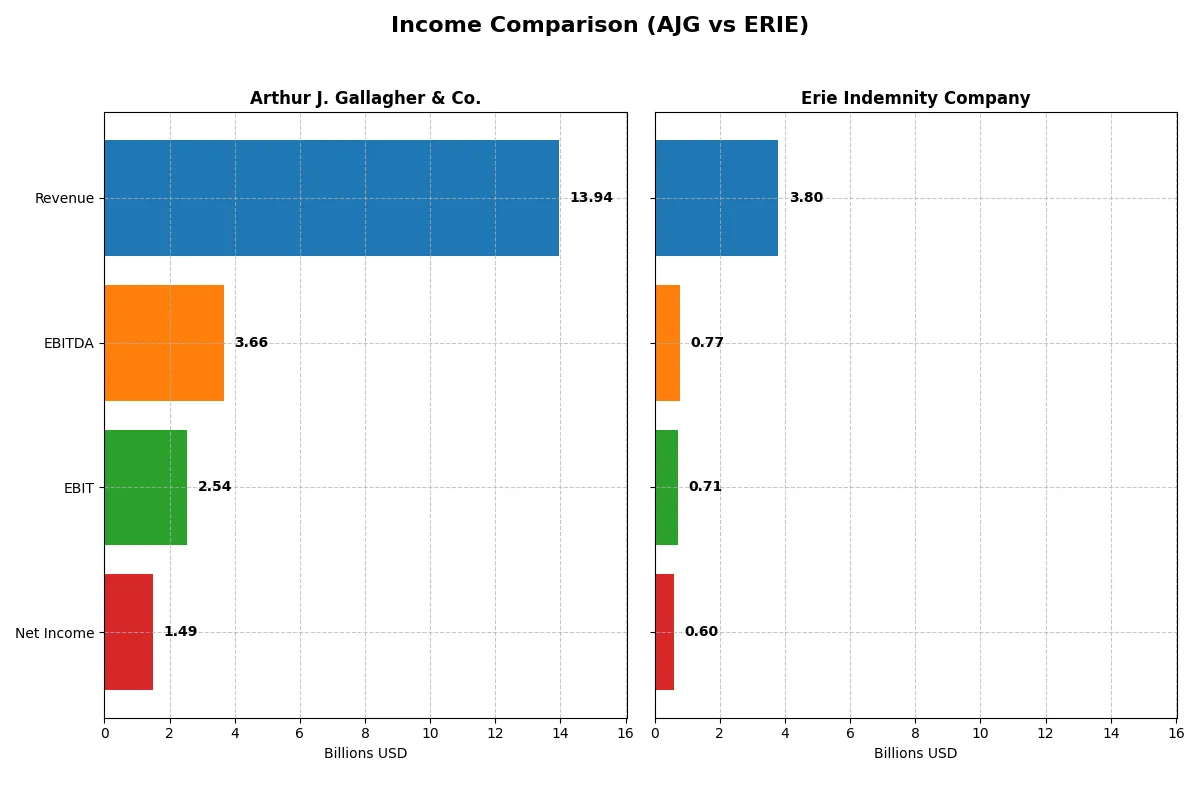
This data dissects the core profitability and scalability of both corporate engines to reveal who dominates the bottom line:
| Metric | Arthur J. Gallagher & Co. (AJG) | Erie Indemnity Company (ERIE) |
|---|---|---|
| Revenue | 13.94B | 3.80B |
| Cost of Revenue | 6.31B | 3.12B |
| Operating Expenses | 5.08B | 0 |
| Gross Profit | 7.63B | 676M |
| EBITDA | 3.66B | 766M |
| EBIT | 2.54B | 710M |
| Interest Expense | 639M | 0 |
| Net Income | 1.49B | 600M |
| EPS | 5.83 | 12.89 |
| Fiscal Year | 2025 | 2024 |
Income Statement Analysis: The Bottom-Line Duel
This income statement comparison reveals which company runs a more efficient and profitable business engine through revenue and margin dynamics.
Arthur J. Gallagher & Co. Analysis
Arthur J. Gallagher & Co. grew revenue from $8.2B in 2021 to $13.9B in 2025, marking a 70% increase. Net income followed, reaching $1.49B in 2025. Gross margin remains strong at 54.75%, reflecting solid cost control. However, net margin slipped slightly to 10.72% in 2025, indicating margin pressure despite revenue momentum.
Erie Indemnity Company Analysis
Erie Indemnity steadily expanded revenue from $2.54B in 2020 to $3.80B in 2024, a 50% rise. Net income grew impressively, doubling to $600M. Gross margin is modest at 17.82%, but Erie boasts a healthier net margin of 15.82% in 2024. Profit growth and margin expansion show efficient cost management and accelerating earnings power.
Margin Strength vs. Revenue Scale
Arthur J. Gallagher leads in revenue scale and gross margin but faces slight net margin compression. Erie Indemnity shows superior net margin growth and a more pronounced earnings expansion relative to its size. Investors seeking robust margin gains and earnings momentum may find Erie’s profile more attractive, while those valuing scale might favor Arthur J. Gallagher.
Financial Ratios Comparison
These vital ratios act as a diagnostic tool to expose the underlying fiscal health, valuation premiums, and capital efficiency of the companies compared below:
| Ratios | Arthur J. Gallagher & Co. (AJG) | Erie Indemnity Company (ERIE) |
|---|---|---|
| ROE | 7.26% (2024) | 30.21% (2024) |
| ROIC | 5.05% (2024) | 25.61% (2024) |
| P/E | 42.79 (2024) | 31.72 (2024) |
| P/B | 3.11 (2024) | 9.58 (2024) |
| Current Ratio | 1.51 (2024) | 1.43 (2024) |
| Quick Ratio | 1.51 (2024) | 1.43 (2024) |
| D/E | 0.67 (2024) | 0.004 (2024) |
| Debt-to-Assets | 21.0% (2024) | 0.26% (2024) |
| Interest Coverage | 5.99 (2024) | 0 (2024) |
| Asset Turnover | 0.18 (2024) | 1.31 (2024) |
| Fixed Asset Turnover | 11.24 (2024) | 7.39 (2024) |
| Payout ratio | 35.9% (2024) | 39.6% (2024) |
| Dividend yield | 0.84% (2024) | 1.25% (2024) |
| Fiscal Year | 2024 | 2024 |
Efficiency & Valuation Duel: The Vital Signs
Financial ratios act as the company’s DNA, exposing operational strengths and hidden risks that define investment potential.
Arthur J. Gallagher & Co.
Arthur J. Gallagher posts a modest net margin of 10.7% but registers zero ROE and ROIC, signaling weak profitability efficiency. Its P/E ratio at 45.1 suggests the stock trades at a premium, yet dividend yield remains a neutral 1%, indicating moderate shareholder returns amidst stretched valuation metrics.
Erie Indemnity Company
Erie Indemnity exhibits robust profitability with a 15.8% net margin, 30.2% ROE, and 25.6% ROIC, demonstrating operational efficiency. The P/E ratio of 31.7 is elevated but more reasonable than AJG’s. Erie yields 1.25% dividend, aligning with a strong capital allocation strategy and favorable ratio profile.
Premium Valuation vs. Operational Safety
Erie Indemnity offers stronger profitability and operational efficiency with a more balanced valuation than Arthur J. Gallagher. Investors prioritizing stable returns and margin strength may prefer Erie, while those tolerating higher valuation multiples may consider AJG’s growth narrative.
Which one offers the Superior Shareholder Reward?
I observe Arthur J. Gallagher & Co. (AJG) offers a modest 1.0% dividend yield with a 45% payout ratio, balancing dividends with robust buybacks that enhance shareholder value. Erie Indemnity Company (ERIE) yields a higher 1.25% with a similar ~40% payout but pairs it with a lower leverage profile and consistent free cash flow. AJG’s buyback intensity complements its moderate dividend, supporting capital appreciation sustainably. ERIE prioritizes steady dividends and conservative debt, appealing for income-focused investors. I find AJG’s blend of buybacks and dividends delivers a superior total return profile in 2026, thanks to its strategic capital allocation and growth reinvestment.
Comparative Score Analysis: The Strategic Profile
The radar chart reveals the fundamental DNA and trade-offs of Arthur J. Gallagher & Co. and Erie Indemnity Company, highlighting their distinct financial strengths and weaknesses:
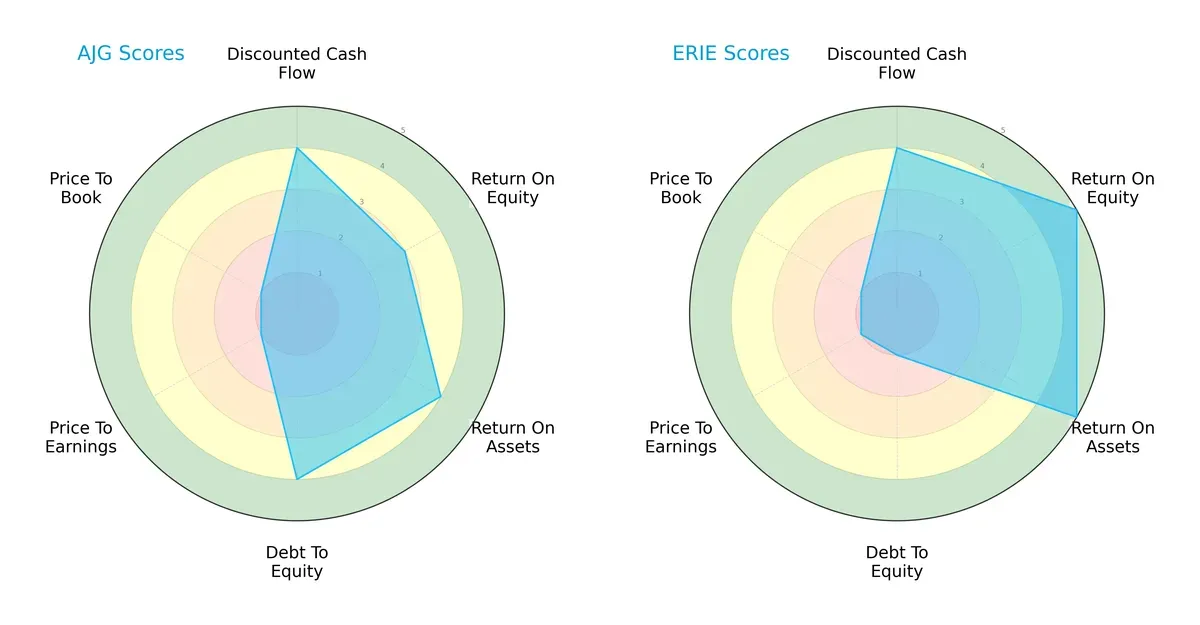
Arthur J. Gallagher & Co. presents a balanced profile with favorable debt-to-equity and asset utilization scores, but weak valuation metrics. Erie Indemnity excels in profitability (ROE and ROA) yet struggles with leverage, reflecting a riskier capital structure. Erie relies heavily on operational efficiency, while Gallagher maintains steadier financial risk management.
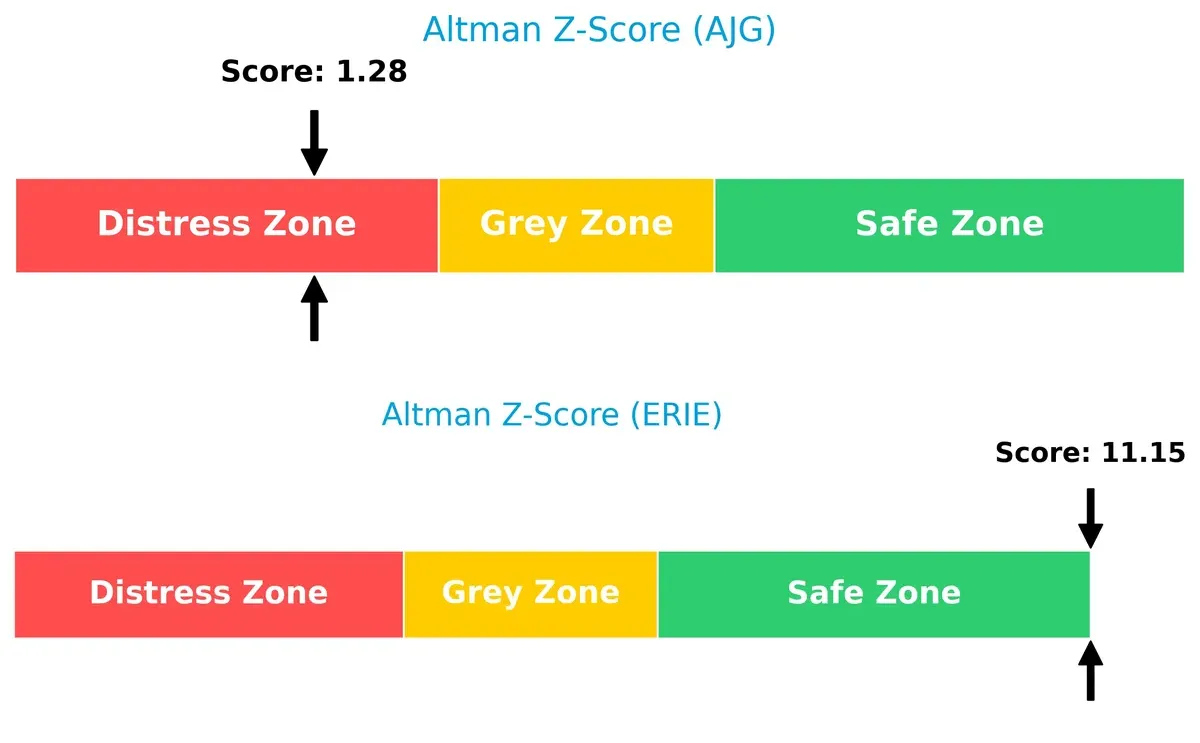
Bankruptcy Risk: Solvency Showdown
Erie’s Altman Z-Score of 11.15 positions it firmly in the safe zone, signaling robust long-term solvency. In contrast, Gallagher’s 1.28 score places it in the distress zone, indicating higher bankruptcy risk in the current cycle:
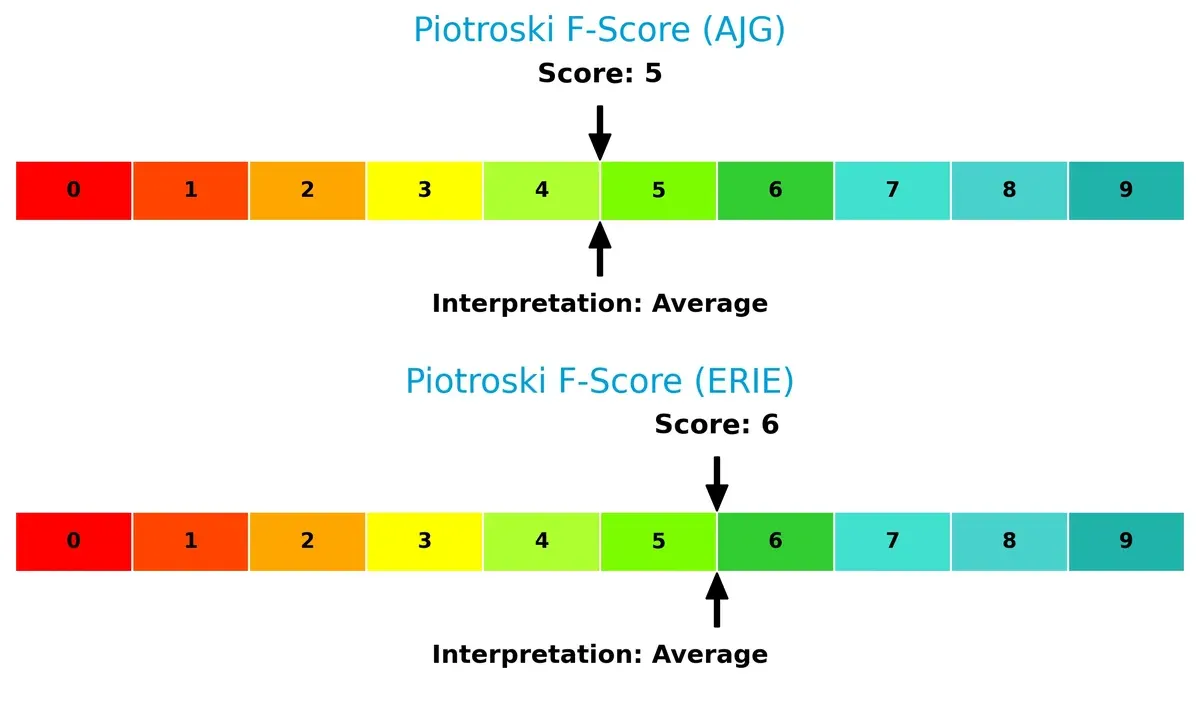
Financial Health: Quality of Operations
Both companies show average Piotroski F-Scores—6 for Erie and 5 for Gallagher—indicating moderate financial health without glaring red flags. Erie holds a slight edge in operational quality and internal metrics:
How are the two companies positioned?
This section dissects AJG and ERIE’s operational DNA by comparing revenue distribution and internal dynamics. The goal is to confront their economic moats and identify the more resilient, sustainable competitive advantage today.
Revenue Segmentation: The Strategic Mix
The following visual comparison dissects how Arthur J. Gallagher & Co. and Erie Indemnity Company diversify their income streams and where their primary sector bets lie:
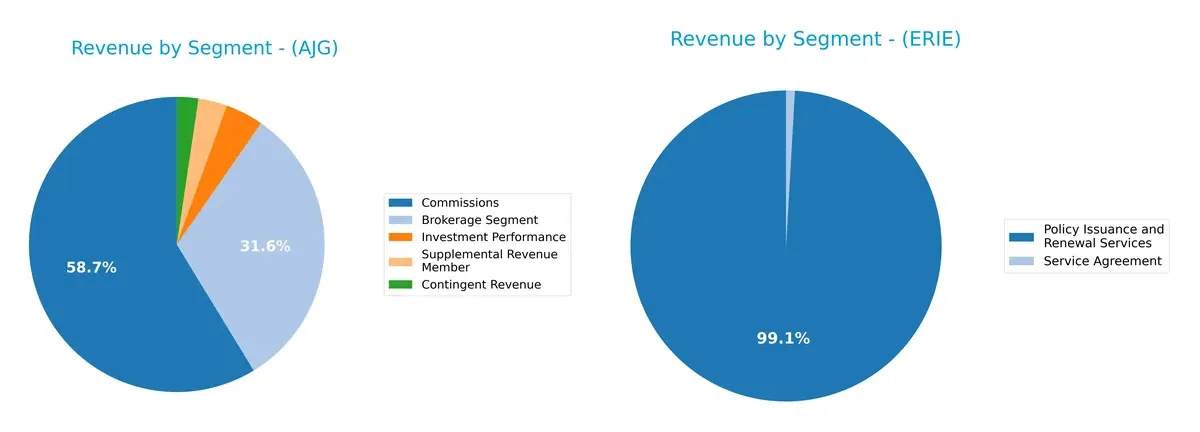
Arthur J. Gallagher leans heavily on its Brokerage Segment, with $8.6B in 2023, anchoring its revenue and showing concentration risk. Erie Indemnity pivots on Policy Issuance and Renewal Services, generating $2.9B in 2024, but its mix remains narrow. Gallagher’s broader stream includes commissions and contingent revenue, suggesting ecosystem lock-in. Erie’s reliance on a core service segment signals infrastructure dominance but limited diversification.
Strengths and Weaknesses Comparison
This table compares the strengths and weaknesses of Arthur J. Gallagher & Co. and Erie Indemnity Company:
Arthur J. Gallagher & Co. Strengths
- Diverse revenue streams across brokerage and risk management segments
- Strong net margin of 10.72%
- Favorable debt-to-equity and debt-to-assets ratios
- Global presence with significant revenue in the US, UK, Australia, and Canada
Erie Indemnity Company Strengths
- Superior profitability with net margin 15.82% and ROE 30.21%
- Strong ROIC (25.61%) well above WACC (5.55%) indicating value creation
- High asset turnover and interest coverage
- Favorable capital structure and liquidity ratios
Arthur J. Gallagher & Co. Weaknesses
- Zero reported ROE and ROIC indicating inefficiency in capital use
- Unfavorable P/E ratio at 45.1 above typical benchmarks
- Poor liquidity metrics with zero current and quick ratios
- Weak asset turnover and fixed asset turnover ratios
Erie Indemnity Company Weaknesses
- Unfavorable high P/B ratio at 9.58 suggesting potential overvaluation
- P/E ratio at 31.72 still above average market levels
- Limited revenue diversification focused mainly on policy issuance
Arthur J. Gallagher & Co. shows a broad geographic and segment diversification but struggles with capital efficiency and liquidity. Erie Indemnity excels in profitability and capital returns but faces valuation concerns and narrower revenue streams. Each company’s financial profile suggests differing strategic priorities around growth, capital allocation, and market positioning.
The Moat Duel: Analyzing Competitive Defensibility
A structural moat is the only reliable shield protecting long-term profits from relentless competition erosion. Let’s dissect the moats of two insurance brokers:
Arthur J. Gallagher & Co. (AJG): Diversified Brokerage Network
AJG’s moat stems from broad geographic diversification and deep client relationships. Financials show solid gross margins near 55%, but declining ROIC signals looming pressure. Expansion in the UK and Australia could deepen its moat if operational efficiency improves.
Erie Indemnity Company (ERIE): Efficient Capital Allocation with Strong ROIC
ERIE’s moat hinges on superior capital efficiency and underwriting discipline, reflected by ROIC exceeding WACC by 20%. Unlike AJG, ERIE’s ROIC trends sharply upward, driving margin expansion and doubling net income over five years. Its focused U.S. market offers growth via scalable agent services.
Geographic Reach vs. Capital Efficiency: Who Holds the Truer Moat?
AJG boasts a wider moat through global footprint and service breadth, yet its declining ROIC weakens durability. ERIE’s narrower moat is deeper and more profitable, with rising ROIC signaling a sustainable competitive edge. I see ERIE better positioned to defend market share in an intensifying competitive landscape.
Which stock offers better returns?
Over the past 12 months, both Arthur J. Gallagher & Co. and Erie Indemnity Company faced bearish price trends with notable price declines and varying trend momentum.
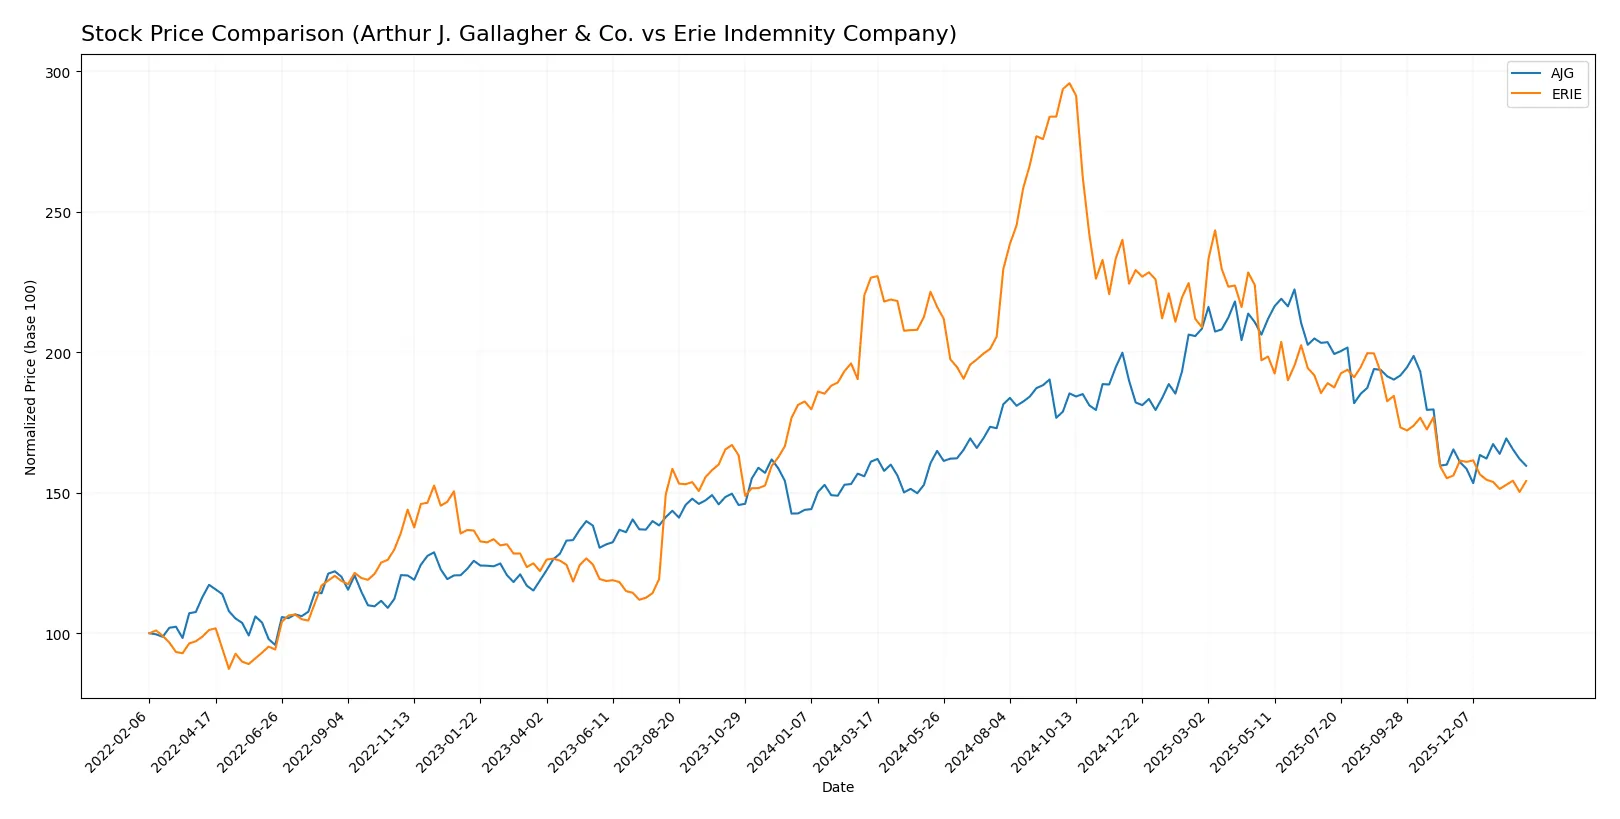
Trend Comparison
Arthur J. Gallagher & Co. shows a mild bearish trend with a -0.92% price change over the past year, accelerating downward from November 2025 to February 2026.
Erie Indemnity Company exhibits a strong bearish trend with a -31.95% decline over the year, though recent months show decelerating losses and a near-neutral price change of -1.25%.
Erie’s stock underperformed Arthur J. Gallagher’s significantly, delivering the lowest market return in the analyzed period.
Target Prices
Analysts show a clear consensus on Arthur J. Gallagher & Co.’s valuation with a moderate upside potential.
| Company | Target Low | Target High | Consensus |
|---|---|---|---|
| Arthur J. Gallagher & Co. | 247 | 334 | 282.38 |
The consensus target price of $282.38 suggests a 13% upside from the current $249.37 share price. No verified target price data is available for Erie Indemnity Company.

Don’t Let Luck Decide Your Entry Point
Optimize your entry points with our advanced ProRealTime indicators. You’ll get efficient buy signals with precise price targets for maximum performance. Start outperforming now!
How do institutions grade them?
Institutional grades for Arthur J. Gallagher & Co. illustrate a range of analyst views:
Arthur J. Gallagher & Co. Grades
Below is a summary of recent grades from established financial institutions.
| Grading Company | Action | New Grade | Date |
|---|---|---|---|
| Piper Sandler | Maintain | Neutral | 2026-01-30 |
| Wells Fargo | Maintain | Overweight | 2026-01-30 |
| Keefe, Bruyette & Woods | Maintain | Market Perform | 2026-01-30 |
| Cantor Fitzgerald | Downgrade | Neutral | 2026-01-14 |
| Wells Fargo | Maintain | Overweight | 2026-01-13 |
| BMO Capital | Downgrade | Market Perform | 2026-01-13 |
| Barclays | Maintain | Underweight | 2026-01-08 |
| Piper Sandler | Downgrade | Neutral | 2026-01-07 |
| Keefe, Bruyette & Woods | Maintain | Market Perform | 2026-01-06 |
| Wells Fargo | Maintain | Overweight | 2025-12-23 |
Erie Indemnity Company Grades
No reliable grades are available for Erie Indemnity Company.
Which company has the best grades?
Arthur J. Gallagher & Co. holds a spectrum from Underweight to Overweight, mostly clustered around Neutral and Market Perform. Erie Indemnity lacks institutional grades, limiting comparative insight. Investors may find AJG’s diverse opinions reflect more analyst attention and actionable data.
Risks specific to each company
The following categories identify the critical pressure points and systemic threats facing both firms in the 2026 market environment:
1. Market & Competition
Arthur J. Gallagher & Co.
- Faces intense competition from global and regional brokers with pressure on fees and client retention.
Erie Indemnity Company
- Operates in a smaller geographic footprint but competes on underwriting expertise and customer service.
2. Capital Structure & Debt
Arthur J. Gallagher & Co.
- Maintains a favorable debt-to-equity profile with manageable leverage, but lacks current ratio data indicating possible liquidity concerns.
Erie Indemnity Company
- Shows a very low debt-to-equity ratio and strong interest coverage, indicating solid financial stability and low leverage risk.
3. Stock Volatility
Arthur J. Gallagher & Co.
- Beta at 0.675 suggests moderate stock volatility with some market sensitivity.
Erie Indemnity Company
- Low beta of 0.373 indicates lower stock volatility and defensive characteristics amid market fluctuations.
4. Regulatory & Legal
Arthur J. Gallagher & Co.
- Exposure to global regulatory frameworks increases compliance complexity and legal risk.
Erie Indemnity Company
- Primarily US-focused regulatory environment limits legal complexity but still requires vigilant compliance.
5. Supply Chain & Operations
Arthur J. Gallagher & Co.
- Operates a broad global network demanding robust operational management and risk controls.
Erie Indemnity Company
- Smaller scale operations reduce supply chain complexity but may limit scalability and flexibility.
6. ESG & Climate Transition
Arthur J. Gallagher & Co.
- Faces growing pressure to integrate ESG factors into underwriting and consulting services globally.
Erie Indemnity Company
- ESG initiatives are less exposed but will increasingly shape underwriting standards and investor expectations.
7. Geopolitical Exposure
Arthur J. Gallagher & Co.
- Significant international presence exposes it to geopolitical risks and currency fluctuations.
Erie Indemnity Company
- Concentrated US market focus limits geopolitical risk but increases domestic political and economic sensitivity.
Which company shows a better risk-adjusted profile?
Erie Indemnity’s strongest risk is its high price-to-book ratio, signaling potential overvaluation risk despite robust financials. For Arthur J. Gallagher, liquidity concerns and low profitability metrics flag operational risks amid global expansion. Erie’s conservative leverage and low volatility yield a better risk-adjusted profile. Recent Altman Z-Score data confirms Arthur J. Gallagher remains in financial distress territory, while Erie sits comfortably in the safe zone, underscoring my caution on AJG’s risk exposure.
Final Verdict: Which stock to choose?
Arthur J. Gallagher & Co. (AJG) excels as a cash-generating powerhouse with robust revenue growth and solid income quality. Its point of vigilance lies in declining ROIC trends, signaling potential challenges in capital efficiency. AJG fits an aggressive growth portfolio seeking expansion with some risk tolerance.
Erie Indemnity Company (ERIE) boasts a very favorable moat, demonstrated by a strong, growing ROIC well above its cost of capital. Its strategic advantage lies in efficient asset utilization and consistent profitability, offering better financial stability than AJG. ERIE suits investors focused on growth at a reasonable price (GARP) with a preference for durable competitive advantages.
If you prioritize dynamic growth and can tolerate some inefficiencies, AJG presents an intriguing scenario as a growth engine with room to optimize capital returns. However, if you seek a durable competitive moat combined with financial stability, ERIE outshines as the more prudent choice, commanding a premium for its consistent value creation.
Disclaimer: Investment carries a risk of loss of initial capital. The past performance is not a reliable indicator of future results. Be sure to understand risks before making an investment decision.
Go Further
I encourage you to read the complete analyses of Arthur J. Gallagher & Co. and Erie Indemnity Company to enhance your investment decisions: