Home > Comparison > Financial Services > AJG vs BRO
The strategic rivalry between Arthur J. Gallagher & Co. and Brown & Brown, Inc. shapes the competitive landscape of the insurance brokerage sector. Gallagher operates as a global, diversified brokerage and risk management firm, while Brown & Brown emphasizes specialized retail and wholesale insurance solutions. This head-to-head contrasts scale and scope against niche focus. This analysis will identify which business model offers superior risk-adjusted returns for a diversified financial services portfolio.

Table of contents
Companies Overview
Arthur J. Gallagher & Co. and Brown & Brown, Inc. both hold significant stakes in the global insurance brokerage market.
Arthur J. Gallagher & Co.: Global Insurance Brokerage Powerhouse
Arthur J. Gallagher & Co. leads as a diversified insurance broker, generating revenue primarily through retail and wholesale brokerage, risk management, and consulting services. In 2026, its strategy focuses on expanding specialized insurance offerings and enhancing its global footprint across the US, UK, Australia, and beyond, leveraging a broad correspondent broker network.
Brown & Brown, Inc.: Specialized Insurance Solutions Provider
Brown & Brown, Inc. excels in targeted insurance distribution across retail, national programs, wholesale brokerage, and services segments. Its 2026 strategy sharpens on niche markets like professional liability and cyber insurance, while strengthening third-party claims administration and medical management services, supported by independent agents in North America and Europe.
Strategic Collision: Similarities & Divergences
Both firms compete through insurance brokerage and risk management but diverge in approach. Gallagher emphasizes global scale and specialty insurance breadth, while Brown & Brown targets niche segments and service specialization. Their battleground is the commercial insurance market, yet Gallagher’s broader diversification contrasts with Brown’s focused product innovation, creating distinct investment dynamics in scale versus specialization.
Income Statement Comparison
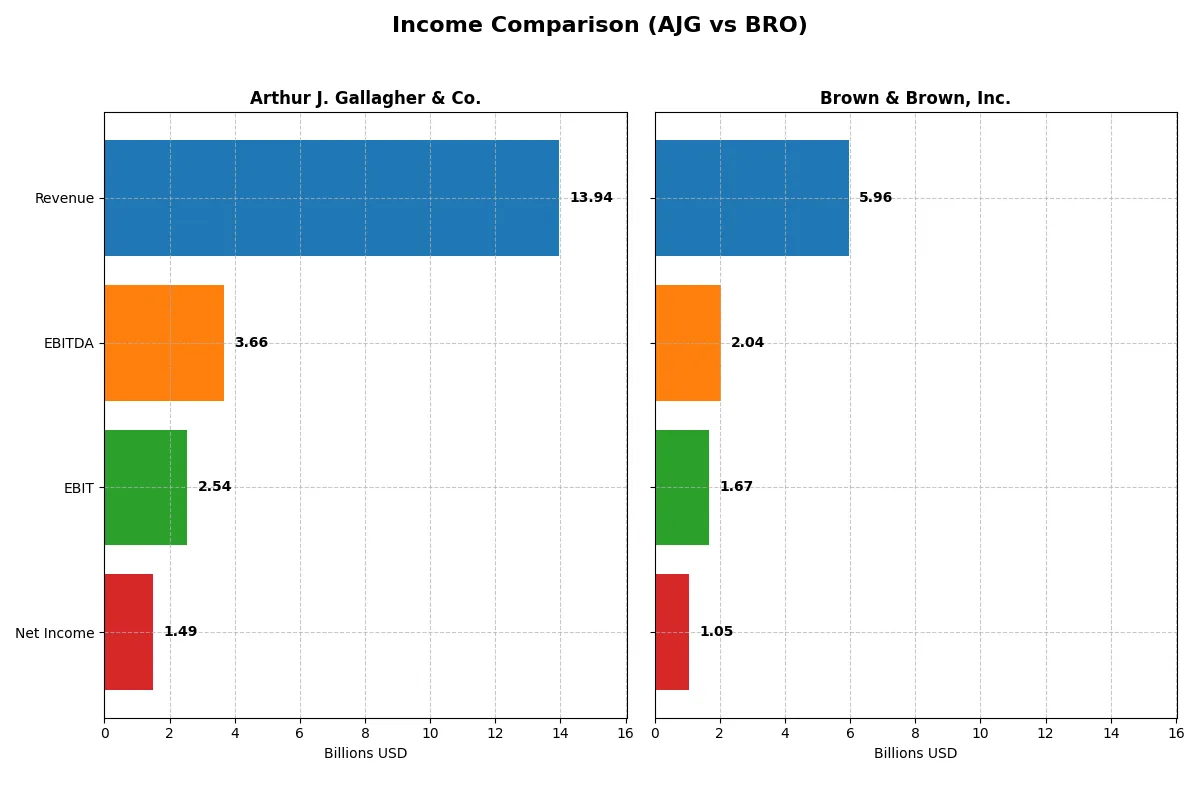
The following data dissects the core profitability and scalability of both corporate engines to reveal who dominates the bottom line:
| Metric | Arthur J. Gallagher & Co. (AJG) | Brown & Brown, Inc. (BRO) |
|---|---|---|
| Revenue | 13.9B | 5.96B |
| Cost of Revenue | 6.31B | 734M |
| Operating Expenses | 5.08B | 3.53B |
| Gross Profit | 7.63B | 5.22B |
| EBITDA | 3.66B | 2.04B |
| EBIT | 2.54B | 1.67B |
| Interest Expense | 639M | 297M |
| Net Income | 1.49B | 1.05B |
| EPS | 5.83 | 3.37 |
| Fiscal Year | 2025 | 2025 |
Income Statement Analysis: The Bottom-Line Duel
This income statement comparison unveils which company drives more efficient growth and profitability through its core operations.
Arthur J. Gallagher & Co. (AJG) Analysis
AJG’s revenue advanced steadily from 8.2B in 2021 to 13.9B in 2025, a 70% increase. Net income expanded from 907M to 1.49B in the same period. Its gross margin holds at a solid 54.75%, reflecting healthy cost control, while the net margin at 10.72% remains favorable. In 2025, revenue surged 20.7%, but net margin dipped slightly, signaling some margin pressure despite strong top-line momentum.
Brown & Brown, Inc. (BRO) Analysis
BRO nearly doubled revenue over five years, from 3.0B in 2021 to 5.96B in 2025, with net income rising 79.5% to 1.05B. Its gross margin impresses at 87.68%, indicating exceptional cost efficiency, and net margin peaks at 17.7%. The latest year shows a 26.6% revenue jump, but net margin fell 16.2%, hinting at rising expenses amidst rapid growth.
Margin Strength vs. Growth Velocity
Both companies exhibit strong revenue and net income growth, but BRO’s superior gross and net margins outperform AJG’s by wide margins. AJG’s scale and consistent margin health contrast with BRO’s sharper growth but greater margin volatility. Investors seeking robust profitability may favor BRO’s margin profile, while AJG appeals with steady expansion and margin stability.
Financial Ratios Comparison
These vital ratios act as a diagnostic tool to expose the underlying fiscal health, valuation premiums, and capital efficiency of the companies compared below:
| Ratios | Arthur J. Gallagher & Co. (AJG) | Brown & Brown, Inc. (BRO) |
|---|---|---|
| ROE | N/A | N/A |
| ROIC | N/A | N/A |
| P/E | 45.10 | 23.44 |
| P/B | 3.11 | N/A |
| Current Ratio | 0 | 0 |
| Quick Ratio | 0 | 0 |
| D/E | 0 | 0 |
| Debt-to-Assets | 0 | 0 |
| Interest Coverage | 3.99 | 5.71 |
| Asset Turnover | 0 | 0 |
| Fixed Asset Turnover | 0 | 0 |
| Payout ratio | 45.31% | 18.41% |
| Dividend yield | 1.00% | 0.79% |
| Fiscal Year | 2025 | 2025 |
Efficiency & Valuation Duel: The Vital Signs
Ratios act as a company’s DNA, exposing hidden risks and operational strengths that numbers alone cannot reveal.
Arthur J. Gallagher & Co.
Arthur J. Gallagher shows a moderate net margin of 10.72%, but its ROE and ROIC are unfavorable, signaling weak profitability. The stock trades at a high P/E of 45.1, indicating an expensive valuation. Dividend yield stands at a modest 1%, suggesting limited shareholder returns amid reinvestment focus.
Brown & Brown, Inc.
Brown & Brown delivers a stronger net margin of 17.7%, with ROE and ROIC data unavailable but P/E more reasonable at 23.44, reflecting a fairly valued stock. Interest coverage is favorable at 5.62, yet dividend yield is low at 0.79%, indicating restrained direct returns to shareholders.
Premium Valuation vs. Operational Safety
Arthur J. Gallagher’s valuation appears stretched relative to its profitability. Brown & Brown offers better margin efficiency and interest coverage but shares similar dividend constraints. Investors seeking growth at a higher price might prefer AJG, while those valuing operational safety may lean toward BRO.
Which one offers the Superior Shareholder Reward?
I find Arthur J. Gallagher & Co. (AJG) delivers a more balanced shareholder reward versus Brown & Brown, Inc. (BRO). AJG’s 1.0% dividend yield with a 45% payout ratio reflects solid free cash flow coverage, while BRO yields 0.8% with a 18% payout, favoring buybacks. AJG’s more aggressive buyback program and consistent FCF support sustainable dividends. BRO’s lower payout enables reinvestment, but its higher P/E and debt ratios suggest greater risk. I conclude AJG offers superior total return potential in 2026, blending steady income with capital appreciation.
Comparative Score Analysis: The Strategic Profile
The radar chart reveals the fundamental DNA and trade-offs of Arthur J. Gallagher & Co. and Brown & Brown, Inc.:
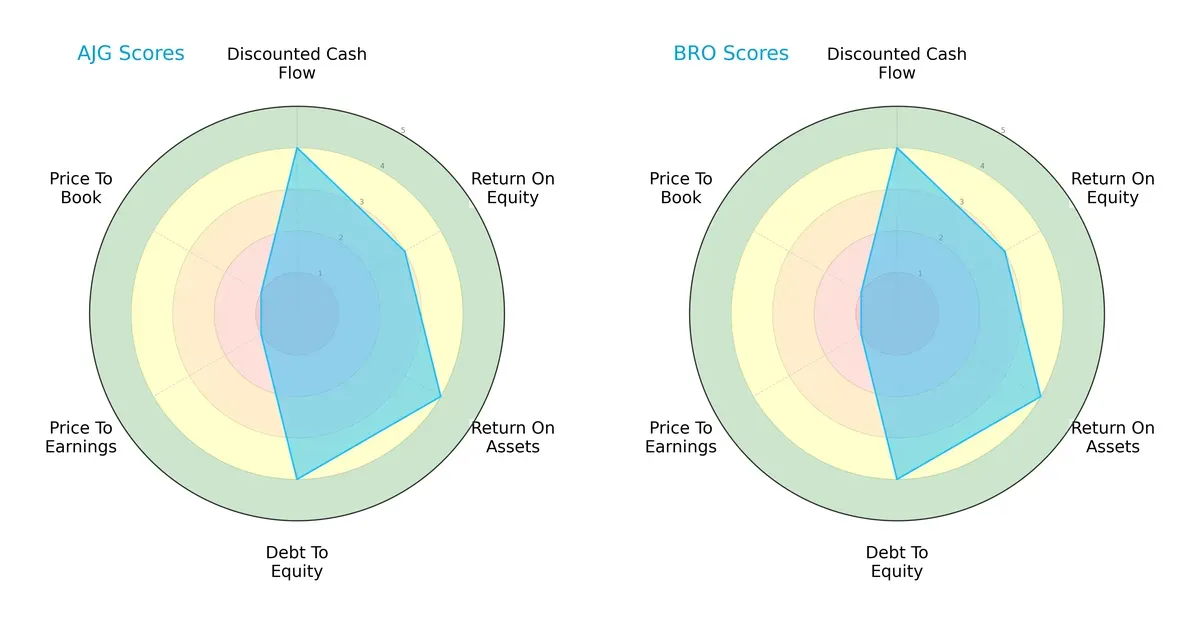
Both firms share identical scores across DCF (4), ROE (3), ROA (4), and Debt/Equity (4), indicating similar operational efficiency and financial leverage. However, both struggle equally on valuation metrics, scoring very unfavorably on P/E and P/B ratios (1 each). Neither exhibits a more balanced profile; both rely on solid cash flow and asset utilization but face valuation headwinds.
Bankruptcy Risk: Solvency Showdown
Arthur J. Gallagher & Co. and Brown & Brown, Inc. both fall into the Altman Z-Score distress zone, signaling elevated bankruptcy risk amid current market pressures:
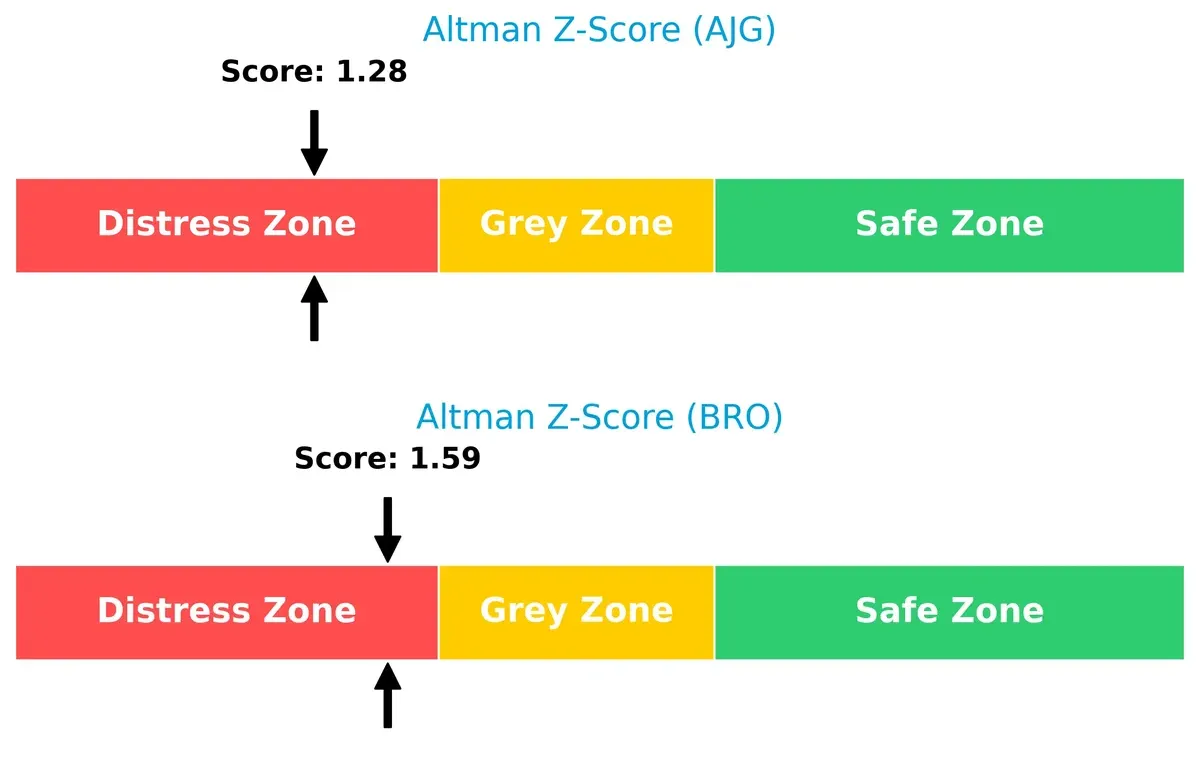
AJG’s score at 1.28 is slightly lower than BRO’s 1.59, suggesting marginally higher insolvency risk. Historically, firms in this range require vigilant balance sheet management to avoid default.
Financial Health: Quality of Operations
Piotroski F-Scores place both companies in the average financial health category, reflecting moderate operational quality and internal metric stability:
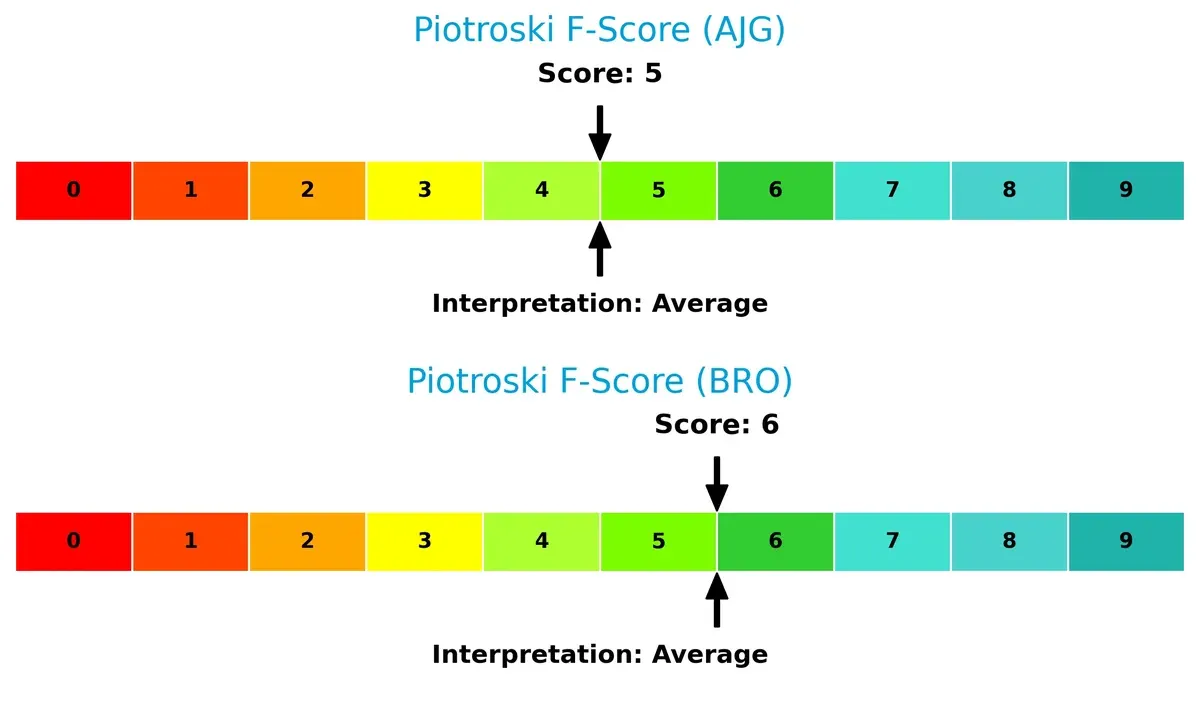
BRO leads with a score of 6 versus AJG’s 5, indicating marginally stronger fundamentals. Neither company shows acute red flags, but both have room to improve profitability and efficiency to reach peak financial condition.
How are the two companies positioned?
This section dissects AJG and BRO’s operational DNA by comparing their revenue distribution across segments and analyzing internal strengths and weaknesses. The goal is to confront their economic moats to identify which model offers the most resilient competitive advantage today.
Revenue Segmentation: The Strategic Mix
This visual comparison dissects how Arthur J. Gallagher & Co. and Brown & Brown, Inc. diversify their income streams and highlights where each places their primary sector bets:
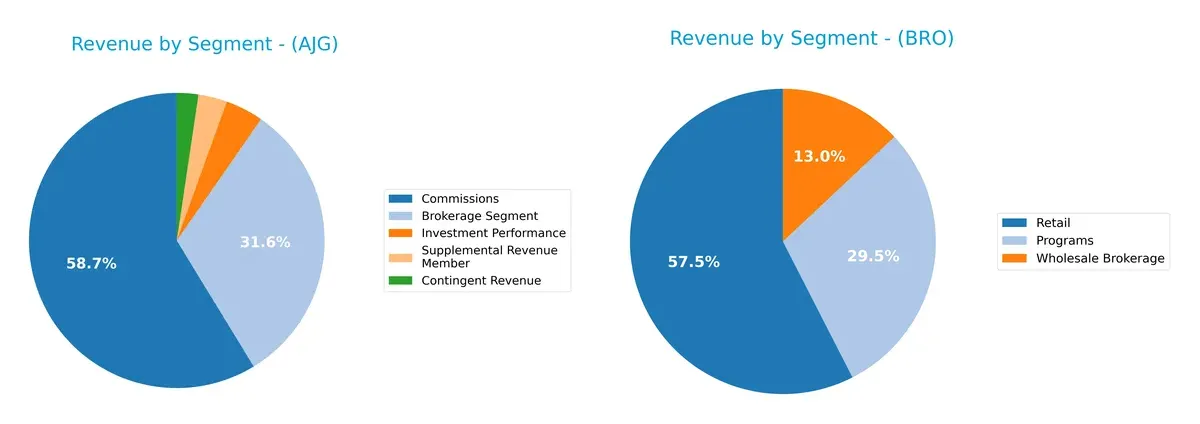
Arthur J. Gallagher & Co. anchors its revenue heavily on the Brokerage Segment, with $3.6B in 2024, showing a strong concentration risk. Brown & Brown diversifies more evenly, with Retail at $2.7B, Programs $1.4B, and Wholesale Brokerage $616M. This mix suggests Brown & Brown pivots on multiple customer channels, reducing dependency on one segment, while Gallagher relies on brokerage dominance, which could boost ecosystem lock-in but also vulnerability to market shifts.
Strengths and Weaknesses Comparison
This table compares the Strengths and Weaknesses of Arthur J. Gallagher & Co. (AJG) and Brown & Brown, Inc. (BRO):
AJG Strengths
- Diversified revenue streams across brokerage, commissions, and contingency segments
- Strong global presence with significant US and UK markets
- Favorable net margin at 10.72%
- Low debt-to-assets ratio and favorable debt/equity status
BRO Strengths
- Higher net margin at 17.7% denotes stronger profitability
- Favorable interest coverage ratio of 5.62 enhances financial stability
- Diversified segments including programs, retail, and wholesale brokerage
- Predominantly US market presence with growing UK and Canada revenues
AJG Weaknesses
- Unfavorable ROE and ROIC indicate weaker capital efficiency
- Poor liquidity ratios (current and quick ratio at zero) raise short-term risk concerns
- High P/E ratio (45.1) suggests overvaluation
- Asset turnover metrics unfavorable, indicating inefficient asset use
BRO Weaknesses
- Unfavorable ROE and ROIC reflect similar capital efficiency challenges
- Liquidity ratios also unfavorable, signaling potential short-term financial risk
- Dividend yield lower at 0.79% and rated unfavorable
- Asset turnover unfavorable, limiting operational efficiency
Overall, both companies face challenges in capital efficiency and liquidity. AJG shows a broader international footprint and more revenue diversification, while BRO delivers stronger profitability and interest coverage. These factors shape their strategic focus on balancing growth with financial health.
The Moat Duel: Analyzing Competitive Defensibility
A structural moat is the fortress that shields long-term profits from relentless competitive pressures. Here’s how two insurance brokers stack up:
Arthur J. Gallagher & Co.: Diverse Global Network & Service Breadth
Gallagher’s moat stems from its extensive international footprint and broad service offerings. This diversity supports stable margins near 18% EBIT and 11% net, though ROIC trends show caution. Expanding specialized brokerage services could reinforce this advantage in 2026.
Brown & Brown, Inc.: High-Margin Niche Expertise
Brown & Brown leverages strong niche programs and wholesale brokerage, reflected in a superior 28% EBIT margin and 18% net margin. Its focus on tailored insurance products fuels robust revenue growth, positioning it well for further market penetration and innovation.
Verdict: Network Diversity vs. Margin Superiority
Gallagher’s global scale offers a wider moat through geographic diversification. Brown & Brown’s higher margins signal a deeper moat in profitability. I see Brown & Brown better equipped to defend market share with focused expertise, while Gallagher’s breadth faces pressure from declining ROIC trends.
Which stock offers better returns?
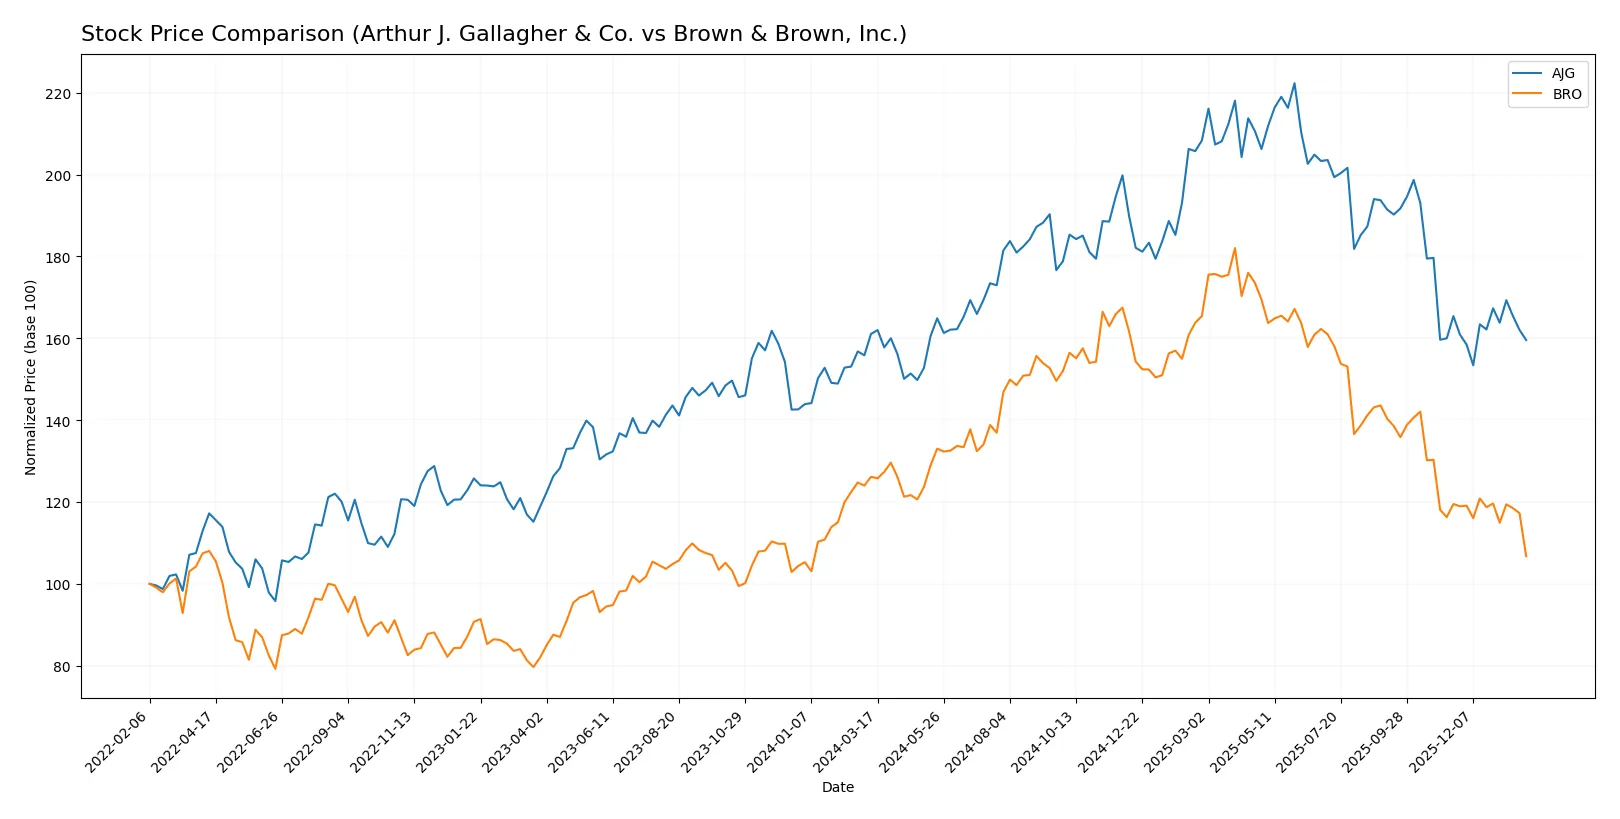
The past year shows both Arthur J. Gallagher & Co. and Brown & Brown, Inc. exhibiting bearish price trends, with notable price declines and shifting trading dynamics.
Trend Comparison
Arthur J. Gallagher & Co. experienced a mild bearish trend over 12 months with a -0.92% price change, accelerating downward and reaching a high of 347.44 and low of 234.11.
Brown & Brown, Inc. showed a stronger bearish trend with a -15.37% price drop over the same period, decelerating in decline, with a high of 122.93 and low of 72.1.
Arthur J. Gallagher & Co.’s decline was less severe than Brown & Brown, Inc., making AJG the better performer on a relative basis over the analyzed year.
Target Prices
Analysts present a clear target consensus for Arthur J. Gallagher & Co. and Brown & Brown, Inc., reflecting bullish expectations.
| Company | Target Low | Target High | Consensus |
|---|---|---|---|
| Arthur J. Gallagher & Co. | 247 | 334 | 282.38 |
| Brown & Brown, Inc. | 88 | 89 | 88.5 |
The consensus target for AJG at 282.38 suggests upside versus the current 249.37 price. BRO’s consensus near 88.5 also implies significant appreciation from the 72.1 stock price.

Don’t Let Luck Decide Your Entry Point
Optimize your entry points with our advanced ProRealTime indicators. You’ll get efficient buy signals with precise price targets for maximum performance. Start outperforming now!
How do institutions grade them?
Arthur J. Gallagher & Co. Grades
The latest grades from leading institutions on Arthur J. Gallagher & Co. are summarized below.
| Grading Company | Action | New Grade | Date |
|---|---|---|---|
| Piper Sandler | Maintain | Neutral | 2026-01-30 |
| Wells Fargo | Maintain | Overweight | 2026-01-30 |
| Keefe, Bruyette & Woods | Maintain | Market Perform | 2026-01-30 |
| Cantor Fitzgerald | Downgrade | Neutral | 2026-01-14 |
| Wells Fargo | Maintain | Overweight | 2026-01-13 |
| BMO Capital | Downgrade | Market Perform | 2026-01-13 |
| Barclays | Maintain | Underweight | 2026-01-08 |
| Piper Sandler | Downgrade | Neutral | 2026-01-07 |
| Keefe, Bruyette & Woods | Maintain | Market Perform | 2026-01-06 |
| Wells Fargo | Maintain | Overweight | 2025-12-23 |
Brown & Brown, Inc. Grades
Here are the recent institution grades for Brown & Brown, Inc.
| Grading Company | Action | New Grade | Date |
|---|---|---|---|
| BMO Capital | Maintain | Market Perform | 2026-01-29 |
| Keefe, Bruyette & Woods | Upgrade | Market Perform | 2026-01-29 |
| UBS | Maintain | Neutral | 2026-01-29 |
| Morgan Stanley | Maintain | Equal Weight | 2026-01-29 |
| Wells Fargo | Maintain | Equal Weight | 2026-01-28 |
| Mizuho | Maintain | Neutral | 2026-01-28 |
| Truist Securities | Maintain | Buy | 2026-01-28 |
| Jefferies | Maintain | Hold | 2026-01-28 |
| Citigroup | Downgrade | Neutral | 2026-01-28 |
| B of A Securities | Maintain | Neutral | 2026-01-27 |
Which company has the best grades?
Brown & Brown holds a more positive rating mix, including a “Buy” and multiple “Market Perform” upgrades. Arthur J. Gallagher shows more neutral and some downgrades. Investors might view Brown & Brown’s grades as signaling greater near-term confidence.
Risks specific to each company
The following categories identify critical pressure points and systemic threats facing both firms in the 2026 market environment:
1. Market & Competition
Arthur J. Gallagher & Co.
- Faces intense competition in insurance brokerage with pressure on fees and client retention.
Brown & Brown, Inc.
- Competes in diverse segments, leveraging specialized programs but confronts competitive pricing pressures.
2. Capital Structure & Debt
Arthur J. Gallagher & Co.
- Maintains a favorable debt-to-equity position but interest coverage is only neutral at 3.97x.
Brown & Brown, Inc.
- Stronger interest coverage at 5.62x supports debt servicing with a similarly favorable debt-to-equity profile.
3. Stock Volatility
Arthur J. Gallagher & Co.
- Exhibits lower beta at 0.675, indicating less sensitivity to market swings.
Brown & Brown, Inc.
- Higher beta of 0.812 suggests greater stock price volatility relative to the market.
4. Regulatory & Legal
Arthur J. Gallagher & Co.
- Subject to evolving insurance regulations across multiple jurisdictions, increasing compliance complexity.
Brown & Brown, Inc.
- Faces similar regulatory risks with additional exposure in specialized insurance sectors requiring strict oversight.
5. Supply Chain & Operations
Arthur J. Gallagher & Co.
- Operates a broad network of brokers, which may complicate operational control and efficiency.
Brown & Brown, Inc.
- Relies on independent agents for distribution, potentially creating operational dependency risks.
6. ESG & Climate Transition
Arthur J. Gallagher & Co.
- Increasing pressure to integrate ESG metrics into underwriting and risk management practices.
Brown & Brown, Inc.
- Faces rising demands for climate risk disclosure and sustainable insurance products.
7. Geopolitical Exposure
Arthur J. Gallagher & Co.
- Global presence in diverse markets exposes it to geopolitical uncertainties and currency risks.
Brown & Brown, Inc.
- Concentrated mostly in North America and select foreign markets, limiting but not eliminating geopolitical risk.
Which company shows a better risk-adjusted profile?
Arthur J. Gallagher’s most significant risk lies in operational complexity from its global, multi-jurisdictional footprint. Brown & Brown’s key risk is higher stock volatility combined with regulatory challenges in niche markets. Both show slightly unfavorable financial ratios, but Brown & Brown’s stronger interest coverage and moderate Piotroski score suggest a marginally better risk-adjusted profile. Notably, Arthur J. Gallagher’s Altman Z-score deep in the distress zone highlights urgent financial stability concerns.
Final Verdict: Which stock to choose?
Arthur J. Gallagher & Co. (AJG) excels as a cash-generating powerhouse with resilient revenue growth and efficient capital allocation. Its main point of vigilance lies in a declining ROIC trend, which could pressure long-term value creation. AJG suits portfolios aiming for aggressive growth with a tolerance for operational shifts.
Brown & Brown, Inc. (BRO) commands a strategic moat built on high margins and impressive recurring revenue stability. Its stronger interest coverage ratio and conservative debt profile offer better safety compared to AJG. BRO fits well within GARP (Growth at a Reasonable Price) portfolios seeking steady expansion and moderate risk.
If you prioritize high-growth potential and can accept operational variability, AJG is the compelling choice due to its robust top-line momentum and cash flow generation. However, if you seek better stability and margin resilience with a more conservative risk profile, BRO offers superior financial safety and strategic durability. Both stocks present slightly unfavorable ratio profiles, so careful risk assessment is essential.
Disclaimer: Investment carries a risk of loss of initial capital. The past performance is not a reliable indicator of future results. Be sure to understand risks before making an investment decision.
Go Further
I encourage you to read the complete analyses of Arthur J. Gallagher & Co. and Brown & Brown, Inc. to enhance your investment decisions: