In today’s rapidly evolving cybersecurity landscape, Zscaler, Inc. and Arqit Quantum Inc. stand out as innovative players in software infrastructure. Zscaler leads with cloud-based security solutions worldwide, while Arqit pioneers quantum encryption technology from the UK. Both companies target the growing demand for secure digital environments, yet their strategies and scales differ significantly. This article will help you decide which company is the more compelling investment opportunity in 2026.
Table of contents
Companies Overview
I will begin the comparison between Zscaler and Arqit Quantum by providing an overview of these two companies and their main differences.
Zscaler Overview
Zscaler, Inc. is a global cloud security company headquartered in San Jose, California. Its mission focuses on providing secure access to applications and data across the internet and private clouds through solutions like Zscaler Internet Access and Zscaler Private Access. The company serves a broad range of industries including finance, healthcare, and technology, positioning itself as a key player in infrastructure software with a market cap of $34B.
Arqit Quantum Overview
Arqit Quantum Inc., based in London, UK, operates in the cybersecurity sector using satellite and terrestrial platforms. It offers QuantumCloud, a technology that enables secure encryption key creation between devices via lightweight software agents. With a smaller workforce of 82 employees and a market cap of $416M, Arqit targets a niche within infrastructure software focused on advanced quantum encryption solutions.
Key similarities and differences
Both Zscaler and Arqit Quantum operate within the software infrastructure sector, emphasizing cybersecurity solutions. However, Zscaler has a broader market reach and a comprehensive cloud security platform serving multiple industries globally, while Arqit concentrates on quantum encryption technology with a more specialized product. The companies differ significantly in scale, with Zscaler’s market cap and employee count far exceeding those of Arqit.
Income Statement Comparison
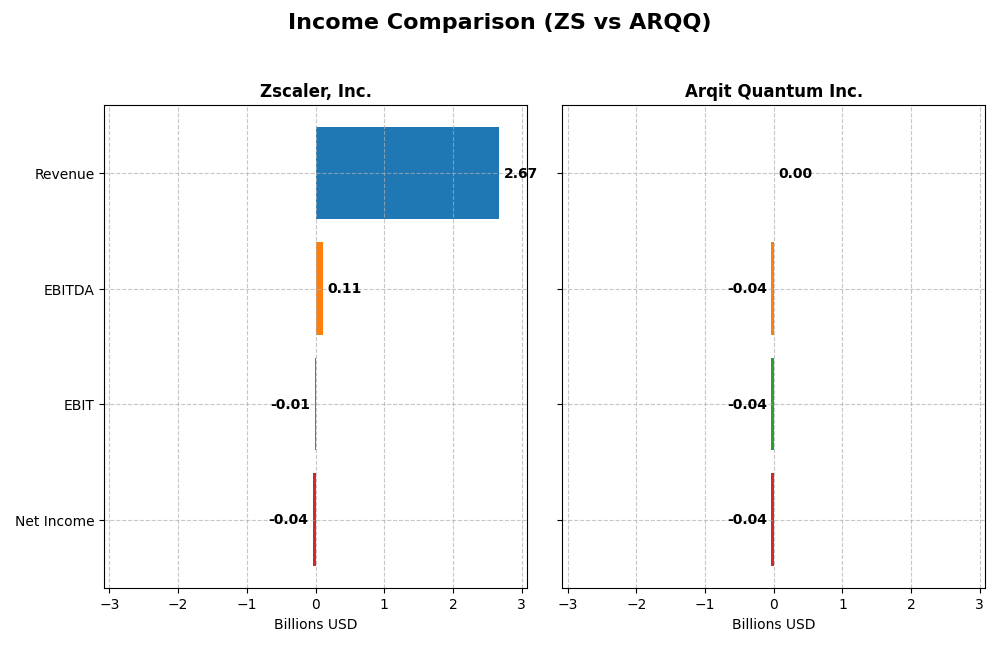
Below is a side-by-side comparison of key income statement metrics for Zscaler, Inc. and Arqit Quantum Inc. for the most recent fiscal year 2025.
| Metric | Zscaler, Inc. (ZS) | Arqit Quantum Inc. (ARQQ) |
|---|---|---|
| Market Cap | 34.1B | 416M |
| Revenue | 2.67B | 530K |
| EBITDA | 112M | -36.8M |
| EBIT | -8.8M | -37.6M |
| Net Income | -41.5M | -35.3M |
| EPS | -0.27 | -2.56 |
| Fiscal Year | 2025 | 2025 |
Income Statement Interpretations
Zscaler, Inc.
Zscaler’s revenue grew significantly from $673M in 2021 to $2.67B in 2025, with net income losses narrowing from -$262M to -$41M. Gross margin remained strong around 77%, while EBIT and net margins were negative but improving. In 2025, revenue growth slowed to 23.3%, but profitability metrics showed favorable improvement, indicating strengthening operational efficiency.
Arqit Quantum Inc.
Arqit’s revenue rose steeply from $48K in 2021 to $530K in 2025, with net losses shrinking from -$272M to -$35M. Gross margin stayed deeply negative, reflecting high costs relative to revenue, and EBIT margin remained very unfavorable. Despite significant revenue growth of 80.9% in 2025, operating losses widened, signaling ongoing challenges in scaling profitably.
Which one has the stronger fundamentals?
Zscaler demonstrates stronger fundamentals, supported by robust revenue growth, a high gross margin near 77%, and consistent improvement in operating and net margins. Arqit shows impressive revenue growth but suffers from persistent negative margins and high operating expenses. Zscaler’s better margin control and narrowing losses suggest comparatively stronger financial health.
Financial Ratios Comparison
The table below presents the latest key financial ratios for Zscaler, Inc. (ZS) and Arqit Quantum Inc. (ARQQ) based on their fiscal year 2025 data, facilitating a straightforward comparison of their financial health and performance.
| Ratios | Zscaler, Inc. (ZS) | Arqit Quantum Inc. (ARQQ) |
|---|---|---|
| ROE | -2.31% | -129.77% |
| ROIC | -3.18% | -127.45% |
| P/E | -1063 | -15.12 |
| P/B | 24.51 | 19.62 |
| Current Ratio | 2.01 | 2.69 |
| Quick Ratio | 2.01 | 2.69 |
| D/E (Debt-to-Equity) | 1.00 | 0.03 |
| Debt-to-Assets | 27.98% | 1.68% |
| Interest Coverage | -13.49 | -802.90 |
| Asset Turnover | 0.42 | 0.01 |
| Fixed Asset Turnover | 4.22 | 0.74 |
| Payout ratio | 0 | 0 |
| Dividend yield | 0% | 0% |
Interpretation of the Ratios
Zscaler, Inc.
Zscaler shows a mixed ratio profile with favorable liquidity ratios (current and quick ratios at 2.01) and a conservative debt-to-assets ratio of 27.98%. However, profitability metrics such as net margin (-1.55%), ROE (-2.31%), and ROIC (-3.18%) are unfavorable, indicating ongoing operational challenges. The company does not pay dividends, likely prioritizing reinvestment and growth over shareholder payouts.
Arqit Quantum Inc.
Arqit Quantum presents mostly unfavorable profitability ratios, including a significantly negative net margin (-6668.49%), ROE (-129.77%), and ROIC (-127.45%). Its liquidity position is solid with a current ratio of 2.69 and low leverage (debt-to-assets at 1.68%). Like Zscaler, it pays no dividends, consistent with a focus on growth, R&D, and capital preservation in a high-risk phase.
Which one has the best ratios?
Comparing both, Zscaler maintains a slightly more balanced ratio set with better asset turnover and manageable debt levels, while Arqit Quantum suffers from more severe profitability weaknesses and higher risk indicators. Zscaler’s ratios are slightly unfavorable overall, whereas Arqit’s are clearly unfavorable, suggesting Zscaler holds relatively stronger financial metrics.
Strategic Positioning
This section compares the strategic positioning of Zscaler, Inc. and Arqit Quantum Inc., focusing on market position, key segments, and exposure to disruption:
Zscaler, Inc.
- Large market cap (34B) with established presence in cloud security; faces competition in software infrastructure.
- Focuses on cloud security solutions across multiple industries with products like Internet Access and Private Access.
- Operates in a rapidly evolving tech space but offers mature cloud security; potential disruption from new cyber tech.
Arqit Quantum Inc.
- Small market cap (416M); emerging player in cybersecurity using satellite and terrestrial platforms.
- Concentrates on quantum encryption technology targeting device security via QuantumCloud software agents.
- Positioned in innovative quantum encryption, a nascent field with high disruption potential but early adoption risks.
Zscaler, Inc. vs Arqit Quantum Inc. Positioning
Zscaler exhibits a diversified approach with a broad product portfolio serving many industries, offering scale advantages. Arqit is concentrated on pioneering quantum encryption, which entails higher risk but potential for unique market positioning based on novel technology.
Which has the best competitive advantage?
Both companies show slightly unfavorable moat evaluations, shedding value but improving profitability. Zscaler’s larger scale and diversified portfolio contrast with Arqit’s niche quantum focus; however, neither currently demonstrates a strong sustainable competitive advantage.
Stock Comparison
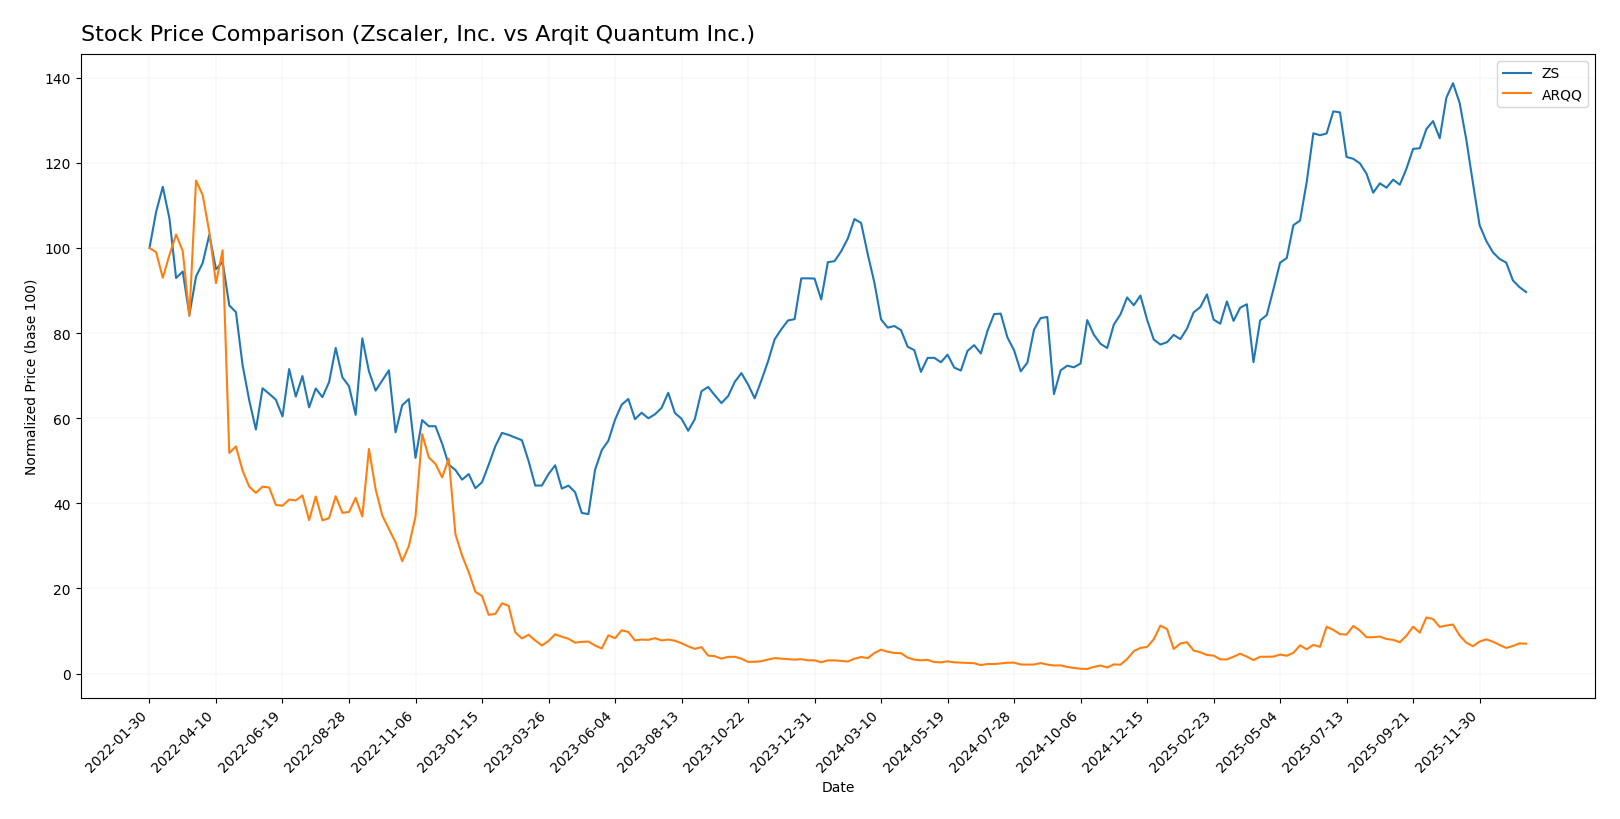
The stock price movements of Zscaler, Inc. and Arqit Quantum Inc. over the past 12 months reveal contrasting trends, with notable price volatility and shifts in trading dynamics impacting their market performance.
Trend Analysis
Zscaler, Inc. (ZS) exhibited a bearish trend over the past year, with a price decline of 9.03%, decelerating after reaching a high of 331.14 and a low of 156.78, accompanied by high volatility (47.11 std deviation).
Arqit Quantum Inc. (ARQQ) showed a bullish trend with a 93.6% price increase over the same period, though its upward momentum decelerated. The stock traded between 4.19 and 49.92, with lower volatility (11.75 std deviation).
Comparing the two, ARQQ delivered significantly higher market performance than ZS, despite both experiencing recent short-term declines and seller dominance in volume.
Target Prices
The current analyst consensus shows promising upside potential for both Zscaler, Inc. and Arqit Quantum Inc.
| Company | Target High | Target Low | Consensus |
|---|---|---|---|
| Zscaler, Inc. | 360 | 260 | 311.41 |
| Arqit Quantum Inc. | 60 | 60 | 60 |
Analysts expect Zscaler to trade significantly above its current price of $213.98, indicating potential growth. Arqit’s target consensus at $60 also suggests a strong upside from its current $26.60 price, reflecting high growth expectations.
Analyst Opinions Comparison
This section compares analysts’ ratings and financial scores for Zscaler, Inc. (ZS) and Arqit Quantum Inc. (ARQQ):
Rating Comparison
ZS Rating
- Rating: C-; status very favorable.
- Discounted Cash Flow Score: 4; favorable.
- ROE Score: 1; very unfavorable.
- ROA Score: 1; very unfavorable.
- Debt To Equity Score: 1; very unfavorable.
- Overall Score: 1; very unfavorable.
ARQQ Rating
- Rating: C; status very favorable.
- Discounted Cash Flow Score: 2; moderate.
- ROE Score: 1; very unfavorable.
- ROA Score: 1; very unfavorable.
- Debt To Equity Score: 4; favorable.
- Overall Score: 2; moderate.
Which one is the best rated?
Based on the data, ARQQ holds a slightly better overall score (2 moderate vs. 1 very unfavorable) and a stronger debt-to-equity score, while ZS shows a higher discounted cash flow score. Both have equally low ROE and ROA scores.
Scores Comparison
Here is a comparison of the financial scores between Zscaler, Inc. and Arqit Quantum Inc.:
ZS Scores
- Altman Z-Score: 4.89, indicating a safe zone, low bankruptcy risk
- Piotroski Score: 3, classified as very weak financial strength
ARQQ Scores
- Altman Z-Score: -0.22, indicating distress zone, high bankruptcy risk
- Piotroski Score: 2, also classified as very weak financial strength
Which company has the best scores?
ZS shows a significantly stronger Altman Z-Score, placing it in a safe zone, whereas ARQQ is in distress. Both companies have very weak Piotroski Scores, with ZS slightly higher. Overall, ZS’s scores indicate better financial stability based on the data.
Grades Comparison
Here is a detailed comparison of recent grades for Zscaler, Inc. and Arqit Quantum Inc.:
Zscaler, Inc. Grades
The following table summarizes grades assigned by reputable financial institutions to Zscaler, Inc.:
| Grading Company | Action | New Grade | Date |
|---|---|---|---|
| Citigroup | Maintain | Buy | 2026-01-13 |
| Keybanc | Maintain | Overweight | 2026-01-12 |
| Piper Sandler | Maintain | Neutral | 2026-01-05 |
| RBC Capital | Maintain | Outperform | 2026-01-05 |
| Mizuho | Upgrade | Outperform | 2025-12-16 |
| Bernstein | Downgrade | Market Perform | 2025-12-01 |
| Citigroup | Maintain | Buy | 2025-12-01 |
| JP Morgan | Maintain | Overweight | 2025-11-26 |
| Baird | Maintain | Outperform | 2025-11-26 |
| BTIG | Maintain | Buy | 2025-11-26 |
Zscaler’s grades show a generally positive trend, with multiple “Buy,” “Outperform,” and “Overweight” ratings maintained or upgraded recently, indicating cautious optimism among analysts.
Arqit Quantum Inc. Grades
The following table shows grades issued by HC Wainwright & Co. for Arqit Quantum Inc.:
| Grading Company | Action | New Grade | Date |
|---|---|---|---|
| HC Wainwright & Co. | Maintain | Buy | 2025-10-13 |
| HC Wainwright & Co. | Maintain | Buy | 2025-09-18 |
| HC Wainwright & Co. | Maintain | Buy | 2024-12-31 |
| HC Wainwright & Co. | Maintain | Buy | 2024-12-06 |
| HC Wainwright & Co. | Maintain | Buy | 2024-07-11 |
| HC Wainwright & Co. | Maintain | Buy | 2024-05-29 |
| HC Wainwright & Co. | Maintain | Buy | 2024-05-15 |
| HC Wainwright & Co. | Maintain | Buy | 2023-11-22 |
| HC Wainwright & Co. | Maintain | Buy | 2023-09-27 |
| HC Wainwright & Co. | Maintain | Buy | 2023-09-26 |
All grades for Arqit Quantum are consistently “Buy” from a single grading company, showing stable but less diversified analyst coverage.
Which company has the best grades?
Zscaler benefits from a broader range of reputable grading companies with mostly positive and some upgraded ratings, indicating stronger analyst confidence. Arqit Quantum’s consistent “Buy” ratings come exclusively from one source, which may reflect less consensus or coverage. Investors might interpret Zscaler’s varied but predominantly positive grades as a sign of more robust market appraisal.
Strengths and Weaknesses
Below is a comparison of key strengths and weaknesses for Zscaler, Inc. (ZS) and Arqit Quantum Inc. (ARQQ) based on the most recent financial and operational data available for 2025.
| Criterion | Zscaler, Inc. (ZS) | Arqit Quantum Inc. (ARQQ) |
|---|---|---|
| Diversification | Focused on cloud security, moderate product range | Narrow focus on quantum encryption technology |
| Profitability | Unfavorable net margin (-1.55%), ROIC (-3.18%), growing profitability trend but currently shedding value | Very unfavorable net margin (-6668%), ROIC (-127%), shedding value but ROIC improving slightly |
| Innovation | Strong innovation in cloud security platform, steady ROIC improvement (+76%) | High innovation potential in quantum tech, but financials reflect early-stage losses |
| Global presence | Large global footprint with strong market penetration | Limited global presence due to emerging tech stage |
| Market Share | Significant share in cloud security market, $2.67B revenue in 2025 | Small market share, no reported revenue in 2025 |
Key takeaways: Both companies are currently shedding value with negative profitability metrics but show growing ROIC trends indicating improving operational efficiency. Zscaler benefits from a solid global presence and established market share in cloud security, whereas Arqit is still in an early growth phase with promising innovation but limited revenue and market footprint. Investors should weigh Zscaler’s more mature business against Arqit’s higher risk and potential reward profile.
Risk Analysis
Below is a comparative table highlighting key risk metrics for Zscaler, Inc. (ZS) and Arqit Quantum Inc. (ARQQ) based on the most recent data from 2025:
| Metric | Zscaler, Inc. (ZS) | Arqit Quantum Inc. (ARQQ) |
|---|---|---|
| Market Risk | Beta 1.02, moderate volatility | Beta 2.41, high volatility |
| Debt Level | Debt-to-Equity 1.0 (neutral) | Debt-to-Equity 0.03 (low, favorable) |
| Regulatory Risk | US-based, subject to tech sector regulations | UK-based, evolving quantum tech regulations |
| Operational Risk | Large scale, 7.3K employees, stable operations | Small scale, 82 employees, higher execution risk |
| Environmental Risk | Moderate, standard tech footprint | Low, less resource-intensive tech |
| Geopolitical Risk | US-focused, moderate exposure | UK-based with potential Brexit-related risks |
The most significant risks for Zscaler stem from moderate market volatility and operational challenges tied to scale, with some financial pressure reflected in unfavorable profitability ratios. Arqit faces higher market risk due to its elevated beta and distress warning from a low Altman Z-score, signaling bankruptcy risk. Its low debt is a strength but operational and regulatory uncertainties in the emerging quantum cybersecurity field pose impactful risks. Investors should weigh Zscaler’s stability against Arqit’s higher risk, higher potential profile.
Which Stock to Choose?
Zscaler, Inc. (ZS) has shown favorable income growth with a 297% revenue increase over five years and improving profitability despite a negative net margin of -1.55%. Its financial ratios are slightly unfavorable overall, with a strong current ratio of 2.01 but weaknesses in ROE and asset turnover. The company carries moderate debt and holds a very favorable rating of C-.
Arqit Quantum Inc. (ARQQ) exhibits rapid revenue growth of 1006% over five years but suffers from significant unprofitability, reflected in a severe net margin of -6668.49%. Its financial ratios are largely unfavorable, although it maintains low debt levels and a favorable current ratio of 2.69. The company holds a very favorable rating of C but is in the distress zone per its Altman Z-Score.
The choice between ZS and ARQQ could depend on investor risk tolerance and strategy. Those with a higher risk appetite and focus on rapid growth might find ARQQ’s strong revenue expansion and improving ROIC trend appealing despite profitability challenges. Conversely, investors prioritizing more stable financial health and moderate growth could perceive ZS’s improving income statement and current rating as more favorable.
Disclaimer: Investment carries a risk of loss of initial capital. The past performance is not a reliable indicator of future results. Be sure to understand risks before making an investment decision.
Go Further
I encourage you to read the complete analyses of Zscaler, Inc. and Arqit Quantum Inc. to enhance your investment decisions: