In today’s fast-evolving technology landscape, Wix.com Ltd. and Arqit Quantum Inc. stand out as innovators within the software infrastructure sector. Wix dominates web development with its extensive cloud-based platform, while Arqit pioneers quantum-enhanced cybersecurity solutions. Despite their different focuses, both companies leverage cutting-edge technology to disrupt traditional markets. This article will guide you through their strengths and risks to identify which presents the most compelling investment opportunity.

Table of contents
Companies Overview
I will begin the comparison between Wix.com Ltd. and Arqit Quantum Inc. by providing an overview of these two companies and their main differences.
Wix.com Ltd. Overview
Wix.com Ltd. develops and markets a cloud-based platform that enables users worldwide to create websites and web applications. Its offerings include a drag-and-drop editor, AI-powered website creation, payment solutions, and a range of business tools. Headquartered in Tel Aviv, Israel, Wix serves 222M registered users with 6M premium subscriptions, positioning itself as a leader in accessible web infrastructure.
Arqit Quantum Inc. Overview
Arqit Quantum Inc., based in London, UK, focuses on cybersecurity services through satellite and terrestrial platforms. Its flagship product, QuantumCloud, facilitates secure encryption key generation across devices via lightweight software agents. With 82 employees, Arqit aims to innovate in the software infrastructure sector, emphasizing quantum-enhanced security solutions.
Key similarities and differences
Both Wix and Arqit operate in the software infrastructure industry but serve different market needs: Wix specializes in website creation and digital business tools, while Arqit focuses on cybersecurity technology. Wix has a significantly larger user base and market cap (4.46B vs. 416M), reflecting its broader consumer reach compared to Arqit’s niche quantum security focus. Their geographic bases also differ, with Wix in Israel and Arqit in the UK.
Income Statement Comparison
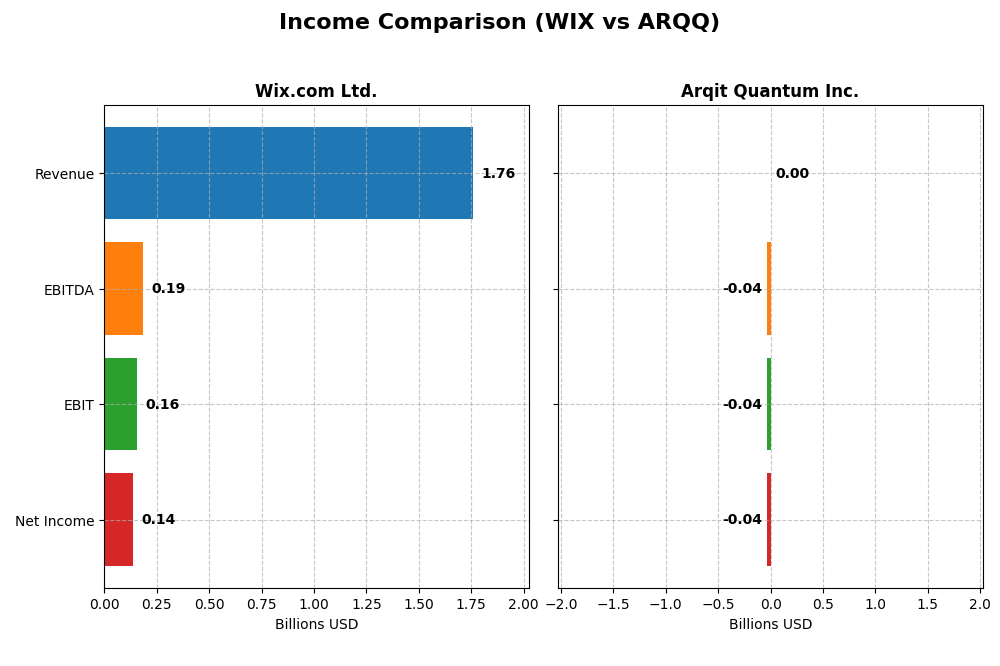
The table below provides a side-by-side comparison of the most recent fiscal year income statement metrics for Wix.com Ltd. and Arqit Quantum Inc.
| Metric | Wix.com Ltd. (WIX) | Arqit Quantum Inc. (ARQQ) |
|---|---|---|
| Market Cap | 4.46B | 416M |
| Revenue | 1.76B | 530K |
| EBITDA | 186M | -36.8M |
| EBIT | 155M | -37.6M |
| Net Income | 138M | -35.3M |
| EPS | 2.49 | -2.56 |
| Fiscal Year | 2024 | 2025 |
Income Statement Interpretations
Wix.com Ltd.
Wix.com Ltd. has demonstrated consistent revenue growth from $984M in 2020 to $1.76B in 2024, with net income turning positive and rising sharply to $138M in 2024. Gross margins remained strong around 68%, while EBIT margin stayed neutral at 8.8%. The most recent year saw favorable growth in revenue (+12.7%) and substantial improvements in net margin and EPS, reflecting operational efficiency gains.
Arqit Quantum Inc.
Arqit Quantum’s revenue increased significantly from $48K in 2021 to $530K in 2025, alongside a net income improvement from a loss of $272M to a smaller loss of $35M in 2025. However, gross and EBIT margins remain deeply negative, reflecting ongoing high costs relative to revenue. Despite unfavorable margins, recent revenue growth (+80.9%) and net margin improvements suggest progress toward profitability.
Which one has the stronger fundamentals?
Wix.com Ltd. exhibits stronger fundamentals with consistently positive gross and net margins, sustainable revenue growth, and improving profitability metrics. Arqit Quantum shows rapid top-line expansion but continues to face significant margin challenges and net losses. Wix’s stable margins and positive net income contrast with Arqit’s ongoing operating losses, indicating a more mature and financially sound position for Wix.
Financial Ratios Comparison
The table below presents a side-by-side comparison of key financial ratios for Wix.com Ltd. and Arqit Quantum Inc. based on their most recent fiscal year data.
| Ratios | Wix.com Ltd. (2024) | Arqit Quantum Inc. (2025) |
|---|---|---|
| ROE | -1.76 | -1.30 |
| ROIC | 9.13% | -127.45% |
| P/E | 86.21 | -15.12 |
| P/B | -151.35 | 19.62 |
| Current Ratio | 0.84 | 2.69 |
| Quick Ratio | 0.84 | 2.69 |
| D/E | -12.31 | 0.03 |
| Debt-to-Assets | 50.70% | 1.68% |
| Interest Coverage | 25.92 | -802.90 |
| Asset Turnover | 0.92 | 0.01 |
| Fixed Asset Turnover | 3.33 | 0.74 |
| Payout ratio | 0 | 0 |
| Dividend yield | 0 | 0 |
Interpretation of the Ratios
Wix.com Ltd.
Wix.com Ltd. shows a mixed ratio profile with some strengths like a favorable interest coverage of 40.14 and a strong fixed asset turnover at 3.33, but concerns such as a low current ratio of 0.84 and a negative return on equity at -175.57%. The company does not pay dividends, likely prioritizing reinvestment and growth given its negative payout and yield.
Arqit Quantum Inc.
Arqit Quantum Inc. presents predominantly unfavorable ratios, including a severely negative net margin of -6668.49% and ROE of -129.77%, despite a favorable current ratio of 2.69 and low debt levels. The firm also does not pay dividends, consistent with its losses and focus on R&D and growth in a high-risk phase.
Which one has the best ratios?
Comparing the two, Wix.com Ltd. shows a slightly unfavorable but more balanced ratio set with some operational strengths, whereas Arqit Quantum Inc. displays a more unfavorable profile with deep losses and weak profitability indicators. Wix’s ratios suggest a more stable financial footing relative to Arqit’s high-risk metrics.
Strategic Positioning
This section compares the strategic positioning of Wix.com Ltd. and Arqit Quantum Inc. in terms of market position, key segments, and exposure to technological disruption:
Wix.com Ltd.
- Established global cloud-based platform with 222M users; faces competition in software infrastructure.
- Key segments include Creative Subscription and Business Solutions driving revenue growth; diversified product suite.
- Offers AI-driven tools and diverse web services; moderate exposure to disruption through innovation in digital platforms.
Arqit Quantum Inc.
- UK-based cybersecurity provider with niche satellite and terrestrial encryption solutions; smaller scale.
- Focused on QuantumCloud encryption software, addressing cybersecurity needs in specific markets.
- Relies on emerging quantum encryption technology; high exposure to disruption from rapid tech advances.
Wix.com Ltd. vs Arqit Quantum Inc. Positioning
Wix has a diversified business model with multiple revenue streams from subscriptions and business solutions, providing scale and market reach. Arqit is more concentrated, focusing on innovative quantum cybersecurity, which could imply higher risk and growth potential but less diversification.
Which has the best competitive advantage?
Both companies show slightly unfavorable MOAT evaluations, indicating value destruction despite improving profitability. Wix’s larger scale and diversified offerings contrast with Arqit’s niche focus, but neither currently demonstrates a strong competitive advantage based on ROIC versus WACC.
Stock Comparison
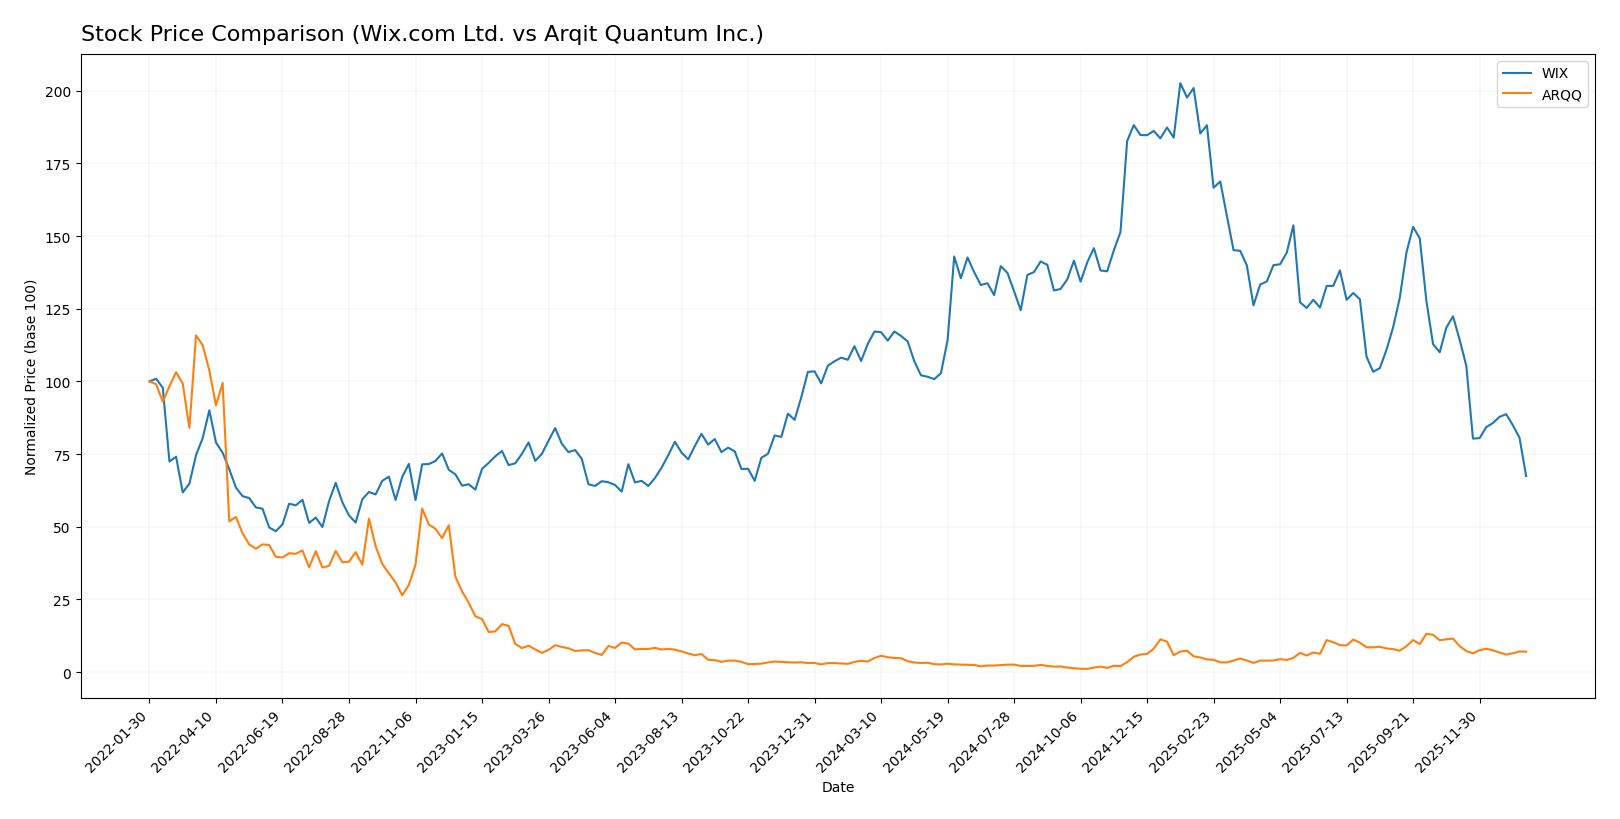
The stock price movements of Wix.com Ltd. (WIX) and Arqit Quantum Inc. (ARQQ) over the past 12 months reveal contrasting trends, with WIX experiencing a significant decline and ARQQ showing robust growth before recent weakening.
Trend Analysis
Wix.com Ltd. (WIX) exhibited a bearish trend over the past year, with a price decline of -40.28%. The trend shows deceleration and high volatility, with prices ranging from 240.89 at the high to 80.16 at the low.
Arqit Quantum Inc. (ARQQ) recorded a bullish trend over the same period, gaining 93.6%. Despite this growth, the trend is decelerating, and recent months saw a notable price drop of -39.03%.
Comparing the two, ARQQ delivered the highest market performance with a strong overall gain of +93.6%, contrasting with WIX’s significant decline of -40.28% over the past year.
Target Prices
The current analyst consensus reveals a bullish outlook for Wix.com Ltd. and a stable expectation for Arqit Quantum Inc.
| Company | Target High | Target Low | Consensus |
|---|---|---|---|
| Wix.com Ltd. | 210 | 70 | 160.27 |
| Arqit Quantum Inc. | 60 | 60 | 60 |
Analysts expect Wix.com Ltd.’s stock to appreciate significantly above its current price of 80.16 USD, indicating strong growth potential. Arqit Quantum Inc.’s consensus target of 60 USD suggests a potential near-term price doubling from its current 26.6 USD.
Analyst Opinions Comparison
This section compares analysts’ ratings and financial scores for Wix.com Ltd. and Arqit Quantum Inc.:
Rating Comparison
WIX Rating
- Rating: Both companies have a “C” rating, classified as Very Favorable.
- Discounted Cash Flow Score: Moderate at 3, indicating fair valuation outlook.
- ROE Score: Very Unfavorable at 1, showing low efficiency in generating equity returns.
- ROA Score: Favorable at 4, reflecting strong asset utilization.
- Debt To Equity Score: Very Unfavorable at 1, denoting higher financial risk.
- Overall Score: Moderate at 2, representing an average financial standing.
ARQQ Rating
- Rating: Both companies have a “C” rating, classified as Very Favorable.
- Discounted Cash Flow Score: Moderate at 2, suggesting a slightly less favorable valuation.
- ROE Score: Very Unfavorable at 1, also indicating weak profitability from equity.
- ROA Score: Very Unfavorable at 1, indicating poor asset efficiency.
- Debt To Equity Score: Favorable at 4, indicating a stronger balance sheet with lower risk.
- Overall Score: Moderate at 2, reflecting similar overall financial health.
Which one is the best rated?
Both Wix and Arqit share the same overall rating and score, but Wix shows stronger asset utilization (ROA) while Arqit demonstrates better financial stability with a more favorable debt-to-equity score.
Scores Comparison
Here is a comparison of the Altman Z-Score and Piotroski Score for both companies:
WIX Scores
- Altman Z-Score: 1.83, in the grey zone indicating moderate bankruptcy risk.
- Piotroski Score: 6, considered average financial strength.
ARQQ Scores
- Altman Z-Score: -0.22, in the distress zone signaling high bankruptcy risk.
- Piotroski Score: 2, indicating very weak financial health.
Which company has the best scores?
Wix.com Ltd. shows better scores with a grey zone Altman Z-Score and an average Piotroski Score. Arqit Quantum Inc. has a distress zone Altman Z-Score and a very weak Piotroski Score, reflecting higher financial risk.
Grades Comparison
The grades and ratings for Wix.com Ltd. and Arqit Quantum Inc. from reputable grading firms are as follows:
Wix.com Ltd. Grades
The table below shows recent grades from established financial institutions for Wix.com Ltd.:
| Grading Company | Action | New Grade | Date |
|---|---|---|---|
| Morgan Stanley | Maintain | Overweight | 2026-01-15 |
| Wells Fargo | Maintain | Overweight | 2025-12-19 |
| Cantor Fitzgerald | Maintain | Overweight | 2025-12-11 |
| Wells Fargo | Maintain | Overweight | 2025-11-20 |
| Barclays | Maintain | Overweight | 2025-11-20 |
| Citizens | Maintain | Market Outperform | 2025-11-20 |
| Citigroup | Maintain | Buy | 2025-11-20 |
| Scotiabank | Maintain | Sector Outperform | 2025-11-20 |
| Needham | Maintain | Buy | 2025-11-20 |
| Evercore ISI Group | Maintain | Outperform | 2025-11-20 |
Overall, Wix.com Ltd. shows a consistently positive outlook with multiple “Overweight,” “Buy,” and “Outperform” grades maintained by top-tier banks.
Arqit Quantum Inc. Grades
The table below presents recent grades by a recognized grading company for Arqit Quantum Inc.:
| Grading Company | Action | New Grade | Date |
|---|---|---|---|
| HC Wainwright & Co. | Maintain | Buy | 2025-10-13 |
| HC Wainwright & Co. | Maintain | Buy | 2025-09-18 |
| HC Wainwright & Co. | Maintain | Buy | 2024-12-31 |
| HC Wainwright & Co. | Maintain | Buy | 2024-12-06 |
| HC Wainwright & Co. | Maintain | Buy | 2024-07-11 |
| HC Wainwright & Co. | Maintain | Buy | 2024-05-29 |
| HC Wainwright & Co. | Maintain | Buy | 2024-05-15 |
| HC Wainwright & Co. | Maintain | Buy | 2023-11-22 |
| HC Wainwright & Co. | Maintain | Buy | 2023-09-27 |
| HC Wainwright & Co. | Maintain | Buy | 2023-09-26 |
Arqit Quantum Inc. consistently holds a “Buy” rating from HC Wainwright & Co., indicating stable confidence from this single source.
Which company has the best grades?
Wix.com Ltd. benefits from a broader range of top-tier grading companies consistently issuing “Overweight,” “Buy,” and “Outperform” ratings, suggesting stronger and more diversified analyst confidence. Arqit Quantum Inc. holds a steady “Buy” rating but from only one grading firm, which may imply less analyst coverage and diversification in opinion. Investors might consider the breadth and consistency of grades when assessing analyst sentiment.
Strengths and Weaknesses
Below is a comparison of key strengths and weaknesses for Wix.com Ltd. (WIX) and Arqit Quantum Inc. (ARQQ) based on the most recent financial and operational data.
| Criterion | Wix.com Ltd. (WIX) | Arqit Quantum Inc. (ARQQ) |
|---|---|---|
| Diversification | Moderate: Revenue from Business Solutions (495M) and Creative Subscription (1.26B) offers product variety | Limited: Primarily focused on quantum encryption technology, less diversified |
| Profitability | Neutral: ROIC near WACC at 9.13%, net margin 7.86%, but unfavorable ROE (-175%) | Unfavorable: Negative margins (-6668%), ROIC (-127%), and ROE (-130%) |
| Innovation | Moderate: Growing ROIC trend (+159%) indicates improving operational efficiency and innovation | Moderate: Growing ROIC trend (+29%), yet overall value destruction persists |
| Global presence | Strong: Established global user base and platform reach | Emerging: Still in early development stages with limited market penetration |
| Market Share | Established player in website building and business solutions | Niche market with potential but currently low market share |
Key takeaways: Wix.com shows a balanced revenue base with improving profitability trends despite some financial weaknesses. Arqit Quantum faces significant profitability challenges but displays growth potential through innovation in a specialized tech niche. Investors should weigh Wix’s more stable position against Arqit’s higher risk and future opportunity.
Risk Analysis
Below is a comparative table of key risks for Wix.com Ltd. (WIX) and Arqit Quantum Inc. (ARQQ) based on the most recent data from 2025-2026:
| Metric | Wix.com Ltd. (WIX) | Arqit Quantum Inc. (ARQQ) |
|---|---|---|
| Market Risk | Beta 1.42 (moderate volatility) | Beta 2.41 (high volatility) |
| Debt level | Debt-to-assets 50.7% (high) | Debt-to-assets 1.68% (very low) |
| Regulatory Risk | Moderate (tech sector, global operations) | Moderate to high (UK cybersecurity, emerging tech) |
| Operational Risk | Medium (scale and integration of cloud services) | High (early-stage tech, small workforce) |
| Environmental Risk | Low (digital services) | Low (digital services) |
| Geopolitical Risk | Medium (based in Israel, global exposure) | Medium to high (UK-focused, geopolitical tech sensitivity) |
In synthesis, Arqit faces higher operational and market risk due to its smaller scale, higher beta, and emerging technology status, coupled with financial distress signals like a low Altman Z-score and weak Piotroski score. Wix.com has a higher debt burden and moderate market risk but benefits from a more diversified global presence and stronger operational scale, despite some financial ratio weaknesses. Investors should weigh Arqit’s growth potential against its financial instability and elevated volatility, while Wix.com presents a more established but moderately leveraged profile.
Which Stock to Choose?
Wix.com Ltd. (WIX) has shown favorable income growth with a 12.74% revenue increase in 2024 and a 7.86% net margin, though its return on equity is deeply negative at -175.57%. Its financial ratios indicate a slightly unfavorable profile due to moderate debt and liquidity concerns, despite strong operating returns and an improving profitability trend.
Arqit Quantum Inc. (ARQQ) presents a challenging financial situation with very unfavorable profitability ratios, including a -6668.49% net margin and negative returns on equity and invested capital. However, it maintains a favorable debt position and liquidity, with a smaller market cap and ongoing revenue growth of 80.89% in 2025, though its overall financial ratios remain unfavorable.
Investors with a tolerance for risk and a focus on growth may find ARQQ’s rapid revenue expansion and improving ROIC trend suggestive of potential future value creation, despite current losses. Conversely, more risk-averse or quality-oriented investors could see WIX’s stable income growth and improving profitability as indicative of a more balanced, though still cautious, investment profile.
Disclaimer: Investment carries a risk of loss of initial capital. The past performance is not a reliable indicator of future results. Be sure to understand risks before making an investment decision.
Go Further
I encourage you to read the complete analyses of Wix.com Ltd. and Arqit Quantum Inc. to enhance your investment decisions: