In today’s fast-evolving technology landscape, Arqit Quantum Inc. and Veritone, Inc. stand out as innovative players within the software infrastructure sector. Arqit focuses on cutting-edge quantum cybersecurity solutions, while Veritone leverages artificial intelligence to transform data into actionable insights. Their shared emphasis on advanced technologies and market presence makes them compelling candidates for comparison. Join me as we explore which company offers the most promising investment opportunity in 2026.
Table of contents
Companies Overview
I will begin the comparison between Arqit Quantum Inc. and Veritone, Inc. by providing an overview of these two companies and their main differences.
Arqit Quantum Inc. Overview
Arqit Quantum Inc. is a UK-based technology company focused on cybersecurity through satellite and terrestrial platforms. Its flagship product, QuantumCloud, enables devices to generate encryption keys for secure communication. Positioned in the software infrastructure industry, Arqit operates with a lean team of 82 employees and is listed on the NASDAQ Capital Market with a market capitalization of $416M.
Veritone, Inc. Overview
Veritone, Inc., headquartered in Denver, Colorado, operates in the software infrastructure sector, providing AI computing solutions via its aiWARE platform. This platform applies machine learning and cognitive processes to analyze vast structured and unstructured data sets across multiple verticals, including media, government, and energy. Veritone employs 469 staff, is listed on the NASDAQ Global Market, and has a market cap of $225M.
Key similarities and differences
Both companies operate in the technology sector specializing in software infrastructure, but they focus on different niche markets: Arqit on quantum-based cybersecurity and Veritone on AI-driven data analysis. Arqit is a smaller company based in the UK, while Veritone is larger and US-based with a broader industry reach. Their market caps and employee counts reflect these operational scale differences, highlighting varied growth and risk profiles.
Income Statement Comparison
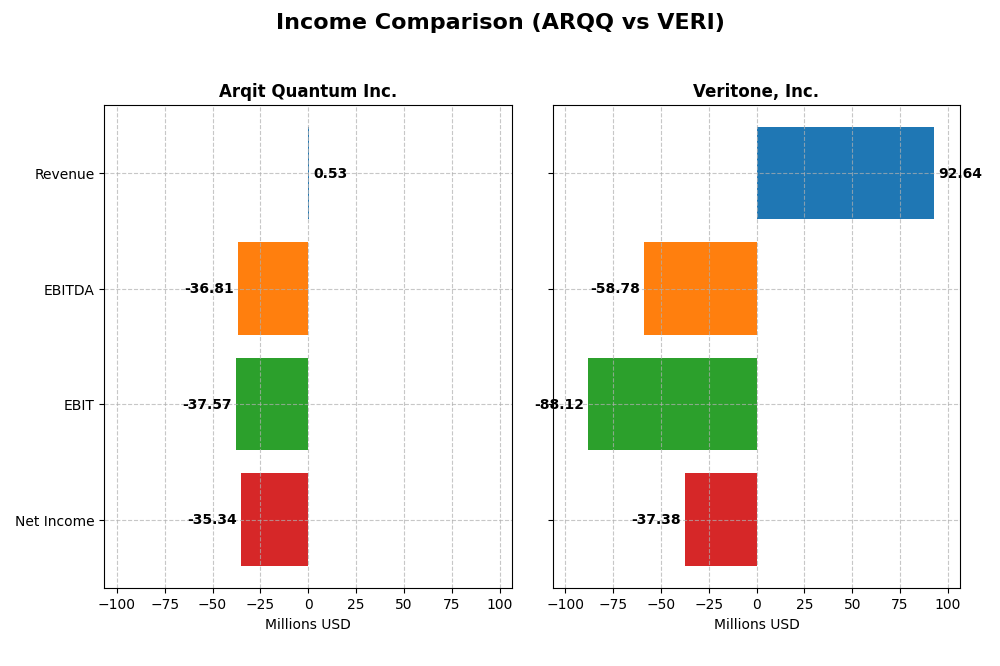
The table below presents a side-by-side comparison of the latest fiscal year income statement metrics for Arqit Quantum Inc. and Veritone, Inc., providing insight into their financial performance.
| Metric | Arqit Quantum Inc. | Veritone, Inc. |
|---|---|---|
| Market Cap | 416M | 225M |
| Revenue | 530K | 92.6M |
| EBITDA | -36.8M | -58.8M |
| EBIT | -37.6M | -88.1M |
| Net Income | -35.3M | -37.4M |
| EPS | -2.56 | -0.98 |
| Fiscal Year | 2025 | 2024 |
Income Statement Interpretations
Arqit Quantum Inc.
Arqit Quantum Inc. experienced significant growth in revenue, increasing over 1000% from 2021 to 2025, with net income improving by nearly 87% despite remaining negative. Margins showed weakness, highlighted by a negative gross margin of -43.4% and a deeply negative net margin. The 2025 fiscal year saw revenue rebound by 81%, and net margin improved by 64%, indicating a gradual operational recovery.
Veritone, Inc.
Veritone, Inc. showed a moderate revenue increase of 60.5% over the 2020-2024 period but faced a revenue decline of 7.35% in 2024 versus 2023. Gross margin remained strong at 70.6%, though the company struggled with negative EBIT and net margins. The 2024 year revealed a marginal improvement in net margin growth and EPS, despite continued operating losses and unfavorable EBIT margin.
Which one has the stronger fundamentals?
Both companies display challenges with profitability, but Arqit Quantum’s stronger revenue and net income growth rates contrast with Veritone’s more stable gross margin. Arqit’s rapid revenue growth and improving net margin suggest potential operational improvements, whereas Veritone maintains better gross profitability but faces declining revenue and persistent losses. Overall, both exhibit favorable income statement trends but with distinct risk profiles.
Financial Ratios Comparison
The table below compares key financial ratios for Arqit Quantum Inc. (ARQQ) and Veritone, Inc. (VERI) based on their most recent fiscal year data, providing a snapshot of valuation, profitability, liquidity, leverage, and operational efficiency.
| Ratios | Arqit Quantum Inc. (2025) | Veritone, Inc. (2024) |
|---|---|---|
| ROE | -130% | -278% |
| ROIC | -127% | -58% |
| P/E | -15.1 | -3.34 |
| P/B | 19.6 | 9.27 |
| Current Ratio | 2.69 | 0.97 |
| Quick Ratio | 2.69 | 0.97 |
| D/E (Debt-to-Equity) | 0.026 | 8.91 |
| Debt-to-Assets | 1.68% | 60.54% |
| Interest Coverage | -803 | -7.31 |
| Asset Turnover | 0.012 | 0.468 |
| Fixed Asset Turnover | 0.736 | 8.51 |
| Payout ratio | 0 | 0 |
| Dividend yield | 0 | 0 |
Interpretation of the Ratios
Arqit Quantum Inc.
Arqit Quantum Inc. shows predominantly unfavorable financial ratios, with negative returns on equity and capital employed, and poor interest coverage, indicating financial stress. However, it maintains a strong liquidity position with a current ratio of 2.69 and low leverage. The company does not pay dividends, likely reflecting its early stage and reinvestment focus in quantum cybersecurity technologies.
Veritone, Inc.
Veritone, Inc. presents mostly unfavorable ratios, including a negative net margin and high debt-to-equity ratio of 8.91, signaling financial risk. The current ratio below 1 suggests liquidity concerns, although fixed asset turnover is favorable at 8.51. Veritone does not distribute dividends, likely due to ongoing investment in AI platform development and operational challenges.
Which one has the best ratios?
Between the two, Arqit Quantum Inc. has a more balanced liquidity profile and considerably lower debt levels, despite many profitability challenges. Veritone’s higher leverage and weaker liquidity metrics contribute to a more unfavorable overall ratio assessment. Thus, Arqit’s ratios appear comparatively stronger, though both companies face significant financial hurdles.
Strategic Positioning
This section compares the strategic positioning of Arqit Quantum Inc. and Veritone, Inc. regarding market position, key segments, and exposure to technological disruption:
Arqit Quantum Inc.
- Emerging player in cybersecurity with moderate market cap, facing high competitive pressure.
- Focuses on cybersecurity via QuantumCloud encryption software for satellite and terrestrial platforms.
- Operates in a specialized quantum encryption niche, exposed to evolving cybersecurity technologies.
Veritone, Inc.
- Smaller market cap with significant competition in AI software and media services markets.
- Diversified AI solutions including aiWARE platform and media advertising services across sectors.
- Faces disruption from rapid advances in AI and machine learning impacting various industries.
Arqit Quantum Inc. vs Veritone, Inc. Positioning
Arqit shows a concentrated focus on quantum cybersecurity, leveraging niche encryption technology, while Veritone pursues diversified AI-powered solutions across multiple verticals. Arqit’s specialization contrasts with Veritone’s broader market approach, each with different scalability and risk profiles.
Which has the best competitive advantage?
Both companies are currently shedding value with negative ROIC compared to WACC. Arqit’s improving ROIC trend suggests slight progress, whereas Veritone’s declining profitability indicates a weaker competitive advantage.
Stock Comparison
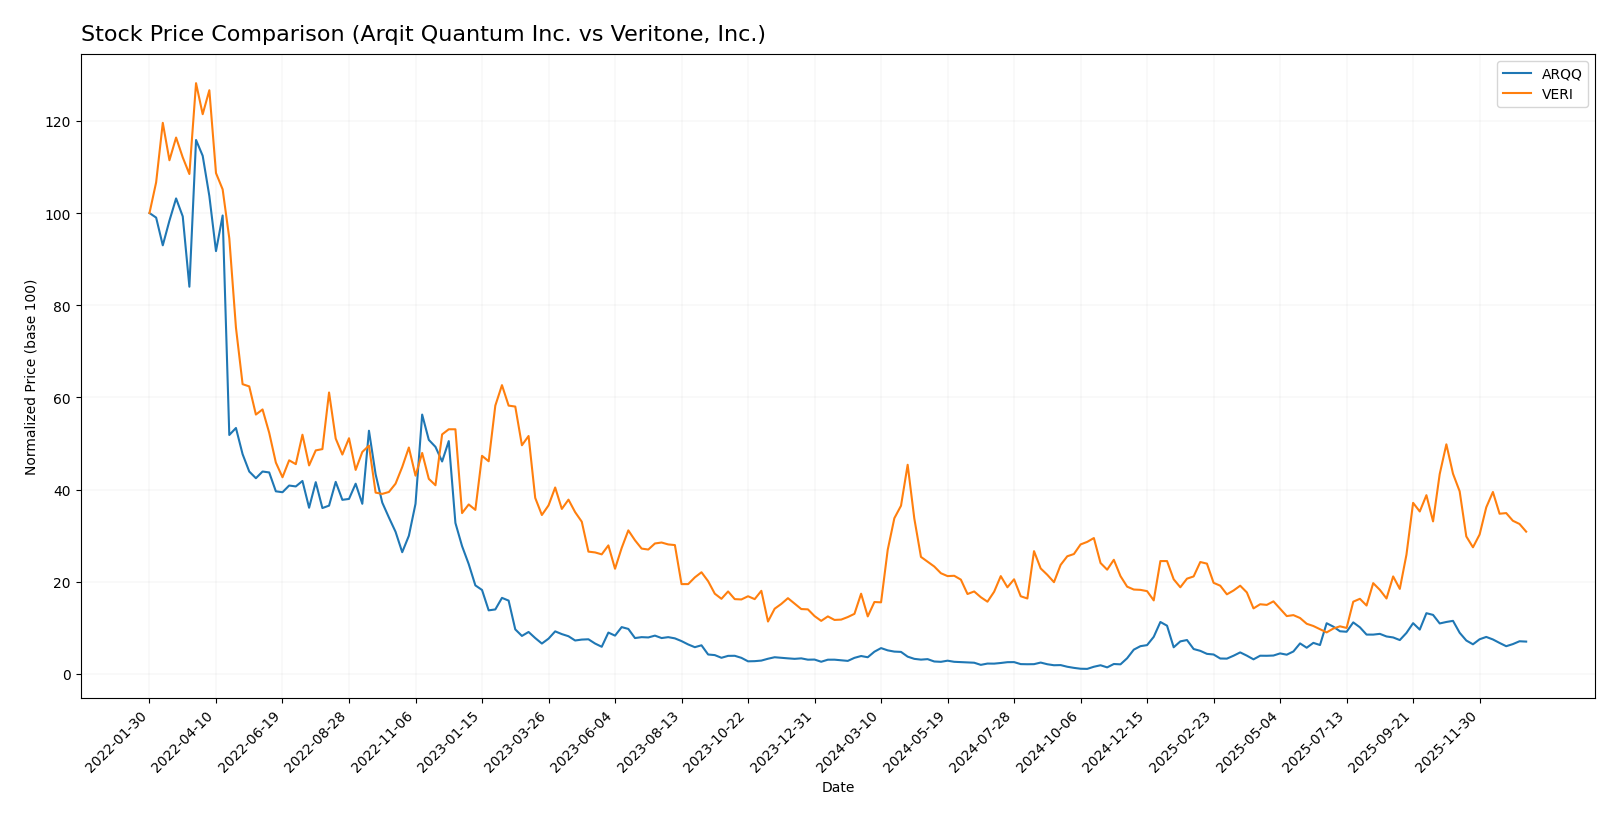
The stock price chart over the past 12 months reveals significant bullish trends for both Arqit Quantum Inc. and Veritone, Inc., with notable deceleration and recent downward pressure in late 2025 to early 2026.
Trend Analysis
Arqit Quantum Inc. (ARQQ) posted a strong 93.6% price increase over the past year, indicating a bullish trend with deceleration and a high volatility level (std deviation 11.75). Recently, the stock declined 39.03%.
Veritone, Inc. (VERI) showed an even stronger bullish trend, gaining 147.22% over the year with low volatility (std deviation 1.26) and decelerating momentum. The recent trend also turned negative with a 28.91% drop.
Comparing both stocks, Veritone outperformed Arqit Quantum over the 12-month period with a higher overall price increase despite similar recent declines.
Target Prices
Analysts present a clear target consensus for both Arqit Quantum Inc. and Veritone, Inc.
| Company | Target High | Target Low | Consensus |
|---|---|---|---|
| Arqit Quantum Inc. | 60 | 60 | 60 |
| Veritone, Inc. | 10 | 9 | 9.5 |
The consensus target for Arqit Quantum Inc. is significantly above its current price of $26.6, indicating strong upside potential. Veritone, Inc.’s target consensus of $9.5 also suggests substantial growth compared to its current price of $4.45.
Analyst Opinions Comparison
This section compares analysts’ ratings and grades for Arqit Quantum Inc. and Veritone, Inc.:
Rating Comparison
Arqit Quantum Inc. Rating
- Rating: C, evaluated as Very Favorable overall.
- Discounted Cash Flow Score: 2, moderate indication of valuation based on future cash flows.
- ROE Score: 1, very unfavorable, indicating weak profit generation from shareholders’ equity.
- ROA Score: 1, very unfavorable, showing poor asset utilization for earnings.
- Debt to Equity Score: 4, favorable, indicating lower financial risk.
- Overall Score: 2, moderate financial standing.
Veritone, Inc. Rating
- Rating: C, also evaluated as Very Favorable overall.
- Discounted Cash Flow Score: 5, very favorable valuation based on future cash flows.
- ROE Score: 1, very unfavorable, indicating weak profit generation from shareholders’ equity.
- ROA Score: 1, very unfavorable, showing poor asset utilization for earnings.
- Debt to Equity Score: 1, very unfavorable, indicating higher financial risk.
- Overall Score: 2, moderate financial standing.
Which one is the best rated?
Both companies share the same overall rating of C and overall score of 2, reflecting moderate financial standing. Veritone has a significantly stronger discounted cash flow score, while Arqit shows a more favorable debt to equity score. Other key financial metrics are equally unfavorable for both.
Scores Comparison
The comparison of the companies’ financial health scores is as follows:
ARQQ Scores
- Altman Z-Score: -0.22, indicating distress zone, high bankruptcy risk.
- Piotroski Score: 2, classified as very weak financial strength.
VERI Scores
- Altman Z-Score: -0.07, also in distress zone, high bankruptcy risk.
- Piotroski Score: 3, classified as very weak financial strength.
Which company has the best scores?
Based on the provided data, VERI shows slightly better scores with a higher Piotroski Score (3 vs. 2) and a less negative Altman Z-Score (-0.07 vs. -0.22), though both remain in distress zones and very weak categories.
Grades Comparison
The following section compares the recent grades assigned to Arqit Quantum Inc. and Veritone, Inc. by reputable grading firms:
Arqit Quantum Inc. Grades
This table summarizes the consistent buy ratings given by HC Wainwright & Co. for Arqit Quantum Inc. over time.
| Grading Company | Action | New Grade | Date |
|---|---|---|---|
| HC Wainwright & Co. | Maintain | Buy | 2025-10-13 |
| HC Wainwright & Co. | Maintain | Buy | 2025-09-18 |
| HC Wainwright & Co. | Maintain | Buy | 2024-12-31 |
| HC Wainwright & Co. | Maintain | Buy | 2024-12-06 |
| HC Wainwright & Co. | Maintain | Buy | 2024-07-11 |
| HC Wainwright & Co. | Maintain | Buy | 2024-05-29 |
| HC Wainwright & Co. | Maintain | Buy | 2024-05-15 |
| HC Wainwright & Co. | Maintain | Buy | 2023-11-22 |
| HC Wainwright & Co. | Maintain | Buy | 2023-09-27 |
| HC Wainwright & Co. | Maintain | Buy | 2023-09-26 |
Arqit Quantum Inc. has consistently received a stable “Buy” rating from HC Wainwright & Co., indicating sustained confidence from this grading company.
Veritone, Inc. Grades
This table presents the recent buy ratings maintained by D. Boral Capital, Needham, and HC Wainwright & Co. for Veritone, Inc.
| Grading Company | Action | New Grade | Date |
|---|---|---|---|
| D. Boral Capital | Maintain | Buy | 2025-12-09 |
| D. Boral Capital | Maintain | Buy | 2025-12-04 |
| Needham | Maintain | Buy | 2025-12-02 |
| D. Boral Capital | Maintain | Buy | 2025-12-02 |
| D. Boral Capital | Maintain | Buy | 2025-11-07 |
| D. Boral Capital | Maintain | Buy | 2025-10-28 |
| HC Wainwright & Co. | Maintain | Buy | 2025-10-20 |
| D. Boral Capital | Maintain | Buy | 2025-10-15 |
| D. Boral Capital | Maintain | Buy | 2025-09-24 |
| D. Boral Capital | Maintain | Buy | 2025-09-09 |
Veritone, Inc. has received a consistent “Buy” rating from multiple credible grading firms, reflecting broad analytical support.
Which company has the best grades?
Both Arqit Quantum Inc. and Veritone, Inc. have maintained consistent “Buy” ratings from reputable grading companies. Veritone’s ratings come from a more diverse set of firms, potentially offering broader market validation, which could affect investor confidence and decision-making differently than Arqit’s single-source consistency.
Strengths and Weaknesses
Below is a comparative overview of the key strengths and weaknesses of Arqit Quantum Inc. (ARQQ) and Veritone, Inc. (VERI) based on recent financial and operational data.
| Criterion | Arqit Quantum Inc. (ARQQ) | Veritone, Inc. (VERI) |
|---|---|---|
| Diversification | Limited product segmentation; focused on quantum encryption technology | More diversified with revenues from Licensing, Managed Services, and Software Products |
| Profitability | Negative net margin (-6668.49%), unfavorable ROIC (-127.45%), shedding value but improving ROIC trend | Negative net margin (-40.36%), unfavorable ROIC (-58.27%), declining profitability |
| Innovation | Operates in a high-tech quantum computing niche with growing ROIC, indicating potential | AI-driven software and services with established product lines but declining profitability |
| Global presence | Emerging global presence typical of cutting-edge tech startups | Established presence with multiple service lines globally |
| Market Share | Small, niche market with potential for growth | More established market share in AI and cloud software sectors |
Key takeaways: Arqit Quantum shows promise with improving profitability trends in a specialized field but currently destroys value. Veritone exhibits broader diversification but faces declining profitability and a very unfavorable financial position. Investors should weigh growth potential against current financial risks.
Risk Analysis
Below is a comparative table highlighting key risks for Arqit Quantum Inc. (ARQQ) and Veritone, Inc. (VERI) based on the most recent data available:
| Metric | Arqit Quantum Inc. (ARQQ) | Veritone, Inc. (VERI) |
|---|---|---|
| Market Risk | High (Beta 2.41) | High (Beta 2.05) |
| Debt level | Very Low (D/E 0.03) | Very High (D/E 8.91) |
| Regulatory Risk | Moderate (UK cybersecurity sector) | Moderate (US & UK AI regulations) |
| Operational Risk | High (Small team, 82 employees, early-stage tech) | Moderate (469 employees, complex AI operations) |
| Environmental Risk | Low (Software-based) | Low (Software-based) |
| Geopolitical Risk | Moderate (UK, global satellite tech implications) | Moderate (US-UK operations, AI export controls) |
The most significant risks arise from financial distress and market volatility. Both companies operate with negative profitability and face high market risk due to elevated betas. ARQQ has minimal debt but struggles with operational efficiency and financial health, reflected in its distress-zone Altman Z-Score. VERI carries a heavy debt burden, increasing default risk, despite a higher fixed-asset turnover. Regulatory shifts in cybersecurity and AI sectors may also impact growth. Cautious risk management is advised before investing.
Which Stock to Choose?
Arqit Quantum Inc. (ARQQ) shows strong revenue growth of 80.9% in the past year with favorable income statement metrics overall, despite negative profitability and high net margin volatility. Its financial ratios are mostly unfavorable, but it maintains low debt and a solid current ratio. The rating is very favorable with a moderate overall score, although profitability ratios remain weak.
Veritone, Inc. (VERI) reports a 7.35% revenue decline last year with mixed income statement results, including a favorable gross margin but overall unfavorable net margin and profitability ratios. It carries high debt levels and a current ratio below 1, reflecting liquidity concerns. Its rating is also very favorable, but with a very unfavorable global ratio evaluation and moderate overall score.
Investors seeking growth may find ARQQ’s improving income statement and low leverage more appealing, while risk-tolerant profiles might consider VERI’s valuation and recent bullish price trend despite weaker financial ratios. The choice could depend on the investor’s appetite for risk and preference for growth versus caution.
Disclaimer: Investment carries a risk of loss of initial capital. The past performance is not a reliable indicator of future results. Be sure to understand risks before making an investment decision.
Go Further
I encourage you to read the complete analyses of Arqit Quantum Inc. and Veritone, Inc. to enhance your investment decisions: