Home > Comparison > Technology > VRSN vs ARQQ
The strategic rivalry between VeriSign, Inc. and Arqit Quantum Inc. defines the current trajectory of the technology sector’s software infrastructure landscape. VeriSign operates as a capital-intensive domain registry giant, securing internet navigation globally. In contrast, Arqit Quantum pioneers high-growth quantum encryption services with a lean operational model. This analysis will determine which corporate strategy offers superior risk-adjusted returns for diversified portfolios amid evolving cybersecurity demands.
Table of contents
Companies Overview
VeriSign and Arqit Quantum stand as pivotal players in the global software infrastructure landscape in 2026.
VeriSign, Inc.: Custodian of Internet Infrastructure
VeriSign dominates as a domain name registry service provider, securing and stabilizing internet navigation worldwide. It generates most revenue by managing the authoritative resolution for the .com and .net domains, vital to global e-commerce. In 2026, VeriSign focuses on maintaining its root zone maintainer role and enhancing security and resiliency in internet infrastructure.
Arqit Quantum Inc.: Pioneer in Quantum Cybersecurity
Arqit Quantum leads in quantum encryption solutions, offering cybersecurity through satellite and terrestrial platforms. Its core revenue engine is QuantumCloud, which enables devices to generate encryption keys via lightweight software agents. The company’s 2026 strategic emphasis is expanding its quantum-safe cybersecurity footprint in the UK and beyond.
Strategic Collision: Similarities & Divergences
While both firms operate in software infrastructure, VeriSign relies on a centralized domain registry model, contrasting with Arqit’s decentralized quantum encryption approach. Their primary battleground lies in securing internet trust and data integrity. VeriSign offers stability through legacy infrastructure; Arqit delivers cutting-edge encryption innovation, creating distinct risk and growth profiles for investors.
Income Statement Comparison
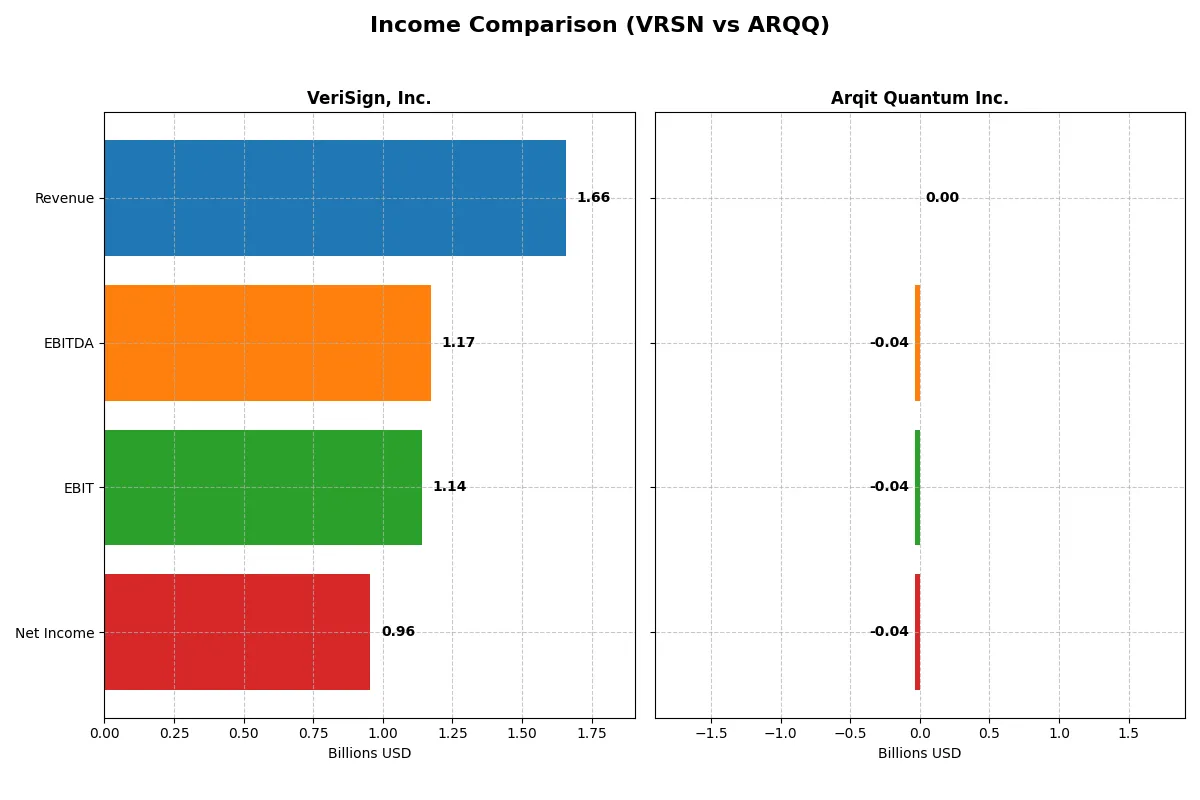
This data dissects the core profitability and scalability of both corporate engines to reveal who dominates the bottom line:
| Metric | VeriSign, Inc. (VRSN) | Arqit Quantum Inc. (ARQQ) |
|---|---|---|
| Revenue | 1.66B | 530K |
| Cost of Revenue | 196M | 760K |
| Operating Expenses | 339M | 38.7M |
| Gross Profit | 1.46B | -230K |
| EBITDA | 1.17B | -36.8M |
| EBIT | 1.14B | -37.6M |
| Interest Expense | 77M | 48K |
| Net Income | 956M | -35.3M |
| EPS | 8.83 | -2.56 |
| Fiscal Year | 2025 | 2025 |
Income Statement Analysis: The Bottom-Line Duel
This income statement comparison reveals which company runs its business more efficiently and delivers superior shareholder value.
VeriSign, Inc. Analysis
VeriSign steadily grows revenue from $1.33B in 2021 to $1.66B in 2025, with net income rising from $785M to $955M. Its gross margin stays robust above 88%, and net margin climbs to nearly 58%, reflecting strong cost control. In 2025, VeriSign’s efficient operations yield $1.14B EBIT, showcasing solid momentum and disciplined capital allocation.
Arqit Quantum Inc. Analysis
Arqit’s revenue expands sharply from $48K in 2021 to $530K in 2025 but remains minuscule compared to VeriSign. It suffers negative gross and net margins, with a net loss of $35M in 2025 despite 81% revenue growth. The company’s persistent operating losses and negative EBIT margin highlight ongoing struggles to scale profitably or leverage cost efficiencies.
Margin Power vs. Revenue Scale
VeriSign dominates with strong revenue and consistent profitability, boasting industry-leading margins and positive earnings growth. Arqit shows high top-line momentum but remains deeply unprofitable with negative margins. VeriSign’s profile appeals to investors prioritizing stable, efficient cash generation over speculative, early-stage growth.
Financial Ratios Comparison
These vital ratios act as a diagnostic tool to expose the underlying fiscal health, valuation premiums, and capital efficiency of the companies compared below:
| Ratios | VeriSign, Inc. (VRSN) | Arqit Quantum Inc. (ARQQ) |
|---|---|---|
| ROE | -0.65 | -1.30 |
| ROIC | -1.52 | -1.27 |
| P/E | 23.5 | -15.1 |
| P/B | -15.2 | 19.6 |
| Current Ratio | 0.49 | 2.69 |
| Quick Ratio | 0.49 | 2.69 |
| D/E (Debt-to-Equity) | -1.21 | 0.03 |
| Debt-to-Assets | 2.66 | 0.02 |
| Interest Coverage | 14.6 | -802.9 |
| Asset Turnover | 2.46 | 0.01 |
| Fixed Asset Turnover | 7.75 | 0.74 |
| Payout Ratio | 0.23 | 0 |
| Dividend Yield | 0.96% | 0 |
| Fiscal Year | 2025 | 2025 |
Efficiency & Valuation Duel: The Vital Signs
Financial ratios act as a company’s DNA, uncovering hidden risks and operational strengths that raw numbers alone cannot reveal.
VeriSign, Inc.
VeriSign shows a robust net margin of 57.68%, signaling strong profitability despite a deeply negative ROE of -64.84%. Its P/E ratio at 23.49 is neutral, indicating a fair valuation amid stretched capital returns. The company offers a modest 0.96% dividend yield, balancing shareholder returns with reinvestment in R&D and growth.
Arqit Quantum Inc.
Arqit’s metrics reveal severe profitability challenges, with a net margin plunging to -6668.49% and a ROE of -129.77%. The stock’s P/E is negative but flagged as favorable due to negative earnings, reflecting high risk. It pays no dividends, focusing instead on preserving liquidity, though its operational efficiency remains weak with a current ratio of 2.69.
Operational Resilience vs. Profitability Stress
VeriSign delivers a better balance of profitability and valuation, despite some capital inefficiencies, while Arqit faces significant losses and operational inefficiencies. VeriSign suits investors prioritizing stable returns; Arqit fits those willing to tolerate high risk for potential future growth.
Which one offers the Superior Shareholder Reward?
I observe VeriSign (VRSN) as a disciplined distributor, paying a modest 0.96% dividend yield with a 22.5% payout ratio, comfortably covered by strong free cash flow of 11.6/share. It also repurchases shares steadily, enhancing total return sustainably. Conversely, Arqit Quantum (ARQQ) pays no dividends and burns cash with negative free cash flow near -2.15/share. Its strategy hinges on heavy reinvestment in R&D, yet it lacks buyback activity. Historically, in tech sectors, such reinvestment can pay off but remains riskier. I conclude VeriSign offers a superior shareholder reward in 2026, balancing income and buybacks with sustainable cash flow, while Arqit’s model remains speculative and less reliable for total returns.
Comparative Score Analysis: The Strategic Profile
The radar chart reveals the fundamental DNA and trade-offs of VeriSign, Inc. and Arqit Quantum Inc., highlighting their distinct financial strengths and vulnerabilities:
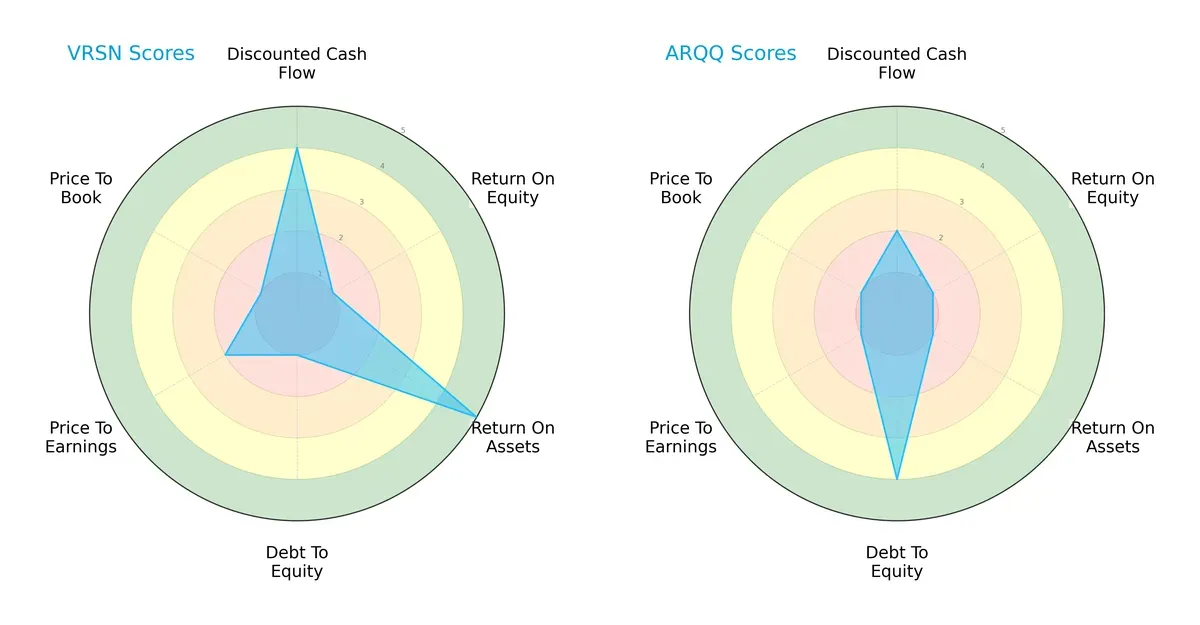
VeriSign shows a strong Discounted Cash Flow (4) and Return on Assets (5), indicating efficient asset use and undervaluation potential. However, its Debt/Equity (1) and Return on Equity (1) scores are weak, signaling leverage risk and poor equity returns. Arqit Quantum excels in Debt/Equity (4), reflecting a healthier balance sheet, but lags in all profitability metrics and valuation scores. VeriSign offers a more balanced profile with operational efficiency, while Arqit relies mainly on lower leverage as its edge.
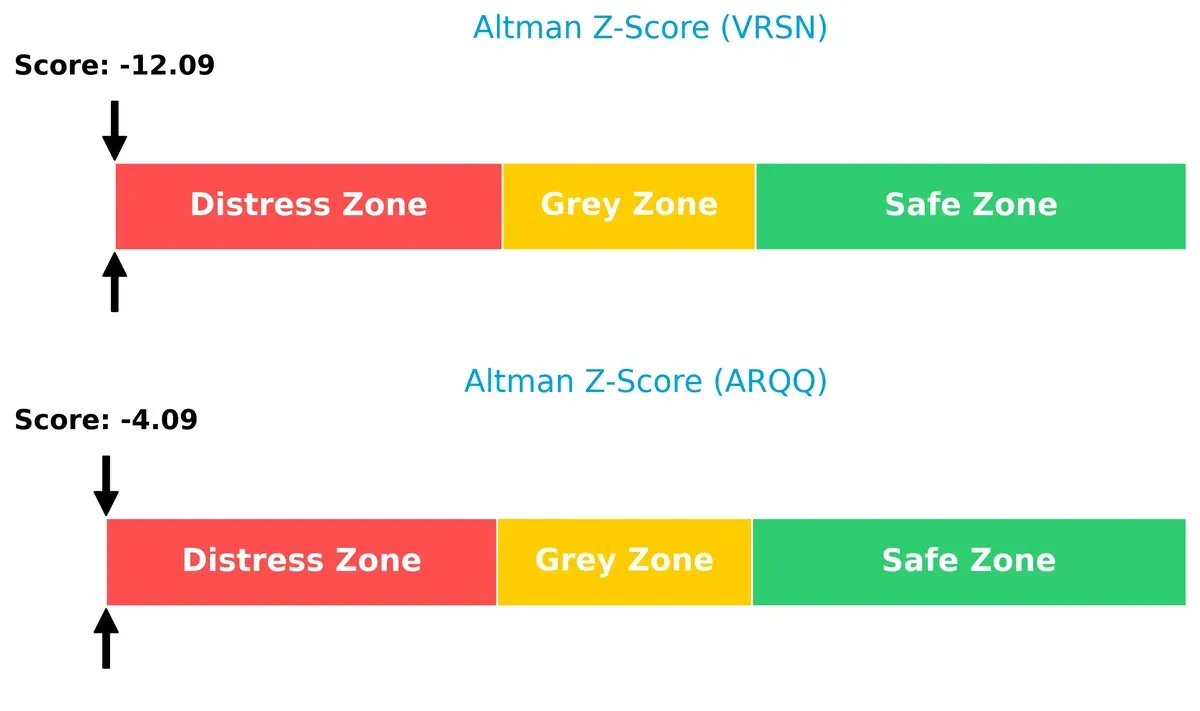
Bankruptcy Risk: Solvency Showdown
VeriSign’s Altman Z-Score of -12.1 versus Arqit’s -4.1 places both deep in distress, signaling severe bankruptcy risk in this cycle:
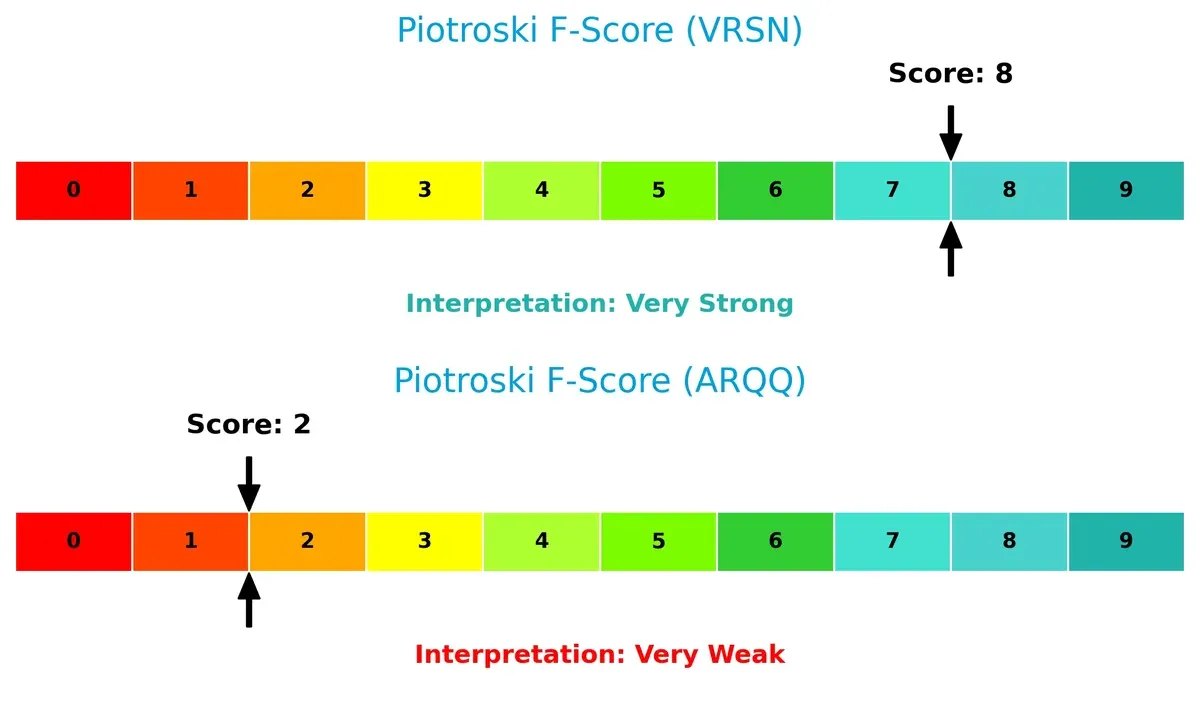
Financial Health: Quality of Operations
VeriSign scores an 8 on the Piotroski F-Score, reflecting robust financial health and operational quality. Arqit’s score of 2 signals critical red flags and weak internal metrics:
How are the two companies positioned?
This section dissects the operational DNA of VeriSign and Arqit by comparing their revenue distribution and internal dynamics. The goal is to confront their economic moats and identify which model offers a more resilient, sustainable competitive advantage today.
Strengths and Weaknesses Comparison
This table compares the Strengths and Weaknesses of VeriSign, Inc. and Arqit Quantum Inc.:
VeriSign Strengths
- High net margin of 57.68%
- Favorable weighted average cost of capital at 7.02%
- Strong asset turnover ratios
- High interest coverage ratio
- Established global presence with diversified revenue from US, EMEA, Asia Pacific, and other regions
Arqit Strengths
- Strong current and quick ratios above 2.5 indicate solid liquidity
- Low debt to assets ratio at 1.68%
- Favorable price to earnings metric despite negative earnings
- Positive debt to equity ratio
VeriSign Weaknesses
- Negative return on equity (-64.84%) and return on invested capital (-151.96%)
- Low current and quick ratios below 1 indicate liquidity risk
- High debt to assets ratio at 265.55% suggests heavy leverage
- Negative price to book ratio
- Low dividend yield below 1%
Arqit Weaknesses
- Large negative net margin (-6668.49%) and negative returns on equity and invested capital
- Unfavorable weighted average cost of capital at 15.09%
- Poor asset turnover and fixed asset turnover ratios
- Negative interest coverage ratio
- No dividend yield
VeriSign demonstrates operational profitability and global diversification but struggles with leverage and liquidity concerns. Arqit shows strong liquidity and low leverage but faces severe profitability and efficiency challenges. These factors shape each company’s strategic priorities and risk profiles.
The Moat Duel: Analyzing Competitive Defensibility
A structural moat protects long-term profits from competition’s relentless erosion. Without it, firms risk commoditization and margin decay:
VeriSign, Inc.: Intangible Asset Fortress
VeriSign’s moat lies in its authoritative control over .com and .net domains. This intangible asset drives 68.8% EBIT margins and margin stability. New internet infrastructure demands could deepen its grip in 2026.
Arqit Quantum Inc.: Emerging Technology Innovator
Arqit’s moat is nascent, rooted in quantum encryption technology—a stark contrast to VeriSign’s established registry dominance. Its rising ROIC trend signals growing competitive strength, with 2026 offering expansion via cybersecurity adoption.
Legacy Registry vs. Quantum Encryption: Who Holds the Moat Edge?
VeriSign’s entrenched intangible assets create a wider, more durable moat than Arqit’s early-stage tech innovation. VeriSign remains better equipped to defend market share despite its declining ROIC, while Arqit’s growth signals potential but lacks current scale.
Which stock offers better returns?
Over the past 12 months, VeriSign, Inc. gained 17.83% before recent deceleration, while Arqit Quantum Inc. declined 4.18%, reflecting contrasting momentum and trading dynamics.
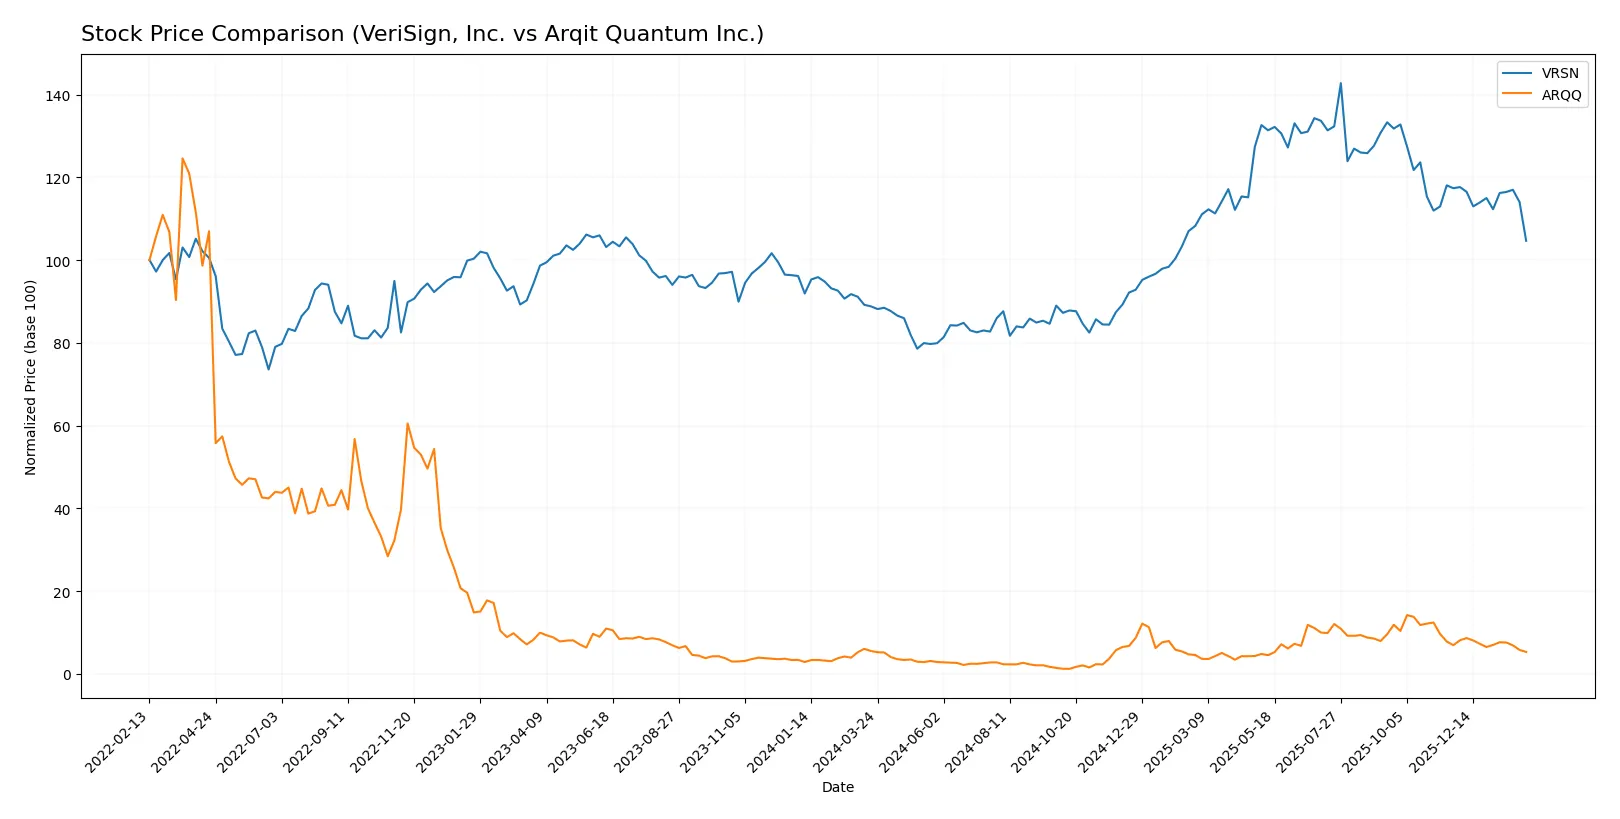
Trend Comparison
VeriSign’s stock shows a bullish trend over the last year with a 17.83% gain, despite recent deceleration and a short-term 10.84% decline. Volatility remains high at a 40.67 standard deviation.
Arqit Quantum’s stock trends bearish with a 4.18% loss over 12 months, accelerating its decline recently by 23.72%. Volatility is moderate at 11.73 standard deviation, with decelerating negative momentum.
VeriSign outperformed Arqit Quantum by delivering positive returns against a bearish trend in Arqit, marking VeriSign as the stronger market performer over the analyzed period.
Target Prices
Analysts show clear target price consensus for VeriSign, Inc. and Arqit Quantum Inc.
| Company | Target Low | Target High | Consensus |
|---|---|---|---|
| VeriSign, Inc. | 325 | 325 | 325 |
| Arqit Quantum Inc. | 60 | 60 | 60 |
VeriSign’s target consensus at $325 implies a 45% upside from its $224 current price. Arqit’s $60 target suggests strong growth potential from its $18.59 price.
How do institutions grade them?
VeriSign, Inc. Grades
Below are the recent grades assigned by reputable institutions to VeriSign, Inc.:
| Grading Company | Action | New Grade | Date |
|---|---|---|---|
| JP Morgan | Maintain | Neutral | 2026-01-06 |
| Baird | Maintain | Outperform | 2025-07-01 |
| Baird | Maintain | Outperform | 2025-04-25 |
| Baird | Maintain | Outperform | 2025-04-01 |
| Citigroup | Maintain | Buy | 2025-02-04 |
| Citigroup | Maintain | Buy | 2025-01-03 |
| Baird | Upgrade | Outperform | 2024-12-09 |
| Baird | Maintain | Neutral | 2024-06-27 |
| Baird | Maintain | Neutral | 2024-04-26 |
| Citigroup | Maintain | Buy | 2024-04-02 |
Arqit Quantum Inc. Grades
Here are the latest grades given by HC Wainwright & Co. to Arqit Quantum Inc.:
| Grading Company | Action | New Grade | Date |
|---|---|---|---|
| HC Wainwright & Co. | Maintain | Buy | 2025-10-13 |
| HC Wainwright & Co. | Maintain | Buy | 2025-09-18 |
| HC Wainwright & Co. | Maintain | Buy | 2024-12-31 |
| HC Wainwright & Co. | Maintain | Buy | 2024-12-06 |
| HC Wainwright & Co. | Maintain | Buy | 2024-07-11 |
| HC Wainwright & Co. | Maintain | Buy | 2024-05-29 |
| HC Wainwright & Co. | Maintain | Buy | 2024-05-15 |
| HC Wainwright & Co. | Maintain | Buy | 2023-11-22 |
| HC Wainwright & Co. | Maintain | Buy | 2023-09-27 |
| HC Wainwright & Co. | Maintain | Buy | 2023-09-26 |
Which company has the best grades?
VeriSign shows a mix of “Buy,” “Outperform,” and “Neutral” grades from multiple firms, indicating a balanced institutional view. Arqit Quantum consistently holds a “Buy” rating from a single grading company, reflecting steady support. Investors might interpret VeriSign’s broader coverage and varied grades as a signal of nuanced analyst opinions, while Arqit’s uniform buy ratings suggest strong confidence from one source.

Don’t Let Luck Decide Your Entry Point
Optimize your entry points with our advanced ProRealTime indicators. You’ll get efficient buy signals with precise price targets for maximum performance. Start outperforming now!
Risks specific to each company
The following categories identify the critical pressure points and systemic threats facing both firms in the 2026 market environment:
1. Market & Competition
VeriSign, Inc.
- Dominates domain registry with .com/.net but faces industry tech shifts and cybersecurity competition.
Arqit Quantum Inc.
- Operates in quantum cybersecurity, a nascent market with significant competitive uncertainty and adoption risks.
2. Capital Structure & Debt
VeriSign, Inc.
- High debt-to-assets ratio (265.55%) signals leverage concerns despite favorable interest coverage.
Arqit Quantum Inc.
- Maintains low debt-to-assets (1.68%) and manageable debt-to-equity, but weak interest coverage raises red flags.
3. Stock Volatility
VeriSign, Inc.
- Low beta (0.75) indicates lower market volatility and defensive positioning.
Arqit Quantum Inc.
- High beta (2.40) signals elevated stock price swings and speculative investor sentiment.
4. Regulatory & Legal
VeriSign, Inc.
- Subject to internet infrastructure regulation and cybersecurity laws in the US, a relatively stable framework.
Arqit Quantum Inc.
- Faces complex UK and international quantum encryption regulations, increasing compliance risks.
5. Supply Chain & Operations
VeriSign, Inc.
- Mature infrastructure and established network reduce operational disruptions.
Arqit Quantum Inc.
- Early-stage operations reliant on satellite tech pose supply chain and scalability challenges.
6. ESG & Climate Transition
VeriSign, Inc.
- Limited ESG disclosure but stable operations suggest moderate exposure to climate transition risks.
Arqit Quantum Inc.
- Emerging tech focus may attract ESG scrutiny; unclear sustainability practices raise potential concerns.
7. Geopolitical Exposure
VeriSign, Inc.
- Primarily US-based with moderate exposure to geopolitical tensions affecting internet governance.
Arqit Quantum Inc.
- UK-based with global satellite links, vulnerable to post-Brexit regulatory shifts and international conflicts.
Which company shows a better risk-adjusted profile?
VeriSign’s dominant market position and stable stock volatility offer a stronger risk-adjusted profile despite leverage concerns. Arqit’s high market volatility, regulatory complexity, and weak financial metrics amplify risk significantly. VeriSign’s ability to generate consistent cash flows contrasts with Arqit’s operational infancy.
VeriSign’s largest risk is its excessive leverage, which pressures financial flexibility. Arqit’s most impactful risk is its volatile stock and weak financial health, reflecting nascent technology and uncertain market adoption. The stark contrast in stock betas—0.75 versus 2.40—underscores VeriSign’s relative stability and Arqit’s speculative nature in 2026.
Final Verdict: Which stock to choose?
VeriSign’s superpower lies in its high-margin, cash-generative business model that dominates digital infrastructure. However, its low liquidity ratios and declining ROIC signal points of vigilance. It suits portfolios seeking steady income with moderate growth, leaning toward a Defensive Growth profile.
Arqit Quantum’s strategic moat is its cutting-edge quantum encryption technology with a robust liquidity position. Its early-stage growth offers upside but carries higher execution risk than VeriSign. It fits investors targeting speculative Growth with a tolerance for volatility and capital risk.
If you prioritize resilient cash flow and a proven market position, VeriSign is the compelling choice due to its strong profitability and defensive qualities. However, if you seek asymmetric growth potential and can endure uncertainty, Arqit Quantum offers superior innovation-driven upside, though with elevated financial risk.
Disclaimer: Investment carries a risk of loss of initial capital. The past performance is not a reliable indicator of future results. Be sure to understand risks before making an investment decision.
Go Further
I encourage you to read the complete analyses of VeriSign, Inc. and Arqit Quantum Inc. to enhance your investment decisions: