In the rapidly evolving technology sector, UiPath Inc. and Arqit Quantum Inc. stand out as innovators in software infrastructure. UiPath leads in robotic process automation with a comprehensive AI-driven platform, while Arqit pioneers quantum-enhanced cybersecurity solutions. Both companies target enterprise clients seeking advanced automation and security. This article will help you understand which company presents a more compelling investment opportunity in 2026.
Table of contents
Companies Overview
I will begin the comparison between UiPath Inc. and Arqit Quantum Inc. by providing an overview of these two companies and their main differences.
UiPath Inc. Overview
UiPath Inc. operates an end-to-end automation platform specializing in robotic process automation (RPA). The company’s mission centers on combining artificial intelligence with intuitive tools to help organizations discover, build, and manage automation workflows. Headquartered in New York City, UiPath serves industries such as banking, healthcare, and government, positioning itself as a leader in software infrastructure with a market cap of approximately 7.7B USD.
Arqit Quantum Inc. Overview
Arqit Quantum Inc. provides cybersecurity solutions through quantum encryption technologies delivered via satellite and terrestrial platforms. Based in London, the company focuses on enabling devices to securely generate encryption keys using its QuantumCloud software agent. Arqit operates in the software infrastructure sector with a market cap near 416M USD and a workforce of 82 employees, emphasizing security innovation within the UK market.
Key similarities and differences
Both companies operate in the technology sector under software infrastructure but address distinct market needs: UiPath focuses on automating business processes while Arqit specializes in cybersecurity through quantum encryption. UiPath has a significantly larger market capitalization and employee base compared to Arqit, reflecting different scales and operational scopes. Their business models diverge with UiPath offering comprehensive RPA solutions and Arqit delivering niche quantum encryption services.
Income Statement Comparison
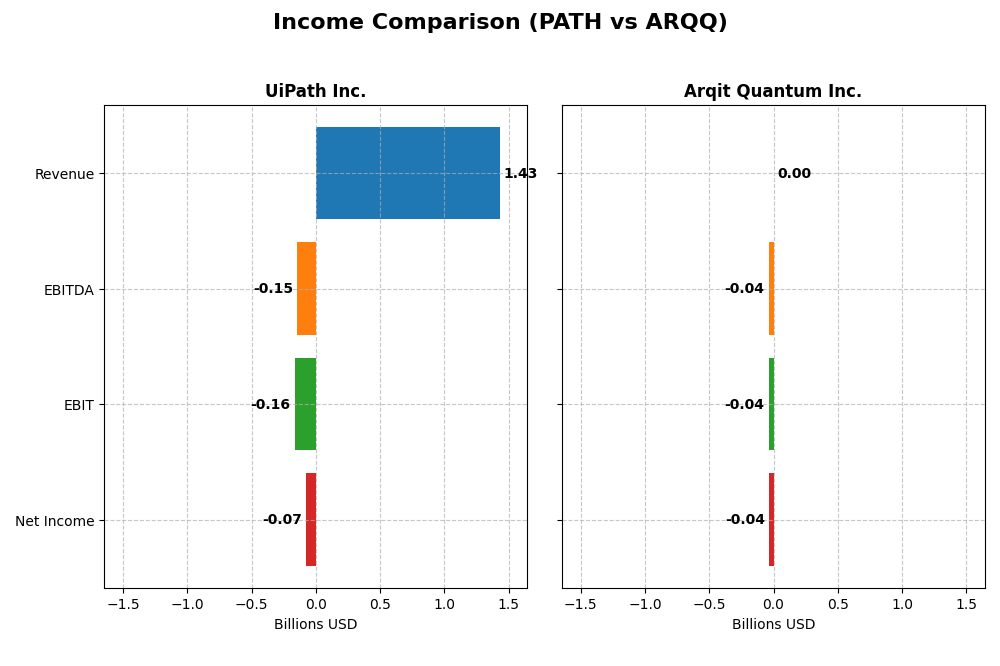
This table presents a side-by-side comparison of key income statement metrics for UiPath Inc. and Arqit Quantum Inc. for the fiscal year 2025.
| Metric | UiPath Inc. (PATH) | Arqit Quantum Inc. (ARQQ) |
|---|---|---|
| Market Cap | 7.67B | 416M |
| Revenue | 1.43B | 530K |
| EBITDA | -145M | -37M |
| EBIT | -163M | -38M |
| Net Income | -74M | -35M |
| EPS | -0.13 | -2.56 |
| Fiscal Year | 2025 | 2025 |
Income Statement Interpretations
UiPath Inc.
UiPath’s revenue showed a consistent upward trend from $608M in 2021 to $1.43B in 2025, with net income losses narrowing from -$92M to -$74M. Gross margins remained strong at around 83%, but EBIT and net margins stayed negative, reflecting ongoing operating losses. The 2025 fiscal year saw revenue growth of 9.3% and improved net margin by 25%, indicating a gradual margin recovery.
Arqit Quantum Inc.
Arqit’s revenue grew sharply from $48K in 2021 to $530K in 2025, with net losses fluctuating but generally high, reaching -$35M in 2025. Gross margin was deeply negative at -43%, and EBIT and net margins suffered steep losses, signaling operational challenges. Despite an 81% revenue increase in 2025, EBIT declined by 58%, although net margin improved by 64%, suggesting mixed operational efficiency.
Which one has the stronger fundamentals?
UiPath demonstrates stronger fundamentals with stable and high gross margins and steady revenue growth over five years, alongside improving net margin and EPS trends. Arqit shows impressive revenue growth percentages but struggles with negative gross and EBIT margins and volatile net losses. Overall, UiPath’s income statement reflects more consistent and favorable financial health compared to Arqit.
Financial Ratios Comparison
The table below presents a comparison of key financial ratios for UiPath Inc. and Arqit Quantum Inc. based on their most recent fiscal year data available.
| Ratios | UiPath Inc. (PATH) FY 2025 | Arqit Quantum Inc. (ARQQ) FY 2025 |
|---|---|---|
| ROE | -3.99% | -129.77% |
| ROIC | -7.41% | -127.45% |
| P/E | -108.04 | -15.12 |
| P/B | 4.31 | 19.62 |
| Current Ratio | 2.93 | 2.69 |
| Quick Ratio | 2.93 | 2.69 |
| D/E | 0.04 | 0.03 |
| Debt-to-Assets | 2.72% | 1.68% |
| Interest Coverage | 0 | -802.90 |
| Asset Turnover | 0.50 | 0.01 |
| Fixed Asset Turnover | 14.41 | 0.74 |
| Payout Ratio | 0 | 0 |
| Dividend Yield | 0 | 0 |
Interpretation of the Ratios
UiPath Inc.
UiPath displays a mixed ratio profile with 43% favorable and 50% unfavorable ratios, leading to a slightly unfavorable overall view. Key weaknesses include negative net margin (-5.15%) and return on equity (-3.99%), while liquidity ratios are strong with a current ratio of 2.93. The company does not pay dividends, reflecting its focus on reinvestment and growth.
Arqit Quantum Inc.
Arqit Quantum’s ratios are largely unfavorable, with 64% negative metrics and no neutral ratios. It shows extreme negative profitability measures, such as a net margin of -6668.49% and return on equity at -129.77%. Liquidity remains acceptable with a current ratio of 2.69. The company also does not pay dividends, likely prioritizing R&D and expansion over shareholder payouts.
Which one has the best ratios?
Comparing the two, UiPath Inc. has a stronger financial profile, with more favorable ratios and less severe profitability declines. Arqit Quantum faces more significant challenges, especially in profitability and efficiency measures. Overall, UiPath’s ratios indicate a relatively more stable financial position despite some concerns.
Strategic Positioning
This section compares the strategic positioning of UiPath Inc. and Arqit Quantum Inc., focusing on Market position, Key segments, and Exposure to technological disruption:
UiPath Inc.
- Large market cap of 7.7B, operating in established RPA software with moderate competitive pressure.
- Key segments include License, Subscription Services, and Professional Services driving diversified revenue streams.
- Combines AI with robotic process automation, offering a comprehensive automation platform, facing moderate technological disruption risk.
Arqit Quantum Inc.
- Smaller market cap of 416M, niche player in cybersecurity with high beta indicating volatility.
- Focused on QuantumCloud encryption software, targeting cybersecurity via satellite and terrestrial platforms.
- Operating in emerging quantum encryption technology, exposed to high technological disruption risks.
UiPath Inc. vs Arqit Quantum Inc. Positioning
UiPath has a diversified business model across multiple software and service segments, supporting steady revenue streams. Arqit is concentrated on a niche quantum cybersecurity technology, implying higher specialization but greater exposure to market and technological uncertainties.
Which has the best competitive advantage?
Both companies are slightly unfavorable in MOAT evaluation, shedding value despite growing ROIC trends. UiPath’s larger scale and diversified revenue provide some stability, but neither currently demonstrates a strong sustainable competitive advantage based on ROIC vs WACC.
Stock Comparison
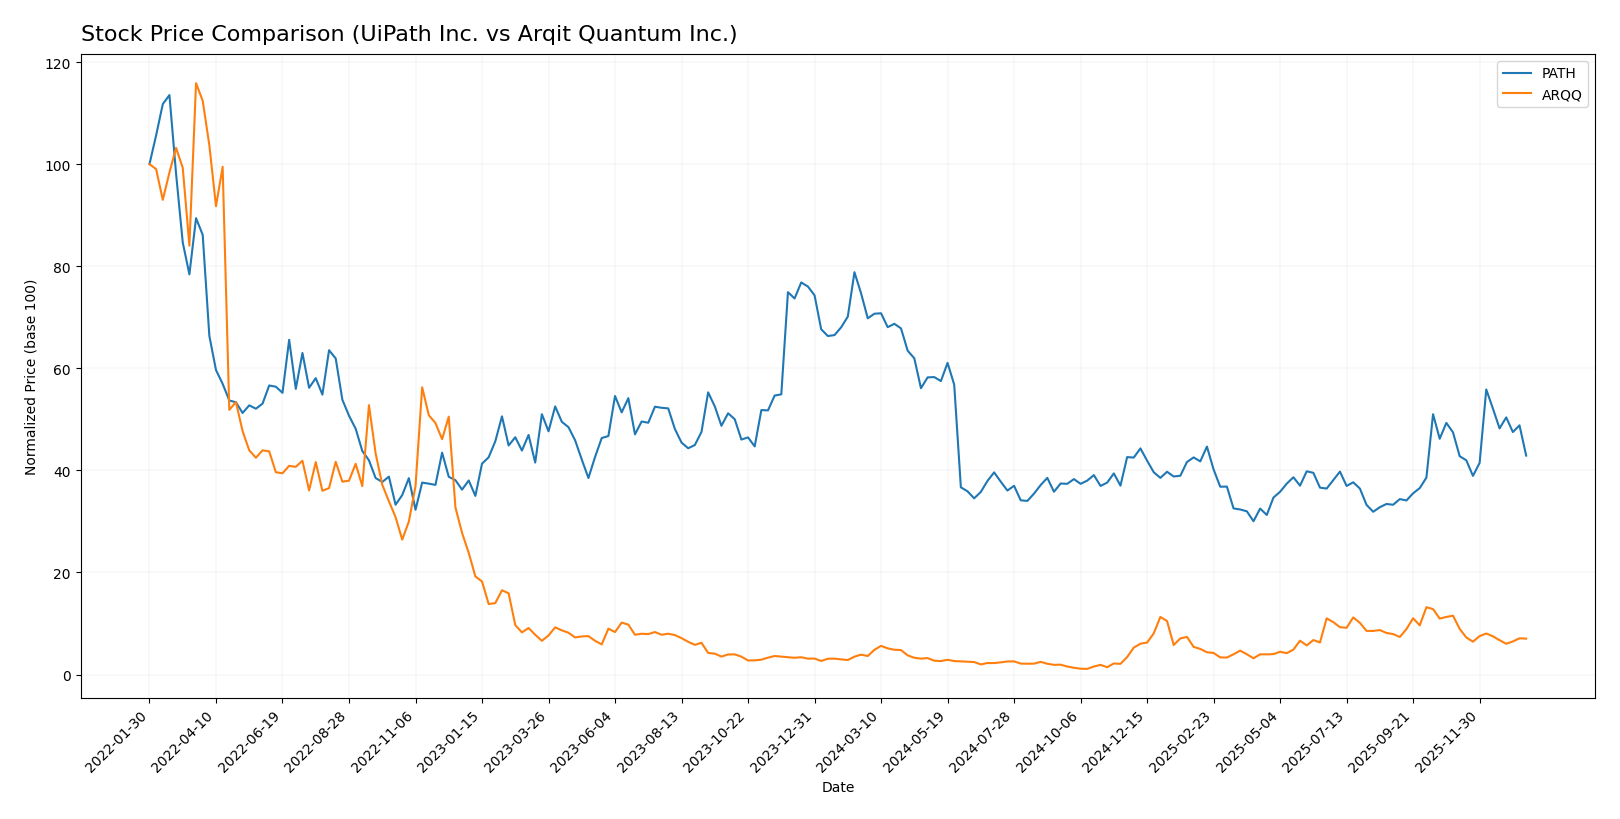
The stock price movements of UiPath Inc. and Arqit Quantum Inc. over the past year reveal contrasting trading dynamics, with UiPath experiencing a sustained decline and Arqit showing strong gains despite recent pullbacks.
Trend Analysis
UiPath Inc. (PATH) shows a bearish trend over the past 12 months with a price decrease of 38.53%, accompanied by acceleration in the decline and a standard deviation of 3.33. Its recent trend also remains negative with a 9.58% drop.
Arqit Quantum Inc. (ARQQ) exhibits a bullish trend over the past year, gaining 93.6%, though with deceleration and high volatility (std deviation 11.75). Recently, it faced a sharp 39.03% decline, indicating short-term weakness.
Comparing the two, Arqit Quantum delivered the highest market performance with strong annual gains, whereas UiPath experienced a consistent downward trend, reflecting divergent investor sentiment.
Target Prices
The current analyst consensus on target prices for UiPath Inc. and Arqit Quantum Inc. shows a mixed outlook with clear valuation ranges.
| Company | Target High | Target Low | Consensus |
|---|---|---|---|
| UiPath Inc. | 19 | 14 | 16.6 |
| Arqit Quantum Inc. | 60 | 60 | 60 |
Analysts expect UiPath’s stock to rise moderately above the current price of 14.34 USD, while Arqit Quantum’s target of 60 USD is significantly above its present price of 26.6 USD, indicating strong growth expectations.
Analyst Opinions Comparison
This section compares analysts’ ratings and grades for UiPath Inc. and Arqit Quantum Inc.:
Rating Comparison
UiPath Inc. Rating
- Rating: B+, indicating a very favorable status.
- Discounted Cash Flow Score: Moderate at 3.
- ROE Score: Favorable with a score of 4.
- ROA Score: Favorable at 4.
- Debt To Equity Score: Favorable at 4.
- Overall Score: Moderate with a value of 3.
Arqit Quantum Inc. Rating
- Rating: C, also marked as very favorable.
- Discounted Cash Flow Score: Moderate at 2.
- ROE Score: Very unfavorable with a score of 1.
- ROA Score: Very unfavorable at 1.
- Debt To Equity Score: Favorable at 4.
- Overall Score: Moderate with a value of 2.
Which one is the best rated?
Based strictly on the provided data, UiPath Inc. holds higher ratings and stronger scores in key areas such as ROE, ROA, and overall score compared to Arqit Quantum Inc., which has notably lower profitability scores.
Scores Comparison
Here is a comparison of the financial scores for UiPath Inc. and Arqit Quantum Inc.:
UiPath Inc. Scores
- Altman Z-Score: 5.27, indicating a safe zone, low bankruptcy risk.
- Piotroski Score: 7, categorized as strong financial health.
Arqit Quantum Inc. Scores
- Altman Z-Score: -0.22, in distress zone, high bankruptcy risk.
- Piotroski Score: 2, categorized as very weak financial health.
Which company has the best scores?
UiPath Inc. presents significantly stronger financial scores with a safe-zone Altman Z-Score and a strong Piotroski Score. Arqit Quantum Inc. falls in the distress zone with a very weak Piotroski Score, indicating higher financial risk.
Grades Comparison
Here is the comparison of recent grades and ratings for UiPath Inc. and Arqit Quantum Inc.:
UiPath Inc. Grades
The following table summarizes recent grades from major financial institutions for UiPath Inc.:
| Grading Company | Action | New Grade | Date |
|---|---|---|---|
| Barclays | Maintain | Equal Weight | 2026-01-12 |
| RBC Capital | Maintain | Sector Perform | 2026-01-05 |
| RBC Capital | Maintain | Sector Perform | 2025-12-10 |
| Morgan Stanley | Maintain | Equal Weight | 2025-12-09 |
| DA Davidson | Maintain | Neutral | 2025-12-05 |
| Canaccord Genuity | Maintain | Buy | 2025-12-04 |
| Mizuho | Maintain | Neutral | 2025-12-04 |
| RBC Capital | Maintain | Sector Perform | 2025-12-04 |
| Wells Fargo | Maintain | Equal Weight | 2025-12-04 |
| Evercore ISI Group | Maintain | In Line | 2025-12-04 |
The overall trend for UiPath shows predominantly neutral to hold-equivalent ratings with one buy rating, indicating a cautious but stable outlook.
Arqit Quantum Inc. Grades
The following table shows the grades from HC Wainwright & Co. for Arqit Quantum Inc.:
| Grading Company | Action | New Grade | Date |
|---|---|---|---|
| HC Wainwright & Co. | Maintain | Buy | 2025-10-13 |
| HC Wainwright & Co. | Maintain | Buy | 2025-09-18 |
| HC Wainwright & Co. | Maintain | Buy | 2024-12-31 |
| HC Wainwright & Co. | Maintain | Buy | 2024-12-06 |
| HC Wainwright & Co. | Maintain | Buy | 2024-07-11 |
| HC Wainwright & Co. | Maintain | Buy | 2024-05-29 |
| HC Wainwright & Co. | Maintain | Buy | 2024-05-15 |
| HC Wainwright & Co. | Maintain | Buy | 2023-11-22 |
| HC Wainwright & Co. | Maintain | Buy | 2023-09-27 |
| HC Wainwright & Co. | Maintain | Buy | 2023-09-26 |
Arqit Quantum received consistently positive buy ratings from a single reliable grading company over several years, reflecting sustained confidence.
Which company has the best grades?
Arqit Quantum Inc. has received consistently strong buy ratings, while UiPath Inc.’s grades mostly indicate neutral or hold stances. This difference may suggest higher analyst confidence in Arqit’s growth prospects, potentially influencing investor sentiment accordingly.
Strengths and Weaknesses
Below is a comparative overview of key strengths and weaknesses for UiPath Inc. (PATH) and Arqit Quantum Inc. (ARQQ) based on the latest financial and strategic data.
| Criterion | UiPath Inc. (PATH) | Arqit Quantum Inc. (ARQQ) |
|---|---|---|
| Diversification | Strong product diversification with significant revenue from Subscription Services (801.9M in 2025), License (587.2M), and Professional Services | Limited diversification; primarily focused on quantum encryption technology with no disclosed product revenue segmentation |
| Profitability | Negative net margin (-5.15%) and ROIC (-7.41%), though ROIC is improving; slightly unfavorable overall | Deeply negative profitability metrics (net margin -6668.49%, ROIC -127.45%); unfavorable status with growing ROIC trend |
| Innovation | Established in automation software with continuous ROIC growth (65.1% trend) indicating improving capital efficiency | Operates in a cutting-edge quantum encryption field, but financial performance remains weak with high costs and low asset turnover |
| Global presence | Well-positioned globally with a broad client base in software automation | Niche market focus, less global commercial penetration compared to PATH |
| Market Share | Leading player in robotic process automation (RPA) with strong subscription growth | Emerging player in quantum cybersecurity, market share not yet significant |
Key takeaways: UiPath shows stronger diversification and improving profitability despite current losses, benefiting from a growing subscription base. Arqit, while innovative, faces steep financial challenges and limited market penetration, indicating higher investment risk. Investors should weigh UiPath’s growth potential against Arqit’s early-stage status and volatility.
Risk Analysis
The table below summarizes key risks for UiPath Inc. and Arqit Quantum Inc. as of fiscal year 2025.
| Metric | UiPath Inc. (PATH) | Arqit Quantum Inc. (ARQQ) |
|---|---|---|
| Market Risk | Moderate (Beta 1.08) | High (Beta 2.41) |
| Debt Level | Low (Debt/Equity 0.04) | Low (Debt/Equity 0.03) |
| Regulatory Risk | Moderate (US tech sector) | Moderate (UK cybersecurity) |
| Operational Risk | Moderate (scale & complexity) | High (small team, scale challenges) |
| Environmental Risk | Low | Low |
| Geopolitical Risk | Moderate (US focus) | High (UK base, global operations) |
UiPath faces moderate market and operational risks but benefits from low debt and strong liquidity. Arqit exhibits higher market volatility and operational risks, compounded by financial distress signals and geopolitical exposure. The most impactful risks are Arqit’s financial instability and geopolitical uncertainties, while UiPath’s risks are more balanced but require monitoring of profitability trends.
Which Stock to Choose?
UiPath Inc. (PATH) shows a favorable income evolution with 9.3% revenue growth in 2025 and a strong 135% growth over 2021-2025. Its financial ratios reveal mixed signals: while profitability ratios are unfavorable, liquidity and low debt ratios are favorable. The company has a slightly unfavorable moat due to negative ROIC against WACC but improving profitability. PATH holds a very favorable B+ rating and strong financial scores reflecting moderate overall financial health.
Arqit Quantum Inc. (ARQQ) exhibits robust revenue growth of 80.9% in 2025 and over 1000% across five years, yet suffers from very unfavorable profitability and high negative margins. Its financial ratios are predominantly unfavorable, with a slightly unfavorable moat reflecting value destruction despite improved ROIC. ARQQ has a lower C rating with very weak financial scores, alongside higher financial risk indicators.
For investors, PATH may appear more suitable for those seeking companies with stable income growth and stronger ratings, while ARQQ could be interpreted as appealing to growth-focused investors willing to tolerate higher risk and volatility given its exceptional revenue expansion but weak profitability and financial health. The choice largely depends on the investor’s risk tolerance and strategy preference.
Disclaimer: Investment carries a risk of loss of initial capital. The past performance is not a reliable indicator of future results. Be sure to understand risks before making an investment decision.
Go Further
I encourage you to read the complete analyses of UiPath Inc. and Arqit Quantum Inc. to enhance your investment decisions: