In today’s fast-evolving technology landscape, StoneCo Ltd. and Arqit Quantum Inc. stand out as innovative players within the software infrastructure sector. StoneCo focuses on fintech solutions for merchants in Brazil, while Arqit pioneers quantum encryption cybersecurity from the UK. Despite their different markets, both companies emphasize cutting-edge technology to fuel growth. This article will help you decide which company offers the most compelling investment opportunity in 2026.
Table of contents
Companies Overview
I will begin the comparison between StoneCo Ltd. and Arqit Quantum Inc. by providing an overview of these two companies and their main differences.
StoneCo Ltd. Overview
StoneCo Ltd. provides financial technology solutions to merchants and integrated partners for electronic commerce across in-store, online, and mobile channels in Brazil. It primarily serves small- and medium-sized businesses, marketplaces, e-commerce platforms, and integrated software vendors. Headquartered in George Town, Cayman Islands, StoneCo operates through proprietary Stone Hubs, emphasizing hyper-local sales and services.
Arqit Quantum Inc. Overview
Arqit Quantum Inc. delivers cybersecurity services via satellite and terrestrial platforms in the United Kingdom. Its QuantumCloud product enables devices to generate encryption keys through lightweight software agents. Based in London, Arqit focuses on innovative quantum encryption technology with a small workforce, positioning itself within the technology and cybersecurity sectors.
Key similarities and differences
Both companies operate in the Software – Infrastructure industry within the technology sector and trade on NASDAQ exchanges. StoneCo’s business centers on fintech solutions for commerce in Brazil, while Arqit specializes in quantum cybersecurity in the UK. StoneCo has a larger market capitalization and workforce, contrasting with Arqit’s niche focus and smaller scale. Their geographic and operational scopes significantly differ despite shared industry classification.
Income Statement Comparison
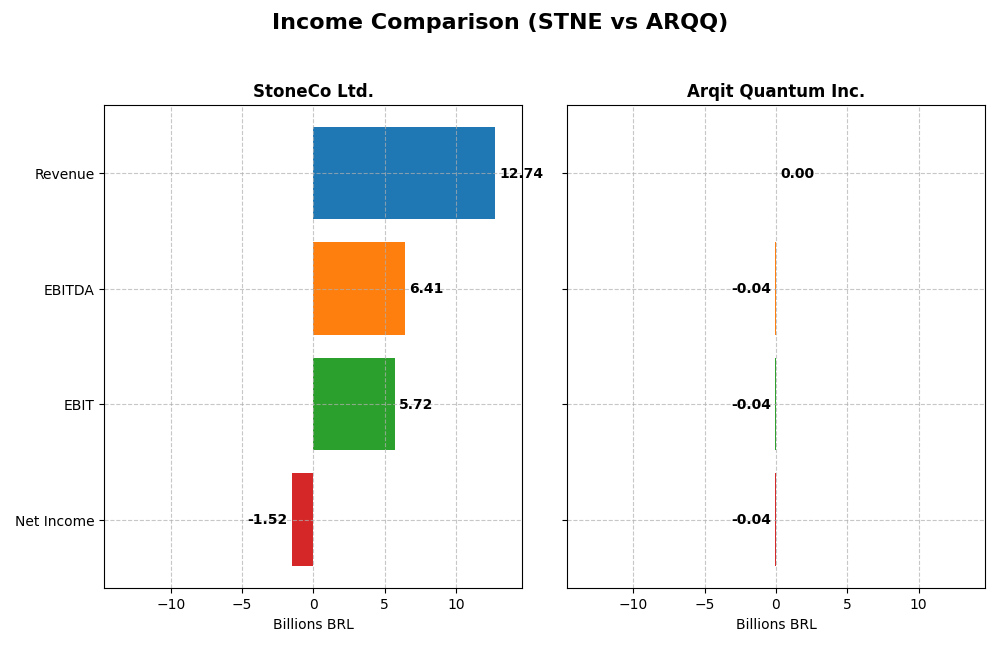
Below is the income statement comparison for StoneCo Ltd. and Arqit Quantum Inc., showing key financial metrics for the most recent fiscal year available for each company.
| Metric | StoneCo Ltd. (STNE) | Arqit Quantum Inc. (ARQQ) |
|---|---|---|
| Market Cap | 3.9B BRL | 416M USD |
| Revenue | 12.7B BRL | 530K USD |
| EBITDA | 6.4B BRL | -36.8M USD |
| EBIT | 5.7B BRL | -37.6M USD |
| Net Income | -1.5B BRL | -35.3M USD |
| EPS | -5.02 BRL | -2.56 USD |
| Fiscal Year | 2024 | 2025 |
Income Statement Interpretations
StoneCo Ltd.
StoneCo Ltd. showed strong revenue growth from 2020 to 2024, reaching BRL 12.74B in 2024, up 12.1% from 2023. Gross and EBIT margins remained favorable at 73.4% and 44.86%, respectively, reflecting operational efficiency. However, net income fell sharply to a loss of BRL 1.52B in 2024, with net margin turning negative, indicating profitability challenges despite top-line growth.
Arqit Quantum Inc.
Arqit Quantum’s revenue surged over 1000% from 2021 to 2025, with 2025 revenue at USD 530K, up 80.9% from 2024. Despite this, gross margin was deeply negative at -43.4%, and EBIT margin plummeted to -7,088%, highlighting significant operational losses. Net income losses narrowed somewhat in 2025, and net margin improved, indicating some progress in cost management.
Which one has the stronger fundamentals?
StoneCo exhibits robust revenue growth and strong gross and EBIT margins but struggles with net profitability, showing a large net loss in the most recent year. Arqit Quantum demonstrates impressive revenue growth and improving net margin but suffers from severe negative gross and operating margins. Both face profitability issues, yet StoneCo’s scale and margin stability contrast with Arqit’s high volatility and losses.
Financial Ratios Comparison
The table below presents the most recent fiscal year-end financial ratios for StoneCo Ltd. and Arqit Quantum Inc., enabling a clear side-by-side comparison of key performance metrics.
| Ratios | StoneCo Ltd. (2024) | Arqit Quantum Inc. (2025) |
|---|---|---|
| ROE | -12.87% | -129.77% |
| ROIC | 22.41% | -127.45% |
| P/E | -9.84 | -15.12 |
| P/B | 1.27 | 19.62 |
| Current Ratio | 1.37 | 2.69 |
| Quick Ratio | 1.37 | 2.69 |
| D/E | 1.10 | 0.03 |
| Debt-to-Assets | 23.53% | 1.68% |
| Interest Coverage | 5.57 | -802.90 |
| Asset Turnover | 0.23 | 0.01 |
| Fixed Asset Turnover | 6.95 | 0.74 |
| Payout Ratio | 0 | 0 |
| Dividend Yield | 0 | 0 |
Interpretation of the Ratios
StoneCo Ltd.
StoneCo Ltd. displays a mixed ratio profile with 50% favorable and 43% unfavorable metrics, resulting in a slightly favorable overall view. While return on invested capital (22.41%) and interest coverage (5.41) are strong, negative net margin (-11.89%) and return on equity (-12.87%) raise concerns. The company does not pay dividends, indicating possible reinvestment or growth focus.
Arqit Quantum Inc.
Arqit Quantum Inc. shows predominantly unfavorable ratios, with 64% negative and only 36% favorable metrics, leading to an unfavorable overall assessment. Key weaknesses include deeply negative net margin (-6,668%) and return on equity (-129.77%), coupled with poor asset turnover. Like StoneCo, Arqit pays no dividends, likely due to operating losses and a strategic focus on development.
Which one has the best ratios?
StoneCo Ltd. holds the advantage with a more balanced and slightly favorable ratio set, including positive returns and manageable debt levels. Arqit Quantum faces significant challenges with deeply negative profitability ratios and high valuation multiples, making its financial ratios less attractive comparatively.
Strategic Positioning
This section compares the strategic positioning of StoneCo Ltd. and Arqit Quantum Inc., covering Market position, Key segments, and Exposure to technological disruption:
StoneCo Ltd.
- Market position and competitive pressure
- Key segments and business drivers
- Exposure to technological disruption
Arqit Quantum Inc.
- Leading fintech provider in Brazil facing competitive tech market.
- Focused on financial technology solutions for merchants and partners.
- Operates in evolving fintech industry, adapting to digital commerce.
StoneCo Ltd. vs Arqit Quantum Inc. Positioning
StoneCo adopts a diversified approach serving 1.7M+ clients in fintech across multiple channels, benefiting from scale. Arqit is more concentrated on quantum encryption technology with a smaller workforce and market cap, implying greater specialization but narrower scope.
Which has the best competitive advantage?
StoneCo displays a very favorable moat with strong ROIC above WACC and growing profitability, indicating durable competitive advantage. Arqit shows slightly unfavorable moat, shedding value despite improving ROIC, suggesting weaker competitive positioning.
Stock Comparison
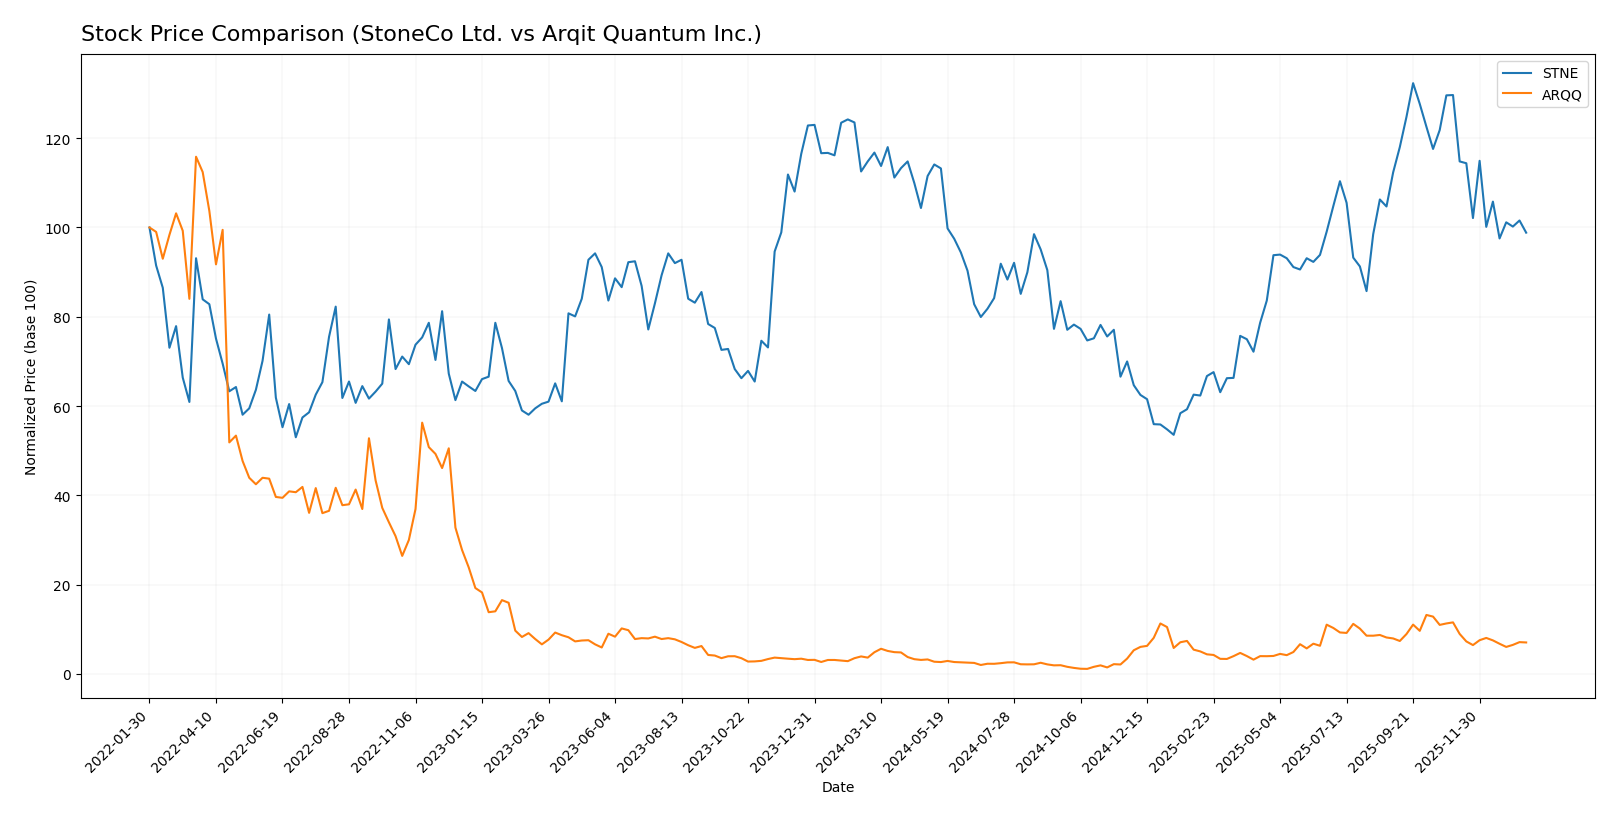
The past year has shown contrasting stock price movements for StoneCo Ltd. and Arqit Quantum Inc., with significant gains for Arqit Quantum and declines for StoneCo, reflecting divergent trading dynamics and market sentiment.
Trend Analysis
StoneCo Ltd.’s stock recorded a bearish trend over the past 12 months with a price decline of 13.9%, showing a deceleration in downward momentum and a standard deviation of 2.92. The highest price was 19.4 and the lowest 7.85.
Arqit Quantum Inc. exhibited a strong bullish trend with a 93.6% price increase over the same period, though recent months indicate a deceleration and increased volatility with a standard deviation of 11.75. The stock fluctuated between 4.19 and 49.92.
Comparing both stocks, Arqit Quantum delivered the highest market performance with a substantial price appreciation, while StoneCo’s stock experienced a notable decline over the past year.
Target Prices
The target price consensus for StoneCo Ltd. and Arqit Quantum Inc. shows clear analyst expectations.
| Company | Target High | Target Low | Consensus |
|---|---|---|---|
| StoneCo Ltd. | 20 | 20 | 20 |
| Arqit Quantum Inc. | 60 | 60 | 60 |
Analysts expect StoneCo Ltd.’s price to rise from the current $14.49 to $20, indicating potential upside. Arqit Quantum’s consensus target of $60 suggests significant growth above its current $26.60 market price.
Analyst Opinions Comparison
This section compares analysts’ ratings and grades for StoneCo Ltd. and Arqit Quantum Inc.:
Rating Comparison
StoneCo Ltd. Rating
- Rating: C, status Very Favorable
- Discounted Cash Flow Score: 3, Moderate score indicating moderate valuation potential
- Return on Equity Score: 1, Very Unfavorable, showing low efficiency in equity use
- Return on Assets Score: 1, Very Unfavorable, low asset utilization
- Debt To Equity Score: 1, Very Unfavorable, indicating higher financial risk
- Overall Score: 2, Moderate overall financial standing
Arqit Quantum Inc. Rating
- Rating: C, status Very Favorable
- Discounted Cash Flow Score: 2, Moderate score reflecting a balanced valuation outlook
- Return on Equity Score: 1, Very Unfavorable, indicating poor profit generation from equity
- Return on Assets Score: 1, Very Unfavorable, similarly low asset efficiency
- Debt To Equity Score: 4, Favorable, reflecting a stronger balance sheet and lower financial risk
- Overall Score: 2, Moderate overall financial standing
Which one is the best rated?
Both StoneCo Ltd. and Arqit Quantum Inc. share the same overall rating and moderate overall scores. However, Arqit Quantum Inc. has a notably better debt-to-equity score, indicating stronger financial stability compared to StoneCo Ltd.
Scores Comparison
Here is a comparison of the Altman Z-Score and Piotroski Score for StoneCo Ltd. and Arqit Quantum Inc.:
StoneCo Ltd. Scores
- Altman Z-Score: 1.02, indicating financial distress.
- Piotroski Score: 5, reflecting average financial health.
Arqit Quantum Inc. Scores
- Altman Z-Score: -0.22, indicating financial distress.
- Piotroski Score: 2, reflecting very weak financial health.
Which company has the best scores?
StoneCo Ltd. has better scores overall, with a higher Piotroski Score (5 versus 2) and a higher Altman Z-Score (1.02 versus -0.22), though both remain in the distress zone.
Grades Comparison
Here is a comparison of the recent grades assigned to StoneCo Ltd. and Arqit Quantum Inc.:
StoneCo Ltd. Grades
The table below summarizes StoneCo Ltd.’s recent grades from major financial institutions.
| Grading Company | Action | New Grade | Date |
|---|---|---|---|
| Goldman Sachs | Maintain | Buy | 2025-10-14 |
| B of A Securities | Maintain | Buy | 2025-09-09 |
| UBS | Maintain | Buy | 2025-08-29 |
| JP Morgan | Maintain | Overweight | 2025-07-16 |
| Barclays | Maintain | Equal Weight | 2025-05-12 |
| Barclays | Maintain | Equal Weight | 2025-04-23 |
| Citigroup | Upgrade | Buy | 2025-04-22 |
| Barclays | Maintain | Equal Weight | 2025-03-21 |
| Morgan Stanley | Maintain | Underweight | 2025-03-21 |
| Goldman Sachs | Maintain | Buy | 2025-02-06 |
StoneCo Ltd. shows a predominantly positive rating trend, with most institutions maintaining Buy or Overweight ratings and a recent upgrade by Citigroup.
Arqit Quantum Inc. Grades
The table below summarizes Arqit Quantum Inc.’s recent grades from HC Wainwright & Co.
| Grading Company | Action | New Grade | Date |
|---|---|---|---|
| HC Wainwright & Co. | Maintain | Buy | 2025-10-13 |
| HC Wainwright & Co. | Maintain | Buy | 2025-09-18 |
| HC Wainwright & Co. | Maintain | Buy | 2024-12-31 |
| HC Wainwright & Co. | Maintain | Buy | 2024-12-06 |
| HC Wainwright & Co. | Maintain | Buy | 2024-07-11 |
| HC Wainwright & Co. | Maintain | Buy | 2024-05-29 |
| HC Wainwright & Co. | Maintain | Buy | 2024-05-15 |
| HC Wainwright & Co. | Maintain | Buy | 2023-11-22 |
| HC Wainwright & Co. | Maintain | Buy | 2023-09-27 |
| HC Wainwright & Co. | Maintain | Buy | 2023-09-26 |
Arqit Quantum’s grades are consistently maintained at Buy by a single grading company over a long period.
Which company has the best grades?
StoneCo Ltd. has received a broader range of grades from multiple reputable firms, mostly Buy and Overweight, with some Hold ratings, showing diverse analyst confidence. Arqit Quantum Inc. has consistent Buy ratings exclusively from HC Wainwright & Co. Investors might view StoneCo’s diversified analyst coverage as a sign of broader market validation compared to Arqit’s single-source consistency.
Strengths and Weaknesses
Below is a comparative overview of key strengths and weaknesses for StoneCo Ltd. (STNE) and Arqit Quantum Inc. (ARQQ), based on their most recent financial and strategic data.
| Criterion | StoneCo Ltd. (STNE) | Arqit Quantum Inc. (ARQQ) |
|---|---|---|
| Diversification | Moderate; focused on financial tech | Limited; niche in quantum encryption tech |
| Profitability | Mixed; strong ROIC (22.41%) but negative net margin (-11.89%) | Poor; negative margins and ROIC (-127.45%) |
| Innovation | Solid fintech product development | High potential in quantum security |
| Global presence | Regional focus in Latin America | Global ambitions but early-stage execution |
| Market Share | Growing in Brazil’s fintech sector | Small, emerging player in quantum space |
StoneCo demonstrates a durable competitive advantage with strong capital efficiency despite profitability challenges, while Arqit shows innovative promise but struggles with value creation and consistent profitability. Investors should weigh StoneCo’s operational efficiency against Arqit’s high-risk, high-reward profile.
Risk Analysis
Below is a comparison of key risks faced by StoneCo Ltd. (STNE) and Arqit Quantum Inc. (ARQQ) based on their latest financial and operational data in 2026.
| Metric | StoneCo Ltd. (STNE) | Arqit Quantum Inc. (ARQQ) |
|---|---|---|
| Market Risk | Moderate (Beta 1.84) | High (Beta 2.41) |
| Debt Level | Elevated (Debt-to-Equity 1.1) | Low (Debt-to-Equity 0.03) |
| Regulatory Risk | Moderate (Brazilian fintech) | High (UK quantum cybersecurity) |
| Operational Risk | Moderate (7,239 employees) | High (Small size, 82 employees) |
| Environmental Risk | Low | Low |
| Geopolitical Risk | Moderate (Brazil, Cayman Is.) | High (UK, global quantum tech) |
StoneCo faces moderate market and regulatory risks with elevated debt, but benefits from a robust operational scale. Arqit carries higher market, regulatory, and geopolitical risks due to its niche quantum cybersecurity focus and smaller scale. Both companies show financial distress signals, with Arqit’s risks and financial weakness more pronounced recently.
Which Stock to Choose?
StoneCo Ltd. (STNE) has shown favorable income growth with 12.1% revenue increase and a strong gross margin of 73.4%, despite a negative net margin of -11.89%. Its ROIC at 22.41% exceeds WACC, signaling value creation, but profitability ratios like ROE are unfavorable. Debt levels are moderate with mixed ratio evaluations, and its overall rating is very favorable.
Arqit Quantum Inc. (ARQQ) displays rapid revenue growth of 80.89% and improving income statement metrics, yet suffers from deeply negative profitability ratios, including a net margin of -6668.49% and negative ROIC versus WACC, indicating value destruction. Its debt profile is low, supported by favorable liquidity ratios, but the overall financial ratios evaluation is unfavorable, with a very favorable rating status.
Investors seeking companies with durable competitive advantages and steady profitability might find StoneCo’s profile more aligned with quality or value strategies, while those with higher risk tolerance focusing on rapid growth potential could interpret Arqit’s improving trends as early-stage opportunity despite its current financial challenges.
Disclaimer: Investment carries a risk of loss of initial capital. The past performance is not a reliable indicator of future results. Be sure to understand risks before making an investment decision.
Go Further
I encourage you to read the complete analyses of StoneCo Ltd. and Arqit Quantum Inc. to enhance your investment decisions: