Home > Comparison > Technology > PLTR vs ARQQ
The strategic rivalry between Palantir Technologies Inc. and Arqit Quantum Inc. shapes the future of technology infrastructure software. Palantir operates as a capital-intensive data analytics powerhouse with broad government and commercial applications. Arqit focuses on cutting-edge quantum cybersecurity solutions with a leaner operational footprint. This analysis pits Palantir’s scale and established platform against Arqit’s innovation, aiming to identify which trajectory offers superior risk-adjusted returns for a diversified portfolio.

Table of contents
Companies Overview
Palantir Technologies and Arqit Quantum both play pivotal roles in the evolving software infrastructure landscape.
Palantir Technologies Inc.: Data Integration Powerhouse
Palantir dominates the software infrastructure sector with its advanced data analytics platforms. It generates revenue by deploying Gotham and Foundry software to governments and enterprises for intelligence and operational efficiency. In 2026, Palantir focuses on expanding its AI-driven capabilities and seamless software delivery with Palantir Apollo and its Artificial Intelligence Platform, reinforcing its competitive edge in data transformation.
Arqit Quantum Inc.: Quantum Cybersecurity Innovator
Arqit specializes in cybersecurity through satellite and terrestrial platforms, offering QuantumCloud encryption technology. Its core revenue driver is enabling secure communications by creating encryption keys between devices via lightweight software agents. In 2026, Arqit concentrates on scaling its quantum encryption services, targeting increased adoption in government and critical infrastructure sectors.
Strategic Collision: Similarities & Divergences
Both companies emphasize software infrastructure but with contrasting philosophies: Palantir leverages data integration and AI while Arqit pioneers in quantum encryption security. Their primary battleground centers on securing sensitive data—Palantir through analytics, Arqit via encryption. Investors face distinct profiles: Palantir offers a broad data platform with scale, while Arqit presents a niche, high-risk quantum cybersecurity play.
Income Statement Comparison
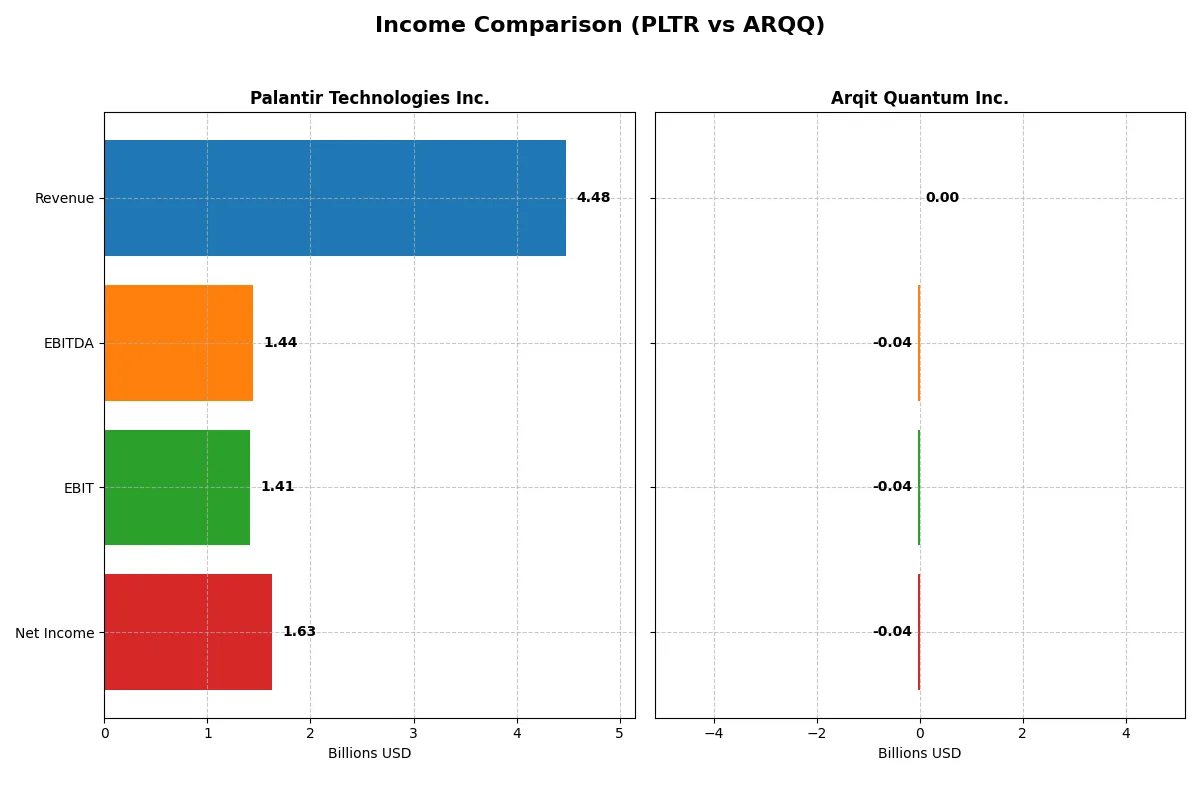
This data dissects the core profitability and scalability of both corporate engines to reveal who dominates the bottom line:
| Metric | Palantir Technologies Inc. (PLTR) | Arqit Quantum Inc. (ARQQ) |
|---|---|---|
| Revenue | 4.48B | 530K |
| Cost of Revenue | 789M | 760K |
| Operating Expenses | 2.27B | 38.7M |
| Gross Profit | 3.69B | -230K |
| EBITDA | 1.44B | -36.8M |
| EBIT | 1.41B | -37.6M |
| Interest Expense | 0 | 48K |
| Net Income | 1.63B | -35.3M |
| EPS | 0.69 | -2.56 |
| Fiscal Year | 2025 | 2025 |
Income Statement Analysis: The Bottom-Line Duel
This income statement comparison reveals which company delivers superior operational efficiency and bottom-line profitability.
Palantir Technologies Inc. Analysis
Palantir’s revenue surged from 1.54B in 2021 to 4.48B in 2025, with net income swinging from a 520M loss to 1.63B profit. Its gross margin consistently exceeds 80%, reflecting strong cost control. In 2025, Palantir’s net margin hit 36.3%, showcasing remarkable efficiency and scaling momentum.
Arqit Quantum Inc. Analysis
Arqit’s revenue rose from 48K in 2021 to 530K in 2025, yet it remains deeply unprofitable with a 35M net loss in 2025. Negative gross margins highlight product cost challenges. Despite 81% revenue growth in the past year, its EBIT margin plunged further into negative territory, signaling ongoing operational inefficiency.
Margin Mastery vs. Growth Struggle
Palantir dominates with robust margins and accelerating profitability, while Arqit shows impressive top-line growth but persistent losses and weak margin control. The clear fundamental winner is Palantir, offering a scalable, efficient business. Investors seeking operational strength and profit expansion find Palantir’s profile more compelling.
Financial Ratios Comparison
These vital ratios act as a diagnostic tool to expose the underlying fiscal health, valuation premiums, and capital efficiency of the companies compared below:
| Ratios | Palantir Technologies Inc. (PLTR) | Arqit Quantum Inc. (ARQQ) |
|---|---|---|
| ROE | 22.0% | -129.8% |
| ROIC | 17.9% | -127.5% |
| P/E | 259.2x | -15.1x |
| P/B | 57.0x | 19.6x |
| Current Ratio | 7.11 | 2.69 |
| Quick Ratio | 7.11 | 2.69 |
| D/E (Debt-to-Equity) | 0.031 | 0.026 |
| Debt-to-Assets | 2.58% | 1.68% |
| Interest Coverage | 0 (not meaningful) | -803 (negative) |
| Asset Turnover | 0.50 | 0.012 |
| Fixed Asset Turnover | 17.76 | 0.74 |
| Payout Ratio | 0% | 0% |
| Dividend Yield | 0% | 0% |
| Fiscal Year | 2025 | 2025 |
Efficiency & Valuation Duel: The Vital Signs
Financial ratios act as the company’s DNA, revealing hidden risks and operational excellence that raw numbers alone cannot expose.
Palantir Technologies Inc.
Palantir shows strong profitability with a 22% ROE and a robust 36.31% net margin, signaling efficient operations. However, its valuation is stretched, with a P/E of 259.19 and a P/B of 57.02. The company retains earnings for growth, as it pays no dividend, focusing on R&D and innovation.
Arqit Quantum Inc.
Arqit suffers from deeply negative profitability metrics, including a -129.77% ROE and -6668.49% net margin, reflecting operational distress. Despite a negative P/E indicating losses, its current ratio of 2.69 offers liquidity comfort. The firm does not pay dividends, likely reinvesting to stabilize or pivot its business model.
Premium Valuation vs. Operational Safety
Palantir balances strong profitability against an elevated valuation, representing growth potential with risk of price correction. Arqit displays weak fundamentals and liquidity risks despite a better current ratio. Investors seeking operational strength may prefer Palantir’s profile, while those with high risk tolerance might consider Arqit’s turnaround potential.
Which one offers the Superior Shareholder Reward?
I find Palantir Technologies (PLTR) outshines Arqit Quantum (ARQQ) in shareholder reward. PLTR pays no dividends but boasts robust free cash flow (0.89/share in 2025) and a disciplined capital allocation with minimal capex (0.01/share). It sustains a strong current ratio (~7.1) and negligible debt, ensuring financial flexibility. PLTR’s aggressive buybacks amplify shareholder returns, compensating for the absence of dividends. Conversely, ARQQ neither pays dividends nor generates positive free cash flow; it suffers massive losses, negative margins, and erratic cash flow, reflecting a high-risk reinvestment strategy in quantum tech. Its buyback activity is non-existent, and financial leverage is elevated. Given PLTR’s sustainable free cash flow-backed buybacks and low payout risk, I judge it offers a superior total return profile for 2026 investors.
Comparative Score Analysis: The Strategic Profile
The radar chart reveals the fundamental DNA and trade-offs of Palantir Technologies Inc. and Arqit Quantum Inc., highlighting their core financial strengths and vulnerabilities:
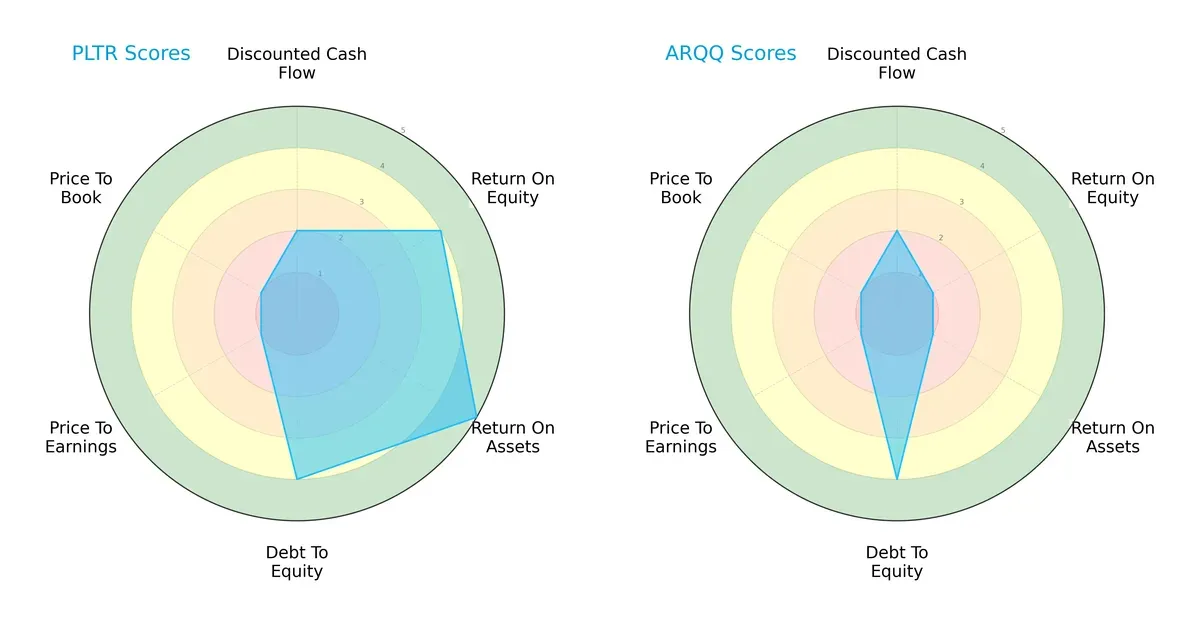
Palantir shows a more balanced profile with strong ROE (4) and ROA (5) scores, indicating efficient profit generation and asset use. It also maintains favorable debt management (4). Arqit, however, relies heavily on its manageable debt (4) but scores poorly on profitability (ROE 1, ROA 1). Both firms suffer from very unfavorable valuation scores (P/E and P/B at 1), signaling potential overvaluation or market skepticism.
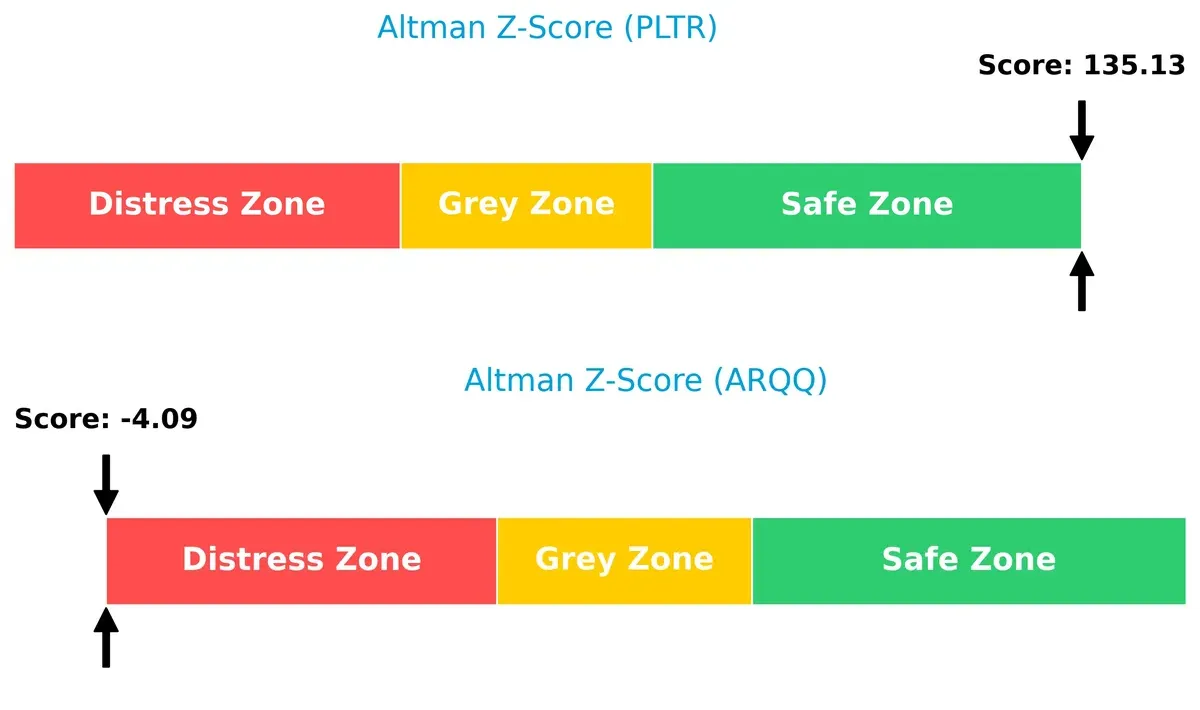
Bankruptcy Risk: Solvency Showdown
Palantir’s Altman Z-Score sits deep in the safe zone (135.1), while Arqit falls in the distress zone (-4.1). This stark difference signals Palantir’s robust solvency and long-term survival prospects versus Arqit’s high bankruptcy risk in this cycle:
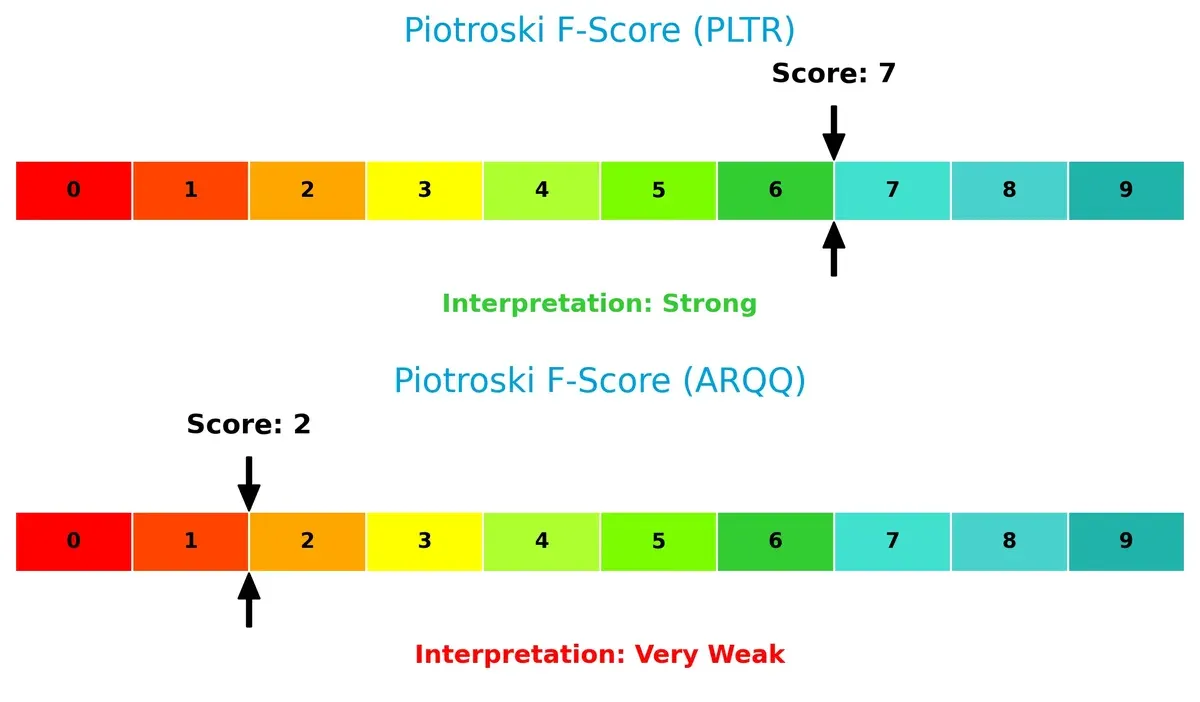
Financial Health: Quality of Operations
Palantir’s Piotroski F-Score of 7 reflects strong internal financial health, highlighting operational quality and stability. Arqit’s low score of 2 flags serious red flags in profitability and liquidity, underlining significant financial weakness:
How are the two companies positioned?
This section dissects the operational DNA of Palantir and Arqit by comparing their revenue distribution and internal strengths and weaknesses. The final goal is to confront their economic moats to identify which business model offers the most resilient competitive advantage today.
Revenue Segmentation: The Strategic Mix
This visual comparison dissects how Palantir Technologies Inc. and Arqit Quantum Inc. diversify their income streams and where their primary sector bets lie:
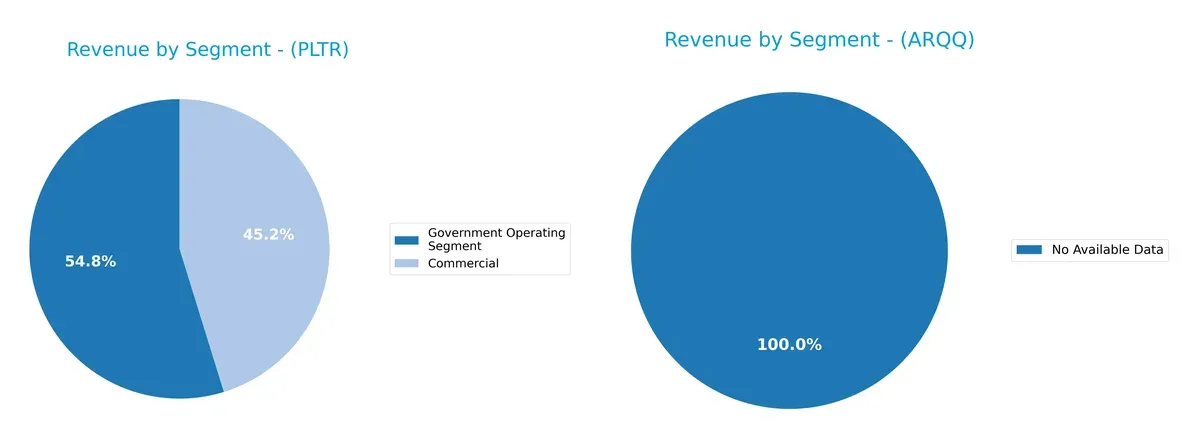
Palantir’s revenue pivots between Commercial ($1.3B) and Government ($1.57B) segments, showing a moderately balanced mix. Arqit Quantum lacks available data, preventing segmentation analysis. Palantir’s near parity between sectors reduces concentration risk and leverages government infrastructure dominance, while its commercial growth anchors future expansion. This dual-segment approach strengthens its ecosystem lock-in compared to a single-sector reliance.
Strengths and Weaknesses Comparison
This table compares the Strengths and Weaknesses of Palantir Technologies Inc. and Arqit Quantum Inc.:
Palantir Strengths
- Strong profitability with 36.31% net margin and 22% ROE
- Robust low debt levels with 0.03 debt-to-equity ratio
- High fixed asset turnover of 17.76 indicates efficient asset use
- Diversified revenue across commercial and government segments
- Global presence with significant US and UK market shares
Arqit Strengths
- Favorable price-to-earnings ratio despite losses
- Solid liquidity with 2.69 current and quick ratios
- Low leverage with 0.03 debt-to-equity and 1.68% debt-to-assets
- Global sales presence, albeit limited, with revenues in other countries
Palantir Weaknesses
- Elevated valuation multiples; PE at 259.19 and PB at 57.02 suggest overvaluation risks
- Unfavorable current ratio of 7.11 signals potential balance sheet structure issues
- Weighted average cost of capital (11.79%) exceeds ROIC, impacting capital efficiency
- No dividend yield may deter income-focused investors
Arqit Weaknesses
- Very poor profitability metrics with negative ROE and ROIC
- Negative net margin at -6668.49% reflects heavy losses
- Weak asset turnover ratios show inefficiency
- Negative interest coverage ratio raises solvency concerns
- No dividend yield and unfavorable PB ratio at 19.62
Palantir’s strengths lie in profitability, asset efficiency, and diversified revenues, but its high valuation and some liquidity concerns present risks. Arqit faces significant profitability and operational challenges despite solid liquidity and low debt, highlighting the need for improved capital allocation and growth strategies.
The Moat Duel: Analyzing Competitive Defensibility
A structural moat alone shields long-term profits from relentless competition erosion, ensuring sustained value creation and market dominance:
Palantir Technologies Inc.: Data Integration Switchboard
Palantir’s moat stems from intense switching costs embedded in its integrated data platforms. Its 31.6% EBIT margin and 6.2% ROIC above WACC confirm strong value creation. Expanding AI-driven analytics in 2026 could deepen this advantage.
Arqit Quantum Inc.: Emerging Quantum Encryption
Arqit leverages cutting-edge quantum encryption, a nascent intangible asset moat contrasting Palantir’s entrenched switching costs. Despite steep losses, its improving ROIC signals growing operational efficiency. Future satellite cybersecurity rollouts may disrupt markets.
Moat Faceoff: Switching Costs vs. Quantum Innovation
Palantir holds a wider, more proven moat with robust profitability and capital efficiency. Arqit shows promise but remains value-destructive and less established. Palantir is better positioned to defend its market share in 2026.
Which stock offers better returns?
Over the past year, Palantir Technologies Inc. surged over 465%, despite recent deceleration and a short-term 14% pullback. Arqit Quantum Inc. declined by 9%, showing a persistent bearish trend and accelerating losses recently.
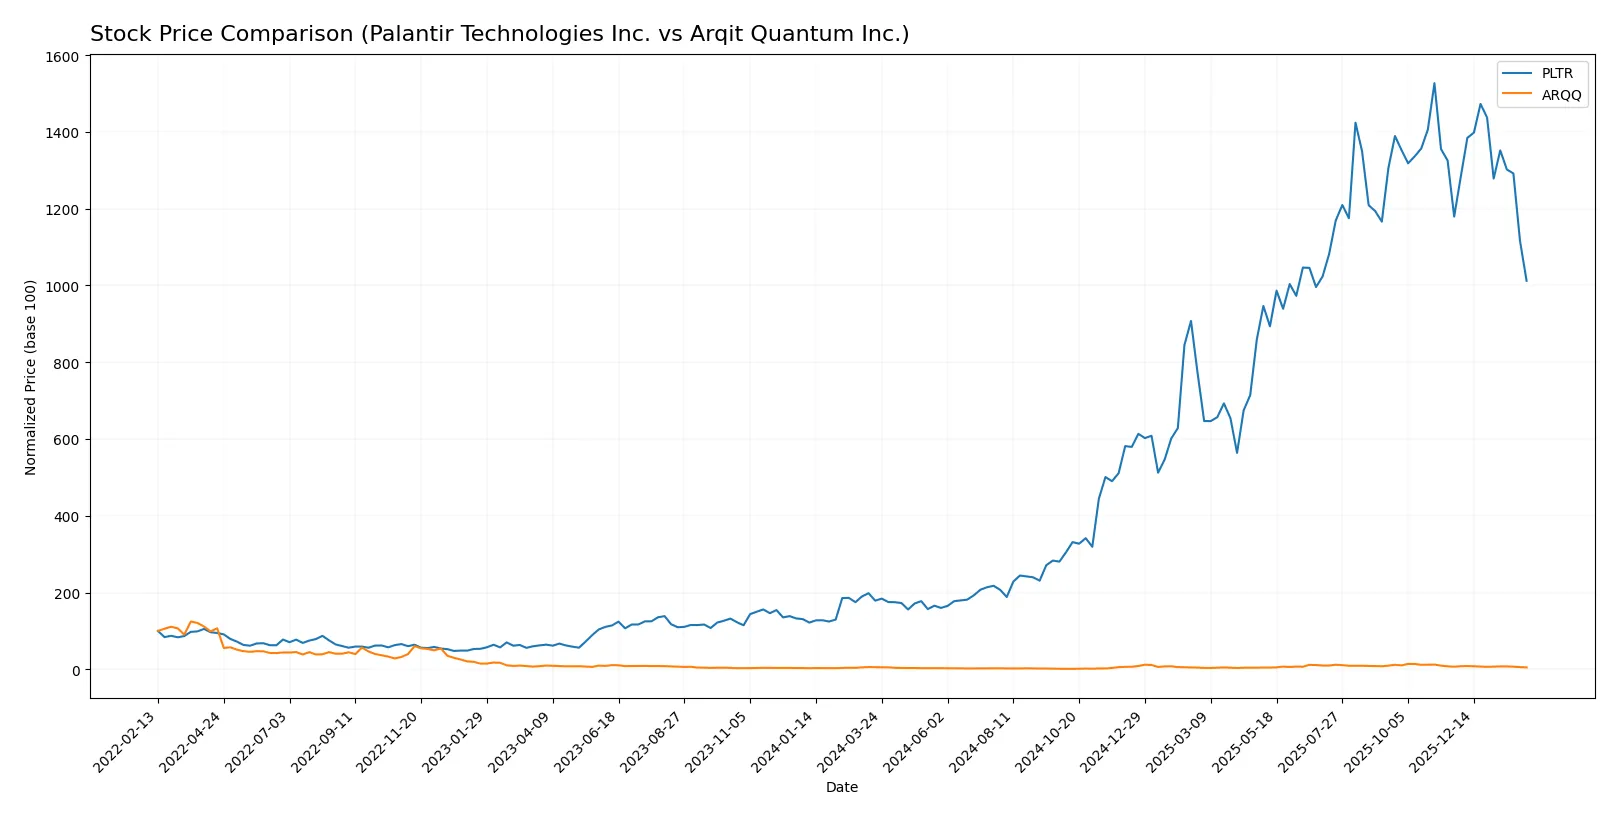
Trend Comparison
Palantir Technologies Inc. recorded a strong 465.71% price increase over 12 months, signaling a bullish trend with decelerating momentum and a high volatility (59.51 std deviation). The highest price reached was 200.47, and the lowest was 20.47.
Arqit Quantum Inc. experienced a 9.18% price decline over the same period, confirming a bearish trend with decelerating losses. Volatility is lower (11.73 std deviation), with a high of 49.92 and a low of 4.19.
Palantir’s stock significantly outperformed Arqit’s, delivering the highest market returns despite recent short-term weakness in both stocks.
Target Prices
Analysts present a bullish consensus on Palantir Technologies Inc. and Arqit Quantum Inc., reflecting strong growth expectations.
| Company | Target Low | Target High | Consensus |
|---|---|---|---|
| Palantir Technologies Inc. | 180 | 230 | 200.14 |
| Arqit Quantum Inc. | 60 | 60 | 60 |
The target consensus for Palantir at $200 significantly exceeds its current price of $132, indicating upside potential. Arqit’s $60 target remains well above its $17 price, suggesting high growth expectations but also elevated risk.

Don’t Let Luck Decide Your Entry Point
Optimize your entry points with our advanced ProRealTime indicators. You’ll get efficient buy signals with precise price targets for maximum performance. Start outperforming now!
How do institutions grade them?
The following tables summarize recent institutional grades for Palantir Technologies Inc. and Arqit Quantum Inc.:
Palantir Technologies Inc. Grades
This table shows recent grade actions from major financial institutions for Palantir Technologies Inc.
| Grading Company | Action | New Grade | Date |
|---|---|---|---|
| Citigroup | Maintain | Buy | 2026-02-03 |
| UBS | Maintain | Neutral | 2026-02-03 |
| DA Davidson | Maintain | Neutral | 2026-02-03 |
| Citigroup | Upgrade | Buy | 2026-01-12 |
| UBS | Maintain | Neutral | 2025-11-04 |
| DA Davidson | Maintain | Neutral | 2025-11-04 |
| Baird | Maintain | Neutral | 2025-11-04 |
| Piper Sandler | Maintain | Overweight | 2025-11-04 |
| Morgan Stanley | Maintain | Equal Weight | 2025-11-04 |
| B of A Securities | Maintain | Buy | 2025-11-04 |
Arqit Quantum Inc. Grades
This table presents multiple buy ratings maintained by HC Wainwright & Co. for Arqit Quantum Inc.
| Grading Company | Action | New Grade | Date |
|---|---|---|---|
| HC Wainwright & Co. | Maintain | Buy | 2025-10-13 |
| HC Wainwright & Co. | Maintain | Buy | 2025-09-18 |
| HC Wainwright & Co. | Maintain | Buy | 2024-12-31 |
| HC Wainwright & Co. | Maintain | Buy | 2024-12-06 |
| HC Wainwright & Co. | Maintain | Buy | 2024-07-11 |
| HC Wainwright & Co. | Maintain | Buy | 2024-05-29 |
| HC Wainwright & Co. | Maintain | Buy | 2024-05-15 |
| HC Wainwright & Co. | Maintain | Buy | 2023-11-22 |
| HC Wainwright & Co. | Maintain | Buy | 2023-09-27 |
| HC Wainwright & Co. | Maintain | Buy | 2023-09-26 |
Which company has the best grades?
Arqit Quantum consistently holds a pure “Buy” rating from a single firm, showing stability in bullish sentiment. Palantir’s mixed grades include “Buy,” “Neutral,” and “Overweight,” indicating varied analyst views. Investors may interpret Arqit’s uniformity as clearer institutional confidence, while Palantir’s diversity suggests more nuanced risk assessment.
Risks specific to each company
The following categories identify the critical pressure points and systemic threats facing both firms in the 2026 market environment:
1. Market & Competition
Palantir Technologies Inc.
- Dominates with a 301B market cap and strong sector presence but faces stiff tech competition.
Arqit Quantum Inc.
- Small 271M market cap; niche quantum cybersecurity market with uncertain adoption rates.
2. Capital Structure & Debt
Palantir Technologies Inc.
- Low debt-to-equity (0.03) and strong interest coverage indicate prudent leverage management.
Arqit Quantum Inc.
- Also low debt (0.03), but negative interest coverage signals financial distress risk.
3. Stock Volatility
Palantir Technologies Inc.
- Beta 1.69 shows above-average volatility but within typical tech sector range.
Arqit Quantum Inc.
- Beta 2.41 reveals very high volatility, increasing investment risk significantly.
4. Regulatory & Legal
Palantir Technologies Inc.
- Operates globally with exposure to data privacy and government contract regulations.
Arqit Quantum Inc.
- UK-based; faces emerging cybersecurity regulatory frameworks and potential export controls.
5. Supply Chain & Operations
Palantir Technologies Inc.
- Robust platform deployment capability globally; operational scale reduces supply risk.
Arqit Quantum Inc.
- Small team (82 employees) limits operational scalability and supply chain resilience.
6. ESG & Climate Transition
Palantir Technologies Inc.
- Large footprint demands rigorous ESG compliance; sector under increasing scrutiny.
Arqit Quantum Inc.
- Newer firm with less ESG track record; potential risk from evolving climate regulations.
7. Geopolitical Exposure
Palantir Technologies Inc.
- US-based with extensive intelligence community ties; geopolitical tensions can impact contracts.
Arqit Quantum Inc.
- UK-based with exposure to Brexit aftermath and global quantum tech competition risks.
Which company shows a better risk-adjusted profile?
Palantir’s dominant market position and strong balance sheet provide a safer risk-adjusted profile. Arqit faces heightened risks from financial distress and extreme stock volatility. Palantir’s 135 Altman Z-score vs. Arqit’s distress-level score confirms superior financial stability. I’m concerned about Arqit’s negative margins and weak operational metrics, which amplify investment risk.
Final Verdict: Which stock to choose?
Palantir Technologies Inc. wields unmatched operational efficiency and a robust economic moat, evidenced by its strong ROIC well above WACC. Its capacity to generate substantial free cash flow underpins sustainable value creation. A point of vigilance remains its lofty valuation multiples, which could pressure returns if growth slows. It suits portfolios aiming for aggressive growth with a tolerance for premium pricing.
Arqit Quantum Inc. offers a strategic moat centered on cutting-edge quantum encryption technology, positioning it in a niche with high entry barriers. Relative to Palantir, it carries greater financial risk and weaker profitability metrics, reflecting an early-stage growth profile. Its appeal lies in GARP (Growth at a Reasonable Price) portfolios seeking exposure to nascent innovation with cautious risk appetite.
If you prioritize consistent value creation and operational strength, Palantir outshines with superior profitability and margin expansion, rewarding investors willing to pay a premium. However, if you seek speculative growth with exposure to pioneering quantum tech, Arqit could offer asymmetric upside despite its financial fragility. Each choice aligns with distinct investor profiles balancing growth ambitions against risk tolerance.
Disclaimer: Investment carries a risk of loss of initial capital. The past performance is not a reliable indicator of future results. Be sure to understand risks before making an investment decision.
Go Further
I encourage you to read the complete analyses of Palantir Technologies Inc. and Arqit Quantum Inc. to enhance your investment decisions: