In the fast-evolving technology sector, Okta, Inc. and Arqit Quantum Inc. stand out as innovators in software infrastructure, each addressing cybersecurity with unique approaches. Okta focuses on identity management for enterprises worldwide, while Arqit pioneers quantum encryption technology from the UK. Their shared commitment to security and cutting-edge solutions makes this comparison compelling. Join me as we explore which company offers the most promising investment opportunity in 2026.

Table of contents
Companies Overview
I will begin the comparison between Okta and Arqit Quantum by providing an overview of these two companies and their main differences.
Okta Overview
Okta, Inc. is a San Francisco-based company specializing in identity solutions for enterprises and various organizations worldwide. Its Okta Identity Cloud platform includes products such as Single Sign-On, Adaptive Multi-Factor Authentication, and Lifecycle Management, aimed at securing user access and managing identities. Okta serves a broad client base, including businesses, universities, and government agencies, positioning itself as a leader in software infrastructure with a market cap of approximately 15.2B USD.
Arqit Quantum Overview
Arqit Quantum Inc., headquartered in London, UK, provides cybersecurity services using satellite and terrestrial platforms. Its flagship product, QuantumCloud, allows devices to create encryption keys through a lightweight software agent. The company operates primarily in software infrastructure with a focus on advanced encryption technology. Arqit has a smaller footprint with about 82 employees and a market cap near 416M USD, reflecting its niche specialization within the technology sector.
Key similarities and differences
Both Okta and Arqit operate in the software infrastructure industry, focusing on security solutions, but their approaches differ significantly. Okta emphasizes identity management and access security across cloud and on-premise environments, targeting a wide customer base. In contrast, Arqit specializes in quantum encryption technology delivered via satellite platforms, catering to cybersecurity needs with a more technical and niche focus. Market capitalization and scale also highlight Okta’s broader market presence compared to Arqit’s emerging status.
Income Statement Comparison
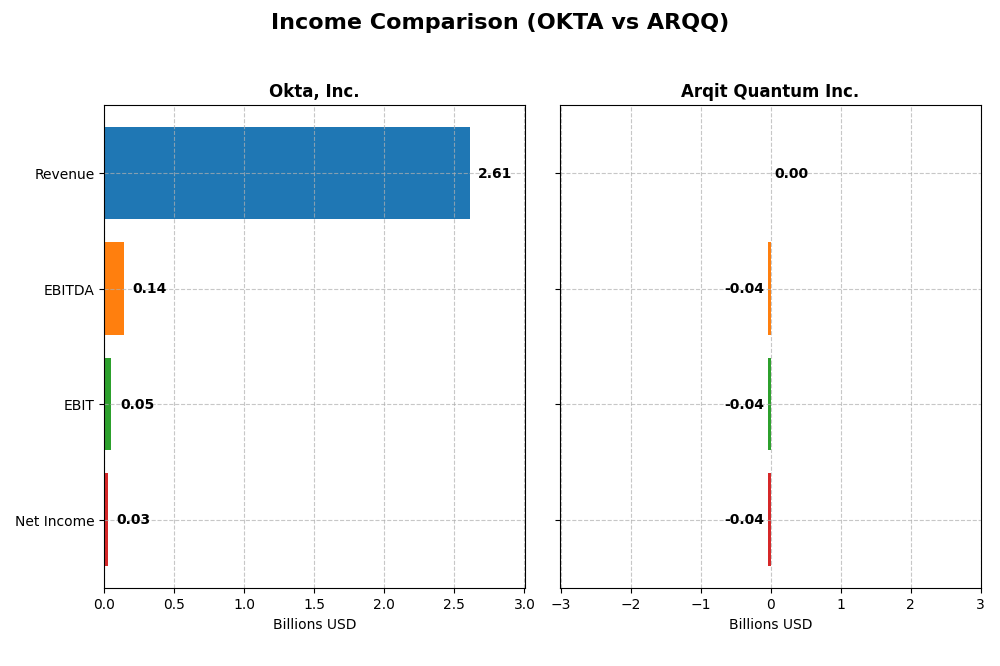
This table compares key income statement metrics for Okta, Inc. and Arqit Quantum Inc. for their most recent fiscal year, providing a snapshot of their financial performance.
| Metric | Okta, Inc. (OKTA) | Arqit Quantum Inc. (ARQQ) |
|---|---|---|
| Market Cap | 15.2B | 416M |
| Revenue | 2.61B | 530K |
| EBITDA | 139M | -36.8M |
| EBIT | 51M | -37.6M |
| Net Income | 28M | -35.3M |
| EPS | 0.17 | -2.56 |
| Fiscal Year | 2025 | 2025 |
Income Statement Interpretations
Okta, Inc.
Okta’s revenue increased steadily from $835M in 2021 to $2.61B in 2025, with net income improving from a loss of $266M to a positive $28M. Gross margin remained strong at 76.3%, while net margin turned positive at 1.07%. In 2025, revenue growth of 15.3% and improved earnings reflect a significant operational turnaround.
Arqit Quantum Inc.
Arqit’s revenue grew substantially from $48K in 2021 to $530K in 2025, with net losses narrowing from $272M to $35M. However, gross margins are negative at -43.4%, and EBIT margins remain deeply unfavorable at -7,088%. Despite strong revenue growth, profitability challenges persist, with net margin still negative at -6,668%.
Which one has the stronger fundamentals?
Okta demonstrates stronger fundamentals with consistent revenue growth, positive margins, and progress to profitability. Arqit shows impressive top-line expansion but suffers from persistent negative margins and large losses. Okta’s stable margins and improving net income contrast with Arqit’s ongoing profitability issues, indicating more robust financial health for Okta.
Financial Ratios Comparison
The table below presents a side-by-side comparison of key financial ratios for Okta, Inc. and Arqit Quantum Inc. based on their most recent fiscal year data, providing a snapshot of their financial health and performance metrics.
| Ratios | Okta, Inc. (2025) | Arqit Quantum Inc. (2025) |
|---|---|---|
| ROE | 0.44% | -129.77% |
| ROIC | -0.61% | -127.45% |
| P/E | 570.6 | -15.12 |
| P/B | 2.49 | 19.62 |
| Current Ratio | 1.35 | 2.69 |
| Quick Ratio | 1.35 | 2.69 |
| D/E | 0.15 | 0.03 |
| Debt-to-Assets | 10.1% | 1.68% |
| Interest Coverage | -14.8 | -802.9 |
| Asset Turnover | 0.28 | 0.01 |
| Fixed Asset Turnover | 22.31 | 0.74 |
| Payout ratio | 0 | 0 |
| Dividend yield | 0 | 0 |
Interpretation of the Ratios
Okta, Inc.
Okta shows a mixed ratio profile with 42.86% favorable and 42.86% unfavorable metrics. Key concerns include low net margin at 1.07%, weak return on equity (0.44%), and negative return on invested capital (-0.61%). Liquidity and leverage ratios appear stable, with a current ratio of 1.35 and debt-to-equity at 0.15. Okta does not pay dividends, likely focusing on growth and reinvestment.
Arqit Quantum Inc.
Arqit’s financial ratios reveal significant weaknesses, with 64.29% unfavorable metrics and no dividend payments. The company posts a deeply negative net margin (-6668.49%) and return on equity (-129.77%), alongside a high weighted average cost of capital at 15.16%. Liquidity ratios are strong, with a current ratio of 2.69, but profitability and asset efficiency remain concerns, suggesting a focus on development over shareholder returns.
Which one has the best ratios?
Comparing the two, Okta holds a more balanced and neutral ratio stance with several favorable liquidity and leverage indicators. Arqit’s ratios predominantly signal financial distress, especially in profitability and capital returns. Overall, Okta presents a relatively stronger ratio profile, while Arqit faces more pronounced financial challenges.
Strategic Positioning
This section compares the strategic positioning of Okta and Arqit Quantum, focusing on market position, key segments, and exposure to technological disruption:
Okta, Inc.
- Leading identity solutions provider with global enterprise reach, facing competitive pressure in cloud security.
- Key segment is subscription-based identity management services with steady revenue growth; technology services are minor.
- Positioned in cloud and adaptive authentication technologies; moderate exposure to rapid tech changes in cybersecurity.
Arqit Quantum Inc.
- Small UK-based cybersecurity firm leveraging satellite and terrestrial platforms, niche market player.
- Focused on QuantumCloud encryption software, targeting device security through quantum encryption technology.
- Positioned in emerging quantum encryption tech, exposed to high disruption risk with innovative satellite-based security.
Okta vs Arqit Positioning
Okta operates a diversified subscription model targeting various organizations worldwide, benefiting from scale but facing intense competition. Arqit focuses narrowly on quantum encryption, offering innovation potential but with limited market size and higher volatility risks.
Which has the best competitive advantage?
Both companies show slightly unfavorable MOATs, shedding value but with growing profitability. Okta’s larger scale and diversified services contrast with Arqit’s niche innovation, yet neither currently demonstrates a strong sustainable competitive advantage.
Stock Comparison
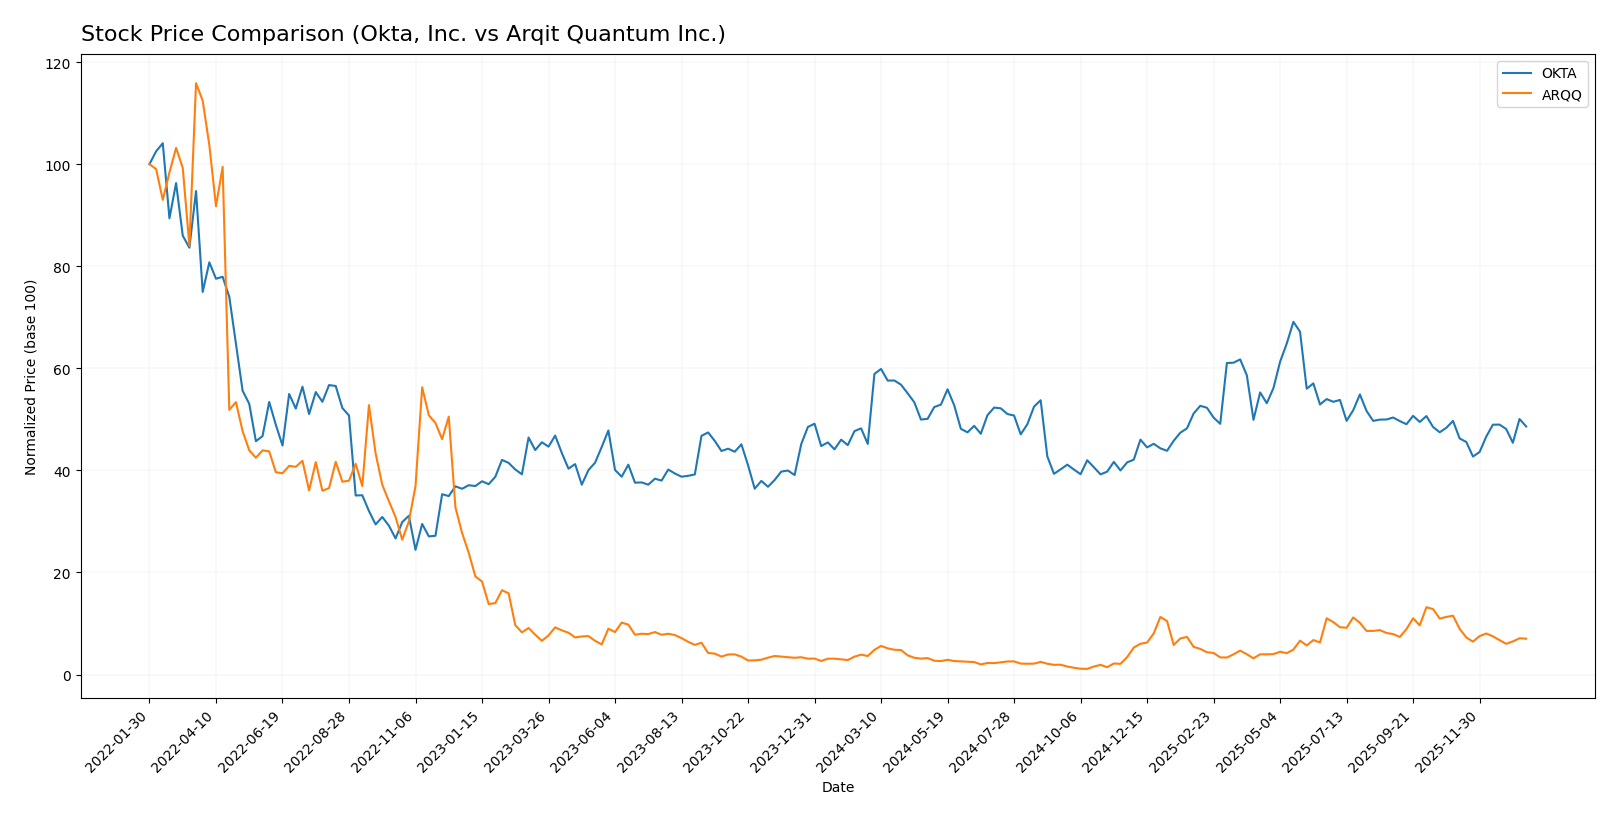
The past year highlighted divergent price dynamics between Okta, Inc. and Arqit Quantum Inc., with both stocks exhibiting significant overall growth but contrasting recent downturns and differing trading volumes.
Trend Analysis
Okta, Inc. showed a bullish trend over the past 12 months with a 7.58% price increase and accelerating momentum, despite a recent slight bearish correction of -2.16% since November 2025.
Arqit Quantum Inc. experienced a strong bullish trend with a 93.6% gain over 12 months, though this growth decelerated and reversed sharply in recent weeks, dropping -39.03% since November 2025.
Comparing the two, Arqit Quantum delivered the highest market performance overall, but recent trading shows Okta maintaining more stable buyer dominance and a less pronounced recent decline.
Target Prices
Analysts provide a clear consensus on target prices for Okta, Inc. and Arqit Quantum Inc.
| Company | Target High | Target Low | Consensus |
|---|---|---|---|
| Okta, Inc. | 140 | 60 | 110.67 |
| Arqit Quantum Inc. | 60 | 60 | 60 |
Okta’s target consensus at 110.67 USD suggests upside potential from its current price of 89.55 USD, indicating moderate optimism. Arqit’s fixed target at 60 USD is considerably higher than its current price of 26.6 USD, reflecting high expected growth but with greater risk.
Analyst Opinions Comparison
This section compares analysts’ ratings and grades for Okta, Inc. and Arqit Quantum Inc.:
Rating Comparison
Okta Rating
- Rating: B, indicating a very favorable overall rating.
- Discounted Cash Flow Score: 4, favorable valuation based on future cash flow.
- ROE Score: 2, moderate efficiency in generating profit from equity.
- ROA Score: 3, moderate effectiveness in asset utilization.
- Debt To Equity Score: 4, favorable financial stability with low leverage.
- Overall Score: 3, moderate overall financial standing.
Arqit Rating
- Rating: C, indicating a very favorable overall rating.
- Discounted Cash Flow Score: 2, moderate valuation based on future cash flow.
- ROE Score: 1, very unfavorable efficiency in generating profit from equity.
- ROA Score: 1, very unfavorable effectiveness in asset utilization.
- Debt To Equity Score: 4, favorable financial stability with low leverage.
- Overall Score: 2, moderate overall financial standing.
Which one is the best rated?
Okta holds a better rating with a “B” and higher overall and discounted cash flow scores compared to Arqit’s “C” rating and lower scores. Okta also shows stronger returns on equity and assets, making it the better rated stock based strictly on these data.
Scores Comparison
Here is a comparison of the Altman Z-Score and Piotroski Score for Okta, Inc. and Arqit Quantum Inc.:
Okta Scores
- Altman Z-Score: 4.15, indicating a safe zone, low bankruptcy risk.
- Piotroski Score: 8, classified as very strong financial health.
Arqit Scores
- Altman Z-Score: -0.22, indicating distress zone, high bankruptcy risk.
- Piotroski Score: 2, classified as very weak financial health.
Which company has the best scores?
Based on the provided data, Okta has significantly better scores, with a safe zone Altman Z-Score and a very strong Piotroski Score. Arqit is in the distress zone with a very weak Piotroski Score, indicating weaker financial stability.
Grades Comparison
Here is a comparison of the latest reliable grades assigned to Okta, Inc. and Arqit Quantum Inc.:
Okta, Inc. Grades
This table shows recent grades from established grading companies for Okta, Inc.:
| Grading Company | Action | New Grade | Date |
|---|---|---|---|
| Stephens & Co. | Upgrade | Overweight | 2026-01-14 |
| Piper Sandler | Maintain | Neutral | 2026-01-05 |
| RBC Capital | Maintain | Outperform | 2026-01-05 |
| Jefferies | Upgrade | Buy | 2025-12-16 |
| Needham | Maintain | Buy | 2025-12-12 |
| BTIG | Maintain | Buy | 2025-12-04 |
| Susquehanna | Maintain | Neutral | 2025-12-03 |
| Cantor Fitzgerald | Maintain | Overweight | 2025-12-03 |
| Canaccord Genuity | Maintain | Buy | 2025-12-03 |
| Scotiabank | Maintain | Sector Perform | 2025-12-03 |
Okta’s grades generally trend positive, with multiple upgrades and several firms maintaining buy or outperform ratings.
Arqit Quantum Inc. Grades
This table displays grades from HC Wainwright & Co. for Arqit Quantum Inc.:
| Grading Company | Action | New Grade | Date |
|---|---|---|---|
| HC Wainwright & Co. | Maintain | Buy | 2025-10-13 |
| HC Wainwright & Co. | Maintain | Buy | 2025-09-18 |
| HC Wainwright & Co. | Maintain | Buy | 2024-12-31 |
| HC Wainwright & Co. | Maintain | Buy | 2024-12-06 |
| HC Wainwright & Co. | Maintain | Buy | 2024-07-11 |
| HC Wainwright & Co. | Maintain | Buy | 2024-05-29 |
| HC Wainwright & Co. | Maintain | Buy | 2024-05-15 |
| HC Wainwright & Co. | Maintain | Buy | 2023-11-22 |
| HC Wainwright & Co. | Maintain | Buy | 2023-09-27 |
| HC Wainwright & Co. | Maintain | Buy | 2023-09-26 |
Arqit Quantum Inc. shows consistent buy ratings, all maintained by a single grading company over multiple dates without upgrades or downgrades.
Which company has the best grades?
Okta, Inc. has received a broader range of grades from multiple reputable firms, including upgrades and higher ratings such as Outperform and Overweight. Arqit Quantum Inc. benefits from steady buy ratings but only from one grading firm. Investors may interpret Okta’s diversified and evolving grades as a sign of more extensive analyst coverage and nuanced sentiment.
Strengths and Weaknesses
Below is a comparison of key strengths and weaknesses for Okta, Inc. (OKTA) and Arqit Quantum Inc. (ARQQ) based on their recent financial and operational data.
| Criterion | Okta, Inc. (OKTA) | Arqit Quantum Inc. (ARQQ) |
|---|---|---|
| Diversification | Primarily subscription services with some technology services; limited diversification | Narrow focus on quantum encryption technology; minimal product diversification |
| Profitability | Low net margin (1.07%), negative ROIC (-0.61%), slightly unfavorable profitability metrics | Strongly negative net margin (-6668%), ROIC (-127%), unfavorable profitability |
| Innovation | Steady revenue growth in subscription services signals ongoing innovation | Early-stage technology with high R&D expenses, yet to achieve profitability |
| Global presence | Established global user base with recurring revenue streams | Limited global footprint, still in development and market penetration phase |
| Market Share | Significant share in identity management and security software | Small market share in the nascent quantum encryption sector |
Key takeaways: Okta shows growing revenue and improving profitability trends but still operates with low margins and negative returns on capital. Arqit is in a highly innovative but early and unprofitable stage, with significant risks due to its financial losses and limited market reach. Investors should weigh Okta’s established position and improving metrics against Arqit’s high-risk, high-potential profile.
Risk Analysis
Below is a comparative risk assessment table for Okta, Inc. and Arqit Quantum Inc. based on the most recent financial year 2025 data:
| Metric | Okta, Inc. (OKTA) | Arqit Quantum Inc. (ARQQ) |
|---|---|---|
| Market Risk | Moderate (Beta 0.76) | High (Beta 2.41) |
| Debt level | Low (Debt/Equity 0.15) | Very Low (Debt/Equity 0.03) |
| Regulatory Risk | Moderate (US-based, SaaS) | Moderate (UK-based, cybersecurity) |
| Operational Risk | Moderate (Cloud infrastructure reliance) | High (Early-stage, limited employees) |
| Environmental Risk | Low (Software industry) | Low (Software industry) |
| Geopolitical Risk | Moderate (US and international) | Elevated (UK and global quantum tech) |
The most likely and impactful risks differ notably: Okta faces moderate market and operational risks linked to competitive cloud identity services and moderate regulatory scrutiny in the US. Arqit shows higher market volatility and operational risks given its early-stage status and niche quantum encryption space, alongside geopolitical exposure due to its UK base and emerging tech focus. Okta’s strong financial stability contrasts with Arqit’s distress-level Altman Z-score and weak profitability metrics, signaling higher investment risk for Arqit.
Which Stock to Choose?
Okta, Inc. shows a favorable income evolution with revenue growth of 15.33% last year and a strong overall increase of 213% since 2021. Its financial ratios are mixed but lean neutral globally, with strengths in debt management and liquidity. Profitability is low but improving, while debt levels remain manageable. The company holds a very favorable “B” rating.
Arqit Quantum Inc. exhibits volatile income evolution, with high revenue growth but significant negative margins and profitability ratios. Financial ratios are mostly unfavorable, reflecting challenges in asset utilization and earnings generation. Debt is low, but the company’s rating stands at a moderate “C” with a generally unfavorable financial profile.
Investors with a risk-tolerant profile seeking rapid growth may find Arqit’s dynamic revenue and improving profitability metrics appealing despite risks. Conversely, those prioritizing financial stability and balanced fundamentals might view Okta’s improving income statement and stronger rating as more favorable. Both companies show value destruction but with rising profitability, suggesting cautious interpretation.
Disclaimer: Investment carries a risk of loss of initial capital. The past performance is not a reliable indicator of future results. Be sure to understand risks before making an investment decision.
Go Further
I encourage you to read the complete analyses of Okta, Inc. and Arqit Quantum Inc. to enhance your investment decisions: