In today’s fast-evolving tech landscape, Oddity Tech Ltd. and Arqit Quantum Inc. stand out as innovative players within the software infrastructure sector. Oddity Tech focuses on transforming beauty and wellness through digital-first consumer brands, while Arqit Quantum pioneers quantum encryption for cybersecurity. Despite differing end markets, both harness cutting-edge technology to disrupt traditional industries. This article will help you decide which company presents the most compelling investment opportunity in 2026.

Table of contents
Companies Overview
I will begin the comparison between Oddity Tech Ltd. and Arqit Quantum Inc. by providing an overview of these two companies and their main differences.
Oddity Tech Ltd. Overview
Oddity Tech Ltd. operates globally as a consumer-tech company focused on beauty and wellness products. Leveraging its PowerMatch technology, it builds and scales digital-first brands aimed at disrupting offline beauty and wellness markets. The company offers a range of products under IL MAKIAGE and SpoiledChild brands, positioning itself in the software infrastructure industry with a market cap of approximately 2B USD.
Arqit Quantum Inc. Overview
Arqit Quantum Inc. is a UK-based cybersecurity firm providing services via satellite and terrestrial platforms. Its QuantumCloud software enables secure encryption key sharing between devices, emphasizing advanced quantum-safe security solutions. Operating within the technology sector, Arqit has a market cap near 416M USD and a smaller workforce, focusing on innovative cybersecurity infrastructure.
Key similarities and differences
Both Oddity Tech and Arqit operate in the software infrastructure industry, emphasizing technological innovation. Oddity Tech targets consumer beauty and wellness markets with digital-first branding, while Arqit focuses on cybersecurity through quantum encryption technology. Oddity Tech’s market cap and employee count are significantly larger, reflecting its broader global consumer reach compared to Arqit’s specialized security services.
Income Statement Comparison
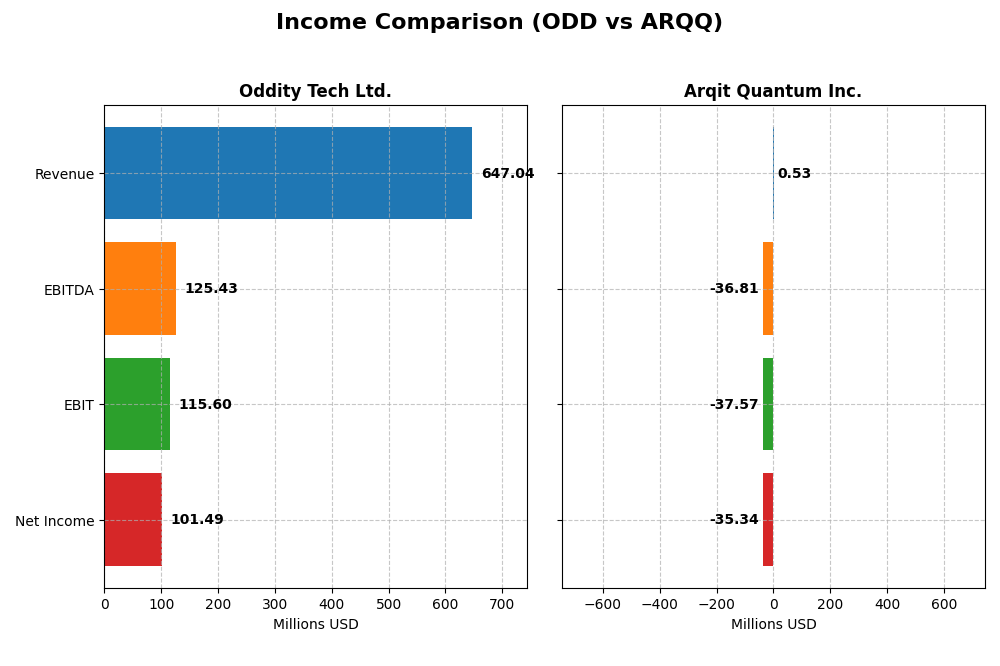
The table below presents a side-by-side comparison of key income statement metrics for Oddity Tech Ltd. and Arqit Quantum Inc. for their most recent fiscal years.
| Metric | Oddity Tech Ltd. (ODD) | Arqit Quantum Inc. (ARQQ) |
|---|---|---|
| Market Cap | 2B | 416M |
| Revenue | 647M | 530K |
| EBITDA | 125M | -37M |
| EBIT | 116M | -37.6M |
| Net Income | 101M | -35.3M |
| EPS | 1.78 | -2.56 |
| Fiscal Year | 2024 | 2025 |
Income Statement Interpretations
Oddity Tech Ltd.
Oddity Tech Ltd. demonstrated consistent revenue and net income growth from 2020 to 2024, with revenue rising from 110.6M to 647M, and net income increasing sharply to 101.5M in 2024. Margins improved steadily, with a gross margin of 72.38% and a net margin of 15.69% in the most recent year. The 2024 performance showed strong growth momentum and enhanced profitability metrics.
Arqit Quantum Inc.
Arqit Quantum Inc. experienced fluctuating revenues and net income from 2021 through 2025, with revenue peaking modestly at 530K in 2025 but net income remaining negative at -35.3M. Margins were generally unfavorable, with a negative gross margin of -43.4% and net margin of -6668.49% in 2025. Although revenue growth was favorable, operating losses deepened, impacting overall profitability.
Which one has the stronger fundamentals?
Oddity Tech Ltd. exhibits stronger fundamentals, marked by substantial and consistent revenue and net income growth, alongside positive and improving margins. In contrast, Arqit Quantum Inc., despite some revenue growth, struggles with large negative margins and operating losses. Oddity’s financial stability and profitability metrics are more favorable compared to Arqit’s volatile and loss-heavy results.
Financial Ratios Comparison
The table below compares key financial ratios for Oddity Tech Ltd. (ODD) and Arqit Quantum Inc. (ARQQ) for their most recent fiscal years, providing an overview of profitability, liquidity, leverage, efficiency, and shareholder returns.
| Ratios | Oddity Tech Ltd. (ODD) 2024 | Arqit Quantum Inc. (ARQQ) 2025 |
|---|---|---|
| ROE | 36.0% | -129.8% |
| ROIC | 28.6% | -127.5% |
| P/E | 23.7 | -15.1 |
| P/B | 8.54 | 19.6 |
| Current Ratio | 1.79 | 2.69 |
| Quick Ratio | 0.99 | 2.69 |
| D/E (Debt-to-Equity) | 0.08 | 0.03 |
| Debt-to-Assets | 5.17% | 1.68% |
| Interest Coverage | 1521.1 | -802.9 |
| Asset Turnover | 1.47 | 0.012 |
| Fixed Asset Turnover | 19.4 | 0.74 |
| Payout Ratio | 0 | 0 |
| Dividend Yield | 0 | 0 |
Interpretation of the Ratios
Oddity Tech Ltd.
Oddity Tech Ltd. shows mostly strong financial ratios, including a favorable net margin of 15.69% and a high return on equity at 35.95%, indicating efficient profitability. The company maintains a solid current ratio of 1.79 and low debt levels. However, the weighted average cost of capital (WACC) and price-to-book (PB) ratios are less favorable. Oddity Tech does not pay dividends, likely focusing on growth and reinvestment.
Arqit Quantum Inc.
Arqit Quantum Inc. presents several weak financial ratios, such as a highly negative net margin (-6668.49%) and return on equity (-129.77%), highlighting significant losses and operational challenges. The company benefits from strong liquidity ratios but suffers from poor asset turnover and negative interest coverage. Like Oddity Tech, it does not pay dividends, probably due to ongoing investment in growth and technology development.
Which one has the best ratios?
Oddity Tech Ltd. clearly outperforms Arqit Quantum Inc. in most key financial metrics, with a majority of favorable ratios reflecting profitability and operational efficiency. Arqit’s ratios indicate high financial stress and losses, overshadowing its liquidity strengths. Thus, Oddity Tech has the more positive overall financial profile based on the available ratio evaluations.
Strategic Positioning
This section compares the strategic positioning of Oddity Tech Ltd. and Arqit Quantum Inc. in terms of Market position, Key segments, and Exposure to technological disruption:
Oddity Tech Ltd.
- Operates globally in consumer-tech, focusing on digital-first beauty and wellness brands, facing competitive pressure in offline markets.
- Key driver is beauty and wellness products using PowerMatch technology under multiple brands, disrupting traditional offline industries.
- Disruption focus on digitalizing offline-dominated beauty and wellness sectors with innovative technology integration.
Arqit Quantum Inc.
- Provides cybersecurity services via satellite and terrestrial platforms, competing in specialized quantum encryption technology.
- Key segment is cybersecurity through QuantumCloud software, enabling encryption key creation across devices.
- Exposure to technological disruption through advanced quantum encryption, impacting cybersecurity infrastructure.
Oddity Tech Ltd. vs Arqit Quantum Inc. Positioning
Oddity Tech Ltd. pursues a diversified approach with multiple beauty and wellness brands targeting offline market disruption. Arqit Quantum Inc. has a more concentrated focus on quantum cybersecurity services. Oddity’s scale and broader market reach contrast with Arqit’s niche technological specialization.
Which has the best competitive advantage?
Oddity Tech Ltd. shows a very favorable MOAT with growing ROIC above WACC, indicating a durable competitive advantage and value creation. Arqit Quantum Inc. has a slightly unfavorable MOAT, with value destruction despite improving profitability.
Stock Comparison
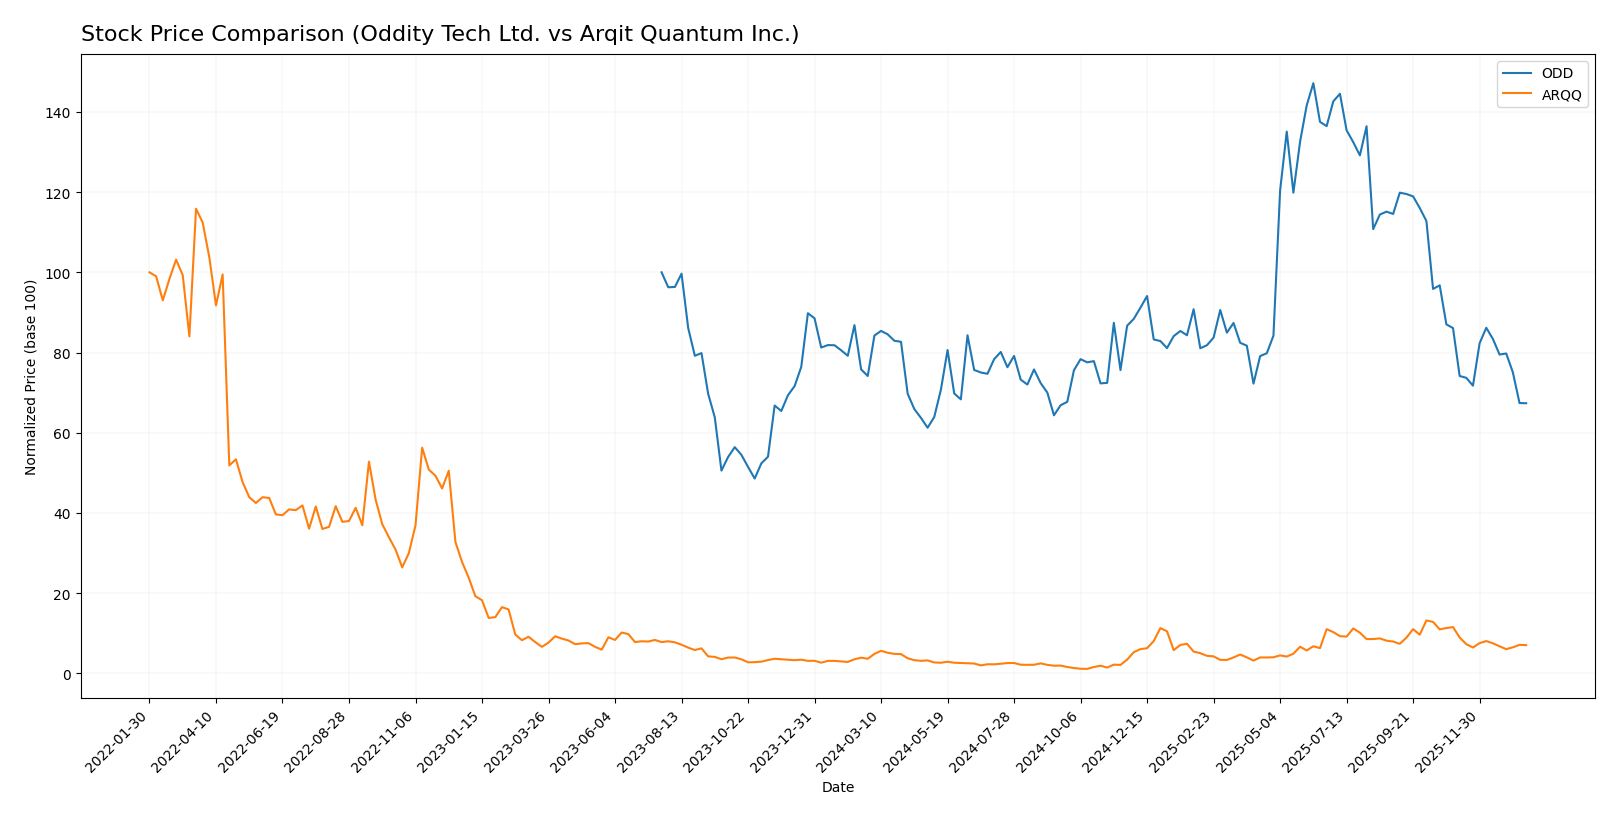
The stock price movements of Oddity Tech Ltd. (ODD) and Arqit Quantum Inc. (ARQQ) over the past 12 months reveal contrasting trends, with significant price swings and shifts in trading volumes reflecting differing market sentiments.
Trend Analysis
Oddity Tech Ltd. experienced a bearish trend with a -9.16% price change over the past year, characterized by deceleration and notable volatility, with prices ranging from 32.19 to 77.35.
Arqit Quantum Inc. showed a bullish trend with a 93.6% gain over the same period, despite deceleration and a recent sharp decline of -39.03%, with prices hitting a low of 4.19 and a high near 49.92.
Comparing trends, Arqit Quantum delivered the highest market performance, significantly outperforming Oddity Tech despite recent negative momentum.
Target Prices
The current analyst consensus reveals promising upside potential for both Oddity Tech Ltd. and Arqit Quantum Inc.
| Company | Target High | Target Low | Consensus |
|---|---|---|---|
| Oddity Tech Ltd. | 80 | 40 | 66.33 |
| Arqit Quantum Inc. | 60 | 60 | 60 |
Analysts expect Oddity Tech’s stock to more than double from its current price of 35.4 USD, while Arqit Quantum shows a solid target well above its current 26.6 USD price, indicating considerable growth expectations.
Analyst Opinions Comparison
This section compares analysts’ ratings and grades for Oddity Tech Ltd. and Arqit Quantum Inc.:
Rating Comparison
ODD Rating
- Rating: B+ indicating a very favorable outlook.
- Discounted Cash Flow Score: 4, rated favorable for valuation.
- ROE Score: 5, very favorable efficiency in generating profit.
- ROA Score: 4, favorable asset utilization.
- Debt To Equity Score: 3, moderate financial risk.
- Overall Score: 3, moderate overall financial standing.
ARQQ Rating
- Rating: C indicating a very unfavorable outlook.
- Discounted Cash Flow Score: 2, rated moderate for valuation.
- ROE Score: 1, very unfavorable profit generation efficiency.
- ROA Score: 1, very unfavorable asset utilization.
- Debt To Equity Score: 4, favorable financial risk profile.
- Overall Score: 2, moderate overall financial standing.
Which one is the best rated?
Based strictly on the provided data, Oddity Tech Ltd. is better rated with a B+ rating and stronger scores in discounted cash flow, ROE, and ROA, despite moderate debt to equity risk. Arqit Quantum Inc. shows weaker profitability scores and a lower overall rating.
Scores Comparison
The comparison of Oddity Tech Ltd. and Arqit Quantum Inc. scores is as follows:
Oddity Tech Ltd. Scores
- Altman Z-Score: 3.78, indicating a safe zone with low bankruptcy risk.
- Piotroski Score: 6, categorized as average financial strength.
Arqit Quantum Inc. Scores
- Altman Z-Score: -0.22, indicating distress zone and high bankruptcy risk.
- Piotroski Score: 2, categorized as very weak financial strength.
Which company has the best scores?
Oddity Tech Ltd. outperforms Arqit Quantum Inc. in both Altman Z-Score and Piotroski Score, showing stronger financial stability and health. Arqit Quantum’s scores reflect financial distress and weakness based on the provided data.
Grades Comparison
Here is a detailed comparison of the latest reliable grades assigned to Oddity Tech Ltd. and Arqit Quantum Inc.:
Oddity Tech Ltd. Grades
The table below summarizes recent grades from recognized financial institutions for Oddity Tech Ltd.:
| Grading Company | Action | New Grade | Date |
|---|---|---|---|
| Keybanc | Maintain | Overweight | 2026-01-08 |
| JP Morgan | Maintain | Overweight | 2025-12-12 |
| JP Morgan | Maintain | Overweight | 2025-11-21 |
| Barclays | Maintain | Equal Weight | 2025-11-21 |
| Morgan Stanley | Maintain | Equal Weight | 2025-11-21 |
| Needham | Maintain | Buy | 2025-11-20 |
| Keybanc | Maintain | Overweight | 2025-10-08 |
| JMP Securities | Maintain | Market Outperform | 2025-09-23 |
| Morgan Stanley | Maintain | Equal Weight | 2025-08-06 |
| JMP Securities | Maintain | Market Outperform | 2025-08-05 |
Overall, Oddity Tech Ltd. has consistently received ratings in the range of “Buy” to “Overweight,” with some “Equal Weight” evaluations, indicating a generally positive outlook among analysts.
Arqit Quantum Inc. Grades
The following table shows the latest grades from a reputable grading company for Arqit Quantum Inc.:
| Grading Company | Action | New Grade | Date |
|---|---|---|---|
| HC Wainwright & Co. | Maintain | Buy | 2025-10-13 |
| HC Wainwright & Co. | Maintain | Buy | 2025-09-18 |
| HC Wainwright & Co. | Maintain | Buy | 2024-12-31 |
| HC Wainwright & Co. | Maintain | Buy | 2024-12-06 |
| HC Wainwright & Co. | Maintain | Buy | 2024-07-11 |
| HC Wainwright & Co. | Maintain | Buy | 2024-05-29 |
| HC Wainwright & Co. | Maintain | Buy | 2024-05-15 |
| HC Wainwright & Co. | Maintain | Buy | 2023-11-22 |
| HC Wainwright & Co. | Maintain | Buy | 2023-09-27 |
| HC Wainwright & Co. | Maintain | Buy | 2023-09-26 |
Arqit Quantum Inc. has consistently been rated “Buy” by HC Wainwright & Co., showing a stable and positive analyst sentiment over multiple years.
Which company has the best grades?
Both companies hold a consensus “Buy” rating; however, Oddity Tech Ltd. exhibits a broader range of analyst grades including “Overweight” and “Market Outperform,” suggesting a slightly stronger and more diverse endorsement. This nuanced grading may influence investors seeking varied analyst perspectives compared to the uniform “Buy” grades for Arqit Quantum Inc.
Strengths and Weaknesses
Below is a comparative overview of key strengths and weaknesses for Oddity Tech Ltd. (ODD) and Arqit Quantum Inc. (ARQQ) based on the most recent financial and operational data.
| Criterion | Oddity Tech Ltd. (ODD) | Arqit Quantum Inc. (ARQQ) |
|---|---|---|
| Diversification | Moderate, focused tech segments | Limited, niche in quantum tech |
| Profitability | Strong: ROIC 28.56%, Net Margin 15.69% | Weak: ROIC -127.45%, Net Margin -6668.49% |
| Innovation | High, demonstrated by durable competitive advantage | Moderate, growing ROIC but overall negative returns |
| Global presence | Established international footprint | Emerging, limited scale |
| Market Share | Significant in its sector | Small, early-stage market share |
Key takeaways: Oddity Tech Ltd. shows robust profitability and a durable competitive advantage, making it a more stable investment choice. Arqit Quantum is still developing its market position with improving but negative profitability, indicating higher risk but potential for growth.
Risk Analysis
Below is a comparison of key risks for Oddity Tech Ltd. (ODD) and Arqit Quantum Inc. (ARQQ) as of the most recent fiscal years.
| Metric | Oddity Tech Ltd. (ODD) | Arqit Quantum Inc. (ARQQ) |
|---|---|---|
| Market Risk | High beta 3.18 indicates elevated volatility | High beta 2.41, significant price fluctuations |
| Debt level | Low debt-to-equity 0.08, low financial risk | Very low debt-to-equity 0.03, low financial risk |
| Regulatory Risk | Moderate, operates globally in consumer tech | Elevated, operates in cybersecurity with complex regulations |
| Operational Risk | Moderate, established with 489 employees | High, small size (82 employees) and early-stage tech |
| Environmental Risk | Low, primarily software and consumer products | Low, software and satellite cybersecurity focus |
| Geopolitical Risk | Medium, Israeli base with global markets | Medium to high, UK base with global cybersecurity exposure |
The most impactful and likely risks differ significantly: Oddity Tech faces heightened market volatility due to its high beta and premium valuation multiples, while maintaining strong financial stability. Arqit Quantum presents substantial operational and financial distress risks, reflected in negative profitability, weak Altman Z-Score (distress zone), and very weak Piotroski score, signaling high bankruptcy risk despite low debt. Regulatory and geopolitical challenges are more pronounced for Arqit given its cybersecurity niche and UK base amid global tensions.
Which Stock to Choose?
Oddity Tech Ltd. (ODD) shows a favorable income evolution with strong revenue and net income growth, robust profitability metrics, low debt levels, and a very favorable rating B+. Its financial ratios mostly indicate strength, supported by a very favorable economic moat and safe Altman Z-Score.
Arqit Quantum Inc. (ARQQ) has a mixed income profile marked by high revenue growth but significant net losses and unfavorable profitability ratios. Despite low debt and a bullish stock trend, its overall rating is C with several unfavorable financial ratios and a slightly unfavorable moat, coupled with poor Altman and Piotroski scores.
Investors focused on stable profitability and value creation might find Oddity Tech more aligned with their profile, while those tolerant of high risk and pursuing growth opportunities could interpret Arqit Quantum’s metrics as indicative of potential upside despite current financial challenges.
Disclaimer: Investment carries a risk of loss of initial capital. The past performance is not a reliable indicator of future results. Be sure to understand risks before making an investment decision.
Go Further
I encourage you to read the complete analyses of Oddity Tech Ltd. and Arqit Quantum Inc. to enhance your investment decisions: