Investors seeking exposure to cutting-edge software infrastructure may find Nutanix, Inc. and Arqit Quantum Inc. intriguing candidates. Nutanix delivers comprehensive enterprise cloud solutions with a global footprint, while Arqit specializes in next-generation quantum cybersecurity services based in the UK. Both operate within the technology sector but target different niches with innovative approaches. This article will help you determine which company presents the most compelling investment opportunity in 2026.
Table of contents
Companies Overview
I will begin the comparison between Nutanix and Arqit Quantum by providing an overview of these two companies and their main differences.
Nutanix Overview
Nutanix, Inc. operates as an enterprise cloud platform provider, serving a wide range of industries globally including automotive, healthcare, and telecommunications. The company focuses on software infrastructure solutions such as virtualization, cloud governance, and hybrid cloud orchestration. Headquartered in San Jose, California, Nutanix supports enterprises with products like Acropolis Hypervisor and Nutanix Clusters, aiming to simplify cloud-native environment management.
Arqit Quantum Overview
Arqit Quantum Inc., based in London, specializes in cybersecurity services utilizing satellite and terrestrial platforms. Its flagship product, QuantumCloud, offers encryption key generation through a lightweight software agent compatible with multiple devices. The company operates within the Software – Infrastructure sector and focuses on delivering advanced security solutions primarily in the United Kingdom, reflecting a more niche and security-driven business model.
Key similarities and differences
Both Nutanix and Arqit Quantum operate in the Software – Infrastructure industry, emphasizing technology-driven solutions. Nutanix has a broad enterprise cloud platform targeting multiple sectors worldwide, whereas Arqit Quantum concentrates on cybersecurity with a unique satellite-based approach. Nutanix has a significantly larger market capitalization and workforce, highlighting its established scale compared to the smaller, UK-focused Arqit Quantum.
Income Statement Comparison
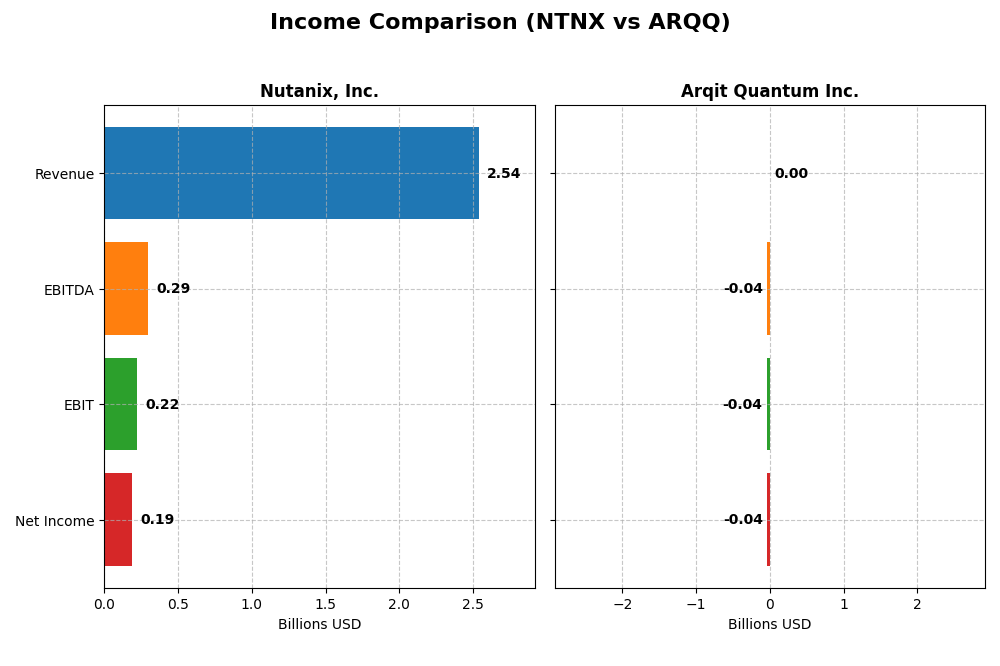
This table presents a side-by-side comparison of key income statement figures for Nutanix, Inc. and Arqit Quantum Inc. for their most recent fiscal year.
| Metric | Nutanix, Inc. (NTNX) | Arqit Quantum Inc. (ARQQ) |
|---|---|---|
| Market Cap | 12.4B | 416M |
| Revenue | 2.54B | 530K |
| EBITDA | 293M | -36.8M |
| EBIT | 220M | -37.6M |
| Net Income | 188M | -35.3M |
| EPS | 0.70 | -2.56 |
| Fiscal Year | 2025 | 2025 |
Income Statement Interpretations
Nutanix, Inc.
Nutanix showed strong revenue growth from 1.39B in 2021 to 2.54B in 2025, with net income improving from a -1.03B loss to a positive 188M. Gross margin remained robust at 86.81%, while net margin expanded to 7.42%. The 2025 fiscal year marked a clear turnaround with EBIT surging 223% and net margin growth over 110%, reflecting improving profitability and operational efficiency.
Arqit Quantum Inc.
Arqit’s revenue increased significantly from 48K in 2021 to 530K in 2025, with net income losses narrowing from -272M to -35M. Despite an unfavorable gross margin of -43.4% and a highly negative EBIT margin, revenue and EPS growth rates were favorable, above 70%. The company’s 2025 performance shows improvement in net margin and EPS, but earnings remain negative amid high operating expenses.
Which one has the stronger fundamentals?
Nutanix demonstrates stronger fundamentals with consistent revenue and net income growth, favorable margins, and positive earnings in 2025. Arqit shows notable revenue expansion but struggles with persistent losses and negative margins. Nutanix’s profitability and margin improvements contrast with Arqit’s ongoing operating deficits, indicating a more stable financial position for Nutanix based on income statement metrics.
Financial Ratios Comparison
The table below presents the most recent fiscal year-end financial ratios for Nutanix, Inc. (NTNX) and Arqit Quantum Inc. (ARQQ), offering a snapshot of key performance and financial health metrics as of 2025 and 2026.
| Ratios | Nutanix, Inc. (2025) | Arqit Quantum Inc. (2025) |
|---|---|---|
| ROE | -27.1% | -129.8% |
| ROIC | 8.1% | -127.5% |
| P/E | 106.7 | -15.1 |
| P/B | -29.0 | 19.6 |
| Current Ratio | 1.72 | 2.69 |
| Quick Ratio | 1.72 | 2.69 |
| D/E (Debt-to-Equity) | -2.14 | 0.03 |
| Debt-to-Assets | 45.2% | 1.68% |
| Interest Coverage | 8.75 | -803 |
| Asset Turnover | 0.77 | 0.012 |
| Fixed Asset Turnover | 9.15 | 0.74 |
| Payout ratio | 0 | 0 |
| Dividend yield | 0 | 0 |
Interpretation of the Ratios
Nutanix, Inc.
Nutanix shows a mixed profile with 50% of its ratios favorable and 21% unfavorable. Strong points include a solid current ratio of 1.72 and a favorable interest coverage of 11.15, indicating good liquidity and debt service capacity. However, the negative return on equity (-27.12%) and high P/E of 106.74 suggest concerns about profitability and valuation. The company does not pay dividends, reflecting a reinvestment strategy typical for growth-focused tech firms.
Arqit Quantum Inc.
Arqit’s ratios are largely unfavorable, with 64% flagged negative and only 36% favorable. While liquidity measures like current and quick ratios near 2.69 are strong, profitability is deeply negative—net margin at -6668% and ROE at -130%. The very high WACC of 15.16% and poor asset turnover ratios highlight operational and capital cost challenges. Arqit also pays no dividends, consistent with its early-stage status and focus on R&D and growth.
Which one has the best ratios?
Comparing both, Nutanix presents a more balanced and slightly favorable ratio set, showing better liquidity, coverage, and some operational efficiency. Conversely, Arqit struggles with profitability and asset utilization despite strong liquidity. Therefore, Nutanix has the more favorable financial ratios overall, though both companies carry risks inherent to their sectors and growth phases.
Strategic Positioning
This section compares the strategic positioning of Nutanix and Arqit Quantum, including their market position, key segments, and exposure to technological disruption:
Nutanix, Inc.
- Established enterprise cloud platform with broad global presence facing moderate competitive pressure.
- Key segments: Enterprise cloud infrastructure, subscription services, professional services driving revenue.
- Moderate exposure through cloud-native and virtualization technologies, adapting hybrid cloud orchestration.
Arqit Quantum Inc.
- UK-based cybersecurity firm with niche focus and higher competitive pressure.
- Key segment: QuantumCloud cybersecurity software delivered via satellite and terrestrial platforms.
- Exposure centered on quantum encryption technology, representing emerging technological disruption.
Nutanix, Inc. vs Arqit Quantum Inc. Positioning
Nutanix pursues a diversified approach across multiple cloud and virtualization services targeting various industries globally, while Arqit concentrates on a specialized quantum cybersecurity niche primarily in the UK. Nutanix’s broad portfolio offers scale advantages; Arqit’s focus targets emerging tech disruption but faces scalability limitations.
Which has the best competitive advantage?
Nutanix demonstrates a very favorable moat with a growing ROIC above WACC, indicating durable competitive advantage and efficient capital use. Arqit shows slightly unfavorable moat status, shedding value despite improving profitability, signaling weaker competitive advantage.
Stock Comparison
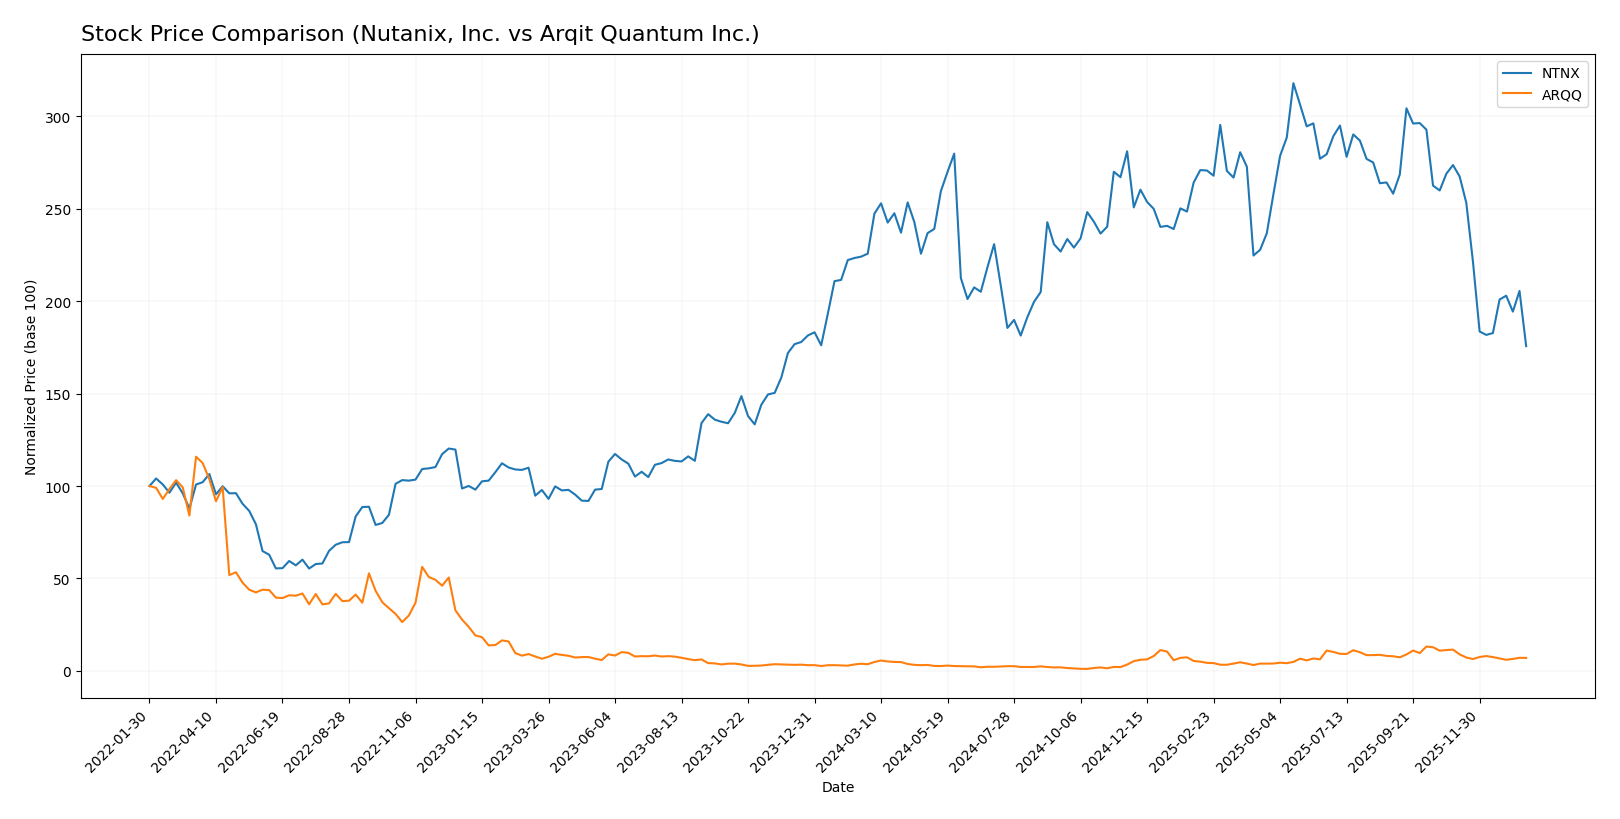
The stock price movements over the past 12 months reveal contrasting dynamics, with Nutanix, Inc. (NTNX) exhibiting a notable bearish trend and Arqit Quantum Inc. (ARQQ) demonstrating a strong bullish trend followed by recent declines.
Trend Analysis
Nutanix, Inc. (NTNX) experienced a bearish trend over the past year, with a price decline of 22.16%, showing deceleration in downward momentum and a high volatility level (std deviation 8.67). The stock peaked at 82.77 and bottomed at 45.74.
Arqit Quantum Inc. (ARQQ) posted a bullish trend with a 93.6% price increase over 12 months, though the acceleration slowed down. Volatility was higher (std deviation 11.75), with a high of 49.92 and a low of 4.19.
Comparing both, ARQQ delivered the highest market performance with a strong upward trend despite recent declines, whereas NTNX showed a sustained bearish movement and deceleration.
Target Prices
Analysts present a varied but optimistic target price consensus for Nutanix, Inc. and Arqit Quantum Inc.
| Company | Target High | Target Low | Consensus |
|---|---|---|---|
| Nutanix, Inc. | 90 | 53 | 64.67 |
| Arqit Quantum Inc. | 60 | 60 | 60 |
The consensus target for Nutanix at 64.67 is significantly above its current price of 45.74 USD, suggesting expected upside. For Arqit Quantum, the consensus target of 60 USD also indicates strong upside potential compared to the current 26.6 USD market price.
Analyst Opinions Comparison
This section compares analysts’ ratings and grades for Nutanix, Inc. and Arqit Quantum Inc.:
Rating Comparison
Nutanix, Inc. Rating
- Rating: C+ indicating a very favorable outlook.
- Discounted Cash Flow Score: 4, considered favorable.
- ROE Score: 1, marked as very unfavorable.
- ROA Score: 4, evaluated as favorable.
- Debt To Equity Score: 1, assessed very unfavorable.
- Overall Score: 2, rated as moderate.
Arqit Quantum Inc. Rating
- Rating: C indicating a very favorable outlook.
- Discounted Cash Flow Score: 2, considered moderate.
- ROE Score: 1, marked as very unfavorable.
- ROA Score: 1, evaluated as very unfavorable.
- Debt To Equity Score: 4, assessed favorable.
- Overall Score: 2, rated as moderate.
Which one is the best rated?
Nutanix holds a slightly higher rating (C+) compared to Arqit’s C, supported by stronger discounted cash flow and return on assets scores. However, Arqit scores better on debt-to-equity, indicating lower financial risk. Both have the same overall moderate score.
Scores Comparison
Here is a comparison of the key financial scores for Nutanix, Inc. and Arqit Quantum Inc.:
NTNX Scores
- Altman Z-Score: 1.48, indicating financial distress zone risk.
- Piotroski Score: 6, reflecting average financial strength.
ARQQ Scores
- Altman Z-Score: -0.22, indicating financial distress zone risk.
- Piotroski Score: 2, indicating very weak financial strength.
Which company has the best scores?
Based strictly on the provided data, Nutanix shows a higher Altman Z-Score and a significantly stronger Piotroski Score than Arqit Quantum, indicating relatively better financial stability and strength.
Grades Comparison
Here is the comparison of recent grades and ratings for Nutanix, Inc. and Arqit Quantum Inc.:
Nutanix, Inc. Grades
This table summarizes recent analyst grades and actions for Nutanix, Inc.:
| Grading Company | Action | New Grade | Date |
|---|---|---|---|
| Barclays | Downgrade | Equal Weight | 2026-01-15 |
| Morgan Stanley | Downgrade | Equal Weight | 2026-01-12 |
| RBC Capital | Maintain | Outperform | 2026-01-05 |
| Goldman Sachs | Maintain | Buy | 2025-11-28 |
| JP Morgan | Maintain | Overweight | 2025-11-26 |
| Needham | Maintain | Buy | 2025-11-26 |
| Wells Fargo | Maintain | Equal Weight | 2025-11-26 |
| Morgan Stanley | Maintain | Overweight | 2025-11-26 |
| Keybanc | Maintain | Overweight | 2025-11-26 |
| Piper Sandler | Maintain | Overweight | 2025-11-26 |
Overall, Nutanix shows a mixed trend with recent downgrades from Overweight to Equal Weight by major banks but still maintains several Buy and Overweight ratings.
Arqit Quantum Inc. Grades
This table summarizes recent analyst grades and actions for Arqit Quantum Inc.:
| Grading Company | Action | New Grade | Date |
|---|---|---|---|
| HC Wainwright & Co. | Maintain | Buy | 2025-10-13 |
| HC Wainwright & Co. | Maintain | Buy | 2025-09-18 |
| HC Wainwright & Co. | Maintain | Buy | 2024-12-31 |
| HC Wainwright & Co. | Maintain | Buy | 2024-12-06 |
| HC Wainwright & Co. | Maintain | Buy | 2024-07-11 |
| HC Wainwright & Co. | Maintain | Buy | 2024-05-29 |
| HC Wainwright & Co. | Maintain | Buy | 2024-05-15 |
| HC Wainwright & Co. | Maintain | Buy | 2023-11-22 |
| HC Wainwright & Co. | Maintain | Buy | 2023-09-27 |
| HC Wainwright & Co. | Maintain | Buy | 2023-09-26 |
Arqit Quantum has a consistent Buy rating maintained over multiple years by HC Wainwright & Co., showing stable analyst confidence.
Which company has the best grades?
Nutanix has a broader analyst coverage with a mix of Buy and Overweight ratings but recent downgrades imply caution. Arqit Quantum’s grades are uniformly Buy but from a single firm, indicating consistent but less diversified analyst support. This difference may impact investor confidence and perceived risk.
Strengths and Weaknesses
The table below compares key strengths and weaknesses of Nutanix, Inc. (NTNX) and Arqit Quantum Inc. (ARQQ) based on their recent financial performance and strategic positioning.
| Criterion | Nutanix, Inc. (NTNX) | Arqit Quantum Inc. (ARQQ) |
|---|---|---|
| Diversification | Balanced revenue from subscription ($2.02B in 2024) and professional services | Limited product diversity; primarily focused on quantum security |
| Profitability | ROIC 8.11% with positive net margin (7.42%), but negative ROE (-27.12%) | Negative profitability metrics; large net loss margin (-6668%) and negative ROIC (-127%) |
| Innovation | Strong product and service innovation in cloud software | Developing cutting-edge quantum encryption technology, but still early stage |
| Global presence | Established global client base with stable subscription growth | Emerging global footprint, limited market penetration so far |
| Market Share | Significant presence in enterprise cloud software market | Small and niche market share in quantum security |
Key takeaways: Nutanix demonstrates a durable competitive advantage with growing profitability and stable diversification, making it a more reliable choice for investors. Arqit, while innovating in a potentially transformative sector, currently shows unfavorable profitability and higher risk, requiring cautious consideration.
Risk Analysis
Below is a table outlining key risk factors for Nutanix, Inc. (NTNX) and Arqit Quantum Inc. (ARQQ) based on their latest financial and operational data from 2025.
| Metric | Nutanix, Inc. (NTNX) | Arqit Quantum Inc. (ARQQ) |
|---|---|---|
| Market Risk | Moderate (Beta 0.49) | High (Beta 2.41) |
| Debt Level | Moderate (Debt/Assets 45%) | Low (Debt/Assets 1.7%) |
| Regulatory Risk | Moderate (US & global tech regulations) | High (UK & international cybersecurity regulations) |
| Operational Risk | Moderate (7,150 employees, cloud infra complexity) | High (Small team of 82, emerging tech) |
| Environmental Risk | Low (Technology sector, minimal direct env. impact) | Low (Technology sector, minimal direct env. impact) |
| Geopolitical Risk | Moderate (Global operations, US based) | High (UK based, geopolitical tensions impact) |
Nutanix faces moderate market and regulatory risks with a stable but leveraged financial profile, while Arqit’s high market volatility and regulatory exposure are concerning. Arqit’s financial distress signals and small operational scale elevate its operational and geopolitical risks substantially. Investors should prioritize risk management accordingly.
Which Stock to Choose?
Nutanix, Inc. (NTNX) shows a favorable income evolution with 18.11% revenue growth in 2025 and strong profitability metrics, including a 7.42% net margin. Its financial ratios are slightly favorable, supported by a solid current ratio of 1.72 and efficient asset turnover. Despite a negative return on equity of -27.12%, the company demonstrates low debt levels and a very favorable rating of C+.
Arqit Quantum Inc. (ARQQ) exhibits rapid revenue growth of 80.89% in 2025 but suffers from unfavorable profitability with a -6668.49% net margin and weak financial ratios. The company maintains low debt and a strong current ratio of 2.69, yet its overall financial health is challenged by negative returns on equity and assets. ARQQ holds a very favorable rating of C but with significant caution due to its metrics.
For investors prioritizing durable value creation and profitability, Nutanix’s very favorable moat and favorable income statement could appear more attractive. Conversely, those focused on high growth potential might see Arqit’s impressive revenue gains despite its financial weaknesses as a speculative opportunity. The choice may depend on an investor’s tolerance for risk and preference between stability and aggressive growth.
Disclaimer: Investment carries a risk of loss of initial capital. The past performance is not a reliable indicator of future results. Be sure to understand risks before making an investment decision.
Go Further
I encourage you to read the complete analyses of Nutanix, Inc. and Arqit Quantum Inc. to enhance your investment decisions: