In today’s rapidly evolving cybersecurity landscape, Fortinet, Inc. and Arqit Quantum Inc. stand out as innovative players with distinct approaches. Fortinet, a global leader in integrated security solutions, contrasts with Arqit, a pioneering UK-based company leveraging quantum technology for encryption. Both operate within the software infrastructure sector, targeting critical security needs. This article will help you decide which company offers the most compelling investment opportunity in 2026.

Table of contents
Companies Overview
I will begin the comparison between Fortinet and Arqit by providing an overview of these two companies and their main differences.
Fortinet Overview
Fortinet, Inc. is a US-based cybersecurity firm specializing in broad, integrated, and automated security solutions. The company offers a wide range of products including firewalls, endpoint protection, network management, and multi-factor authentication. Serving diverse industries such as telecommunications, government, and healthcare, Fortinet operates globally with a workforce of over 14,500 employees and is headquartered in Sunnyvale, California.
Arqit Overview
Arqit Quantum Inc. is a UK-based cybersecurity company providing services through satellite and terrestrial platforms. Its primary product, QuantumCloud, enables secure encryption key generation between devices via lightweight software. With a lean team of 82 employees, Arqit focuses on delivering advanced quantum encryption solutions from its base in London, serving clients primarily in the United Kingdom.
Key similarities and differences
Both Fortinet and Arqit operate within the Software – Infrastructure sector, focusing on cybersecurity solutions. Fortinet offers a comprehensive suite of hardware and software products catering to a broad global market, while Arqit concentrates on quantum encryption technology with a specialized product for secure communications. Additionally, Fortinet has a substantially larger market capitalization and workforce compared to Arqit’s more niche and emerging technology focus.
Income Statement Comparison
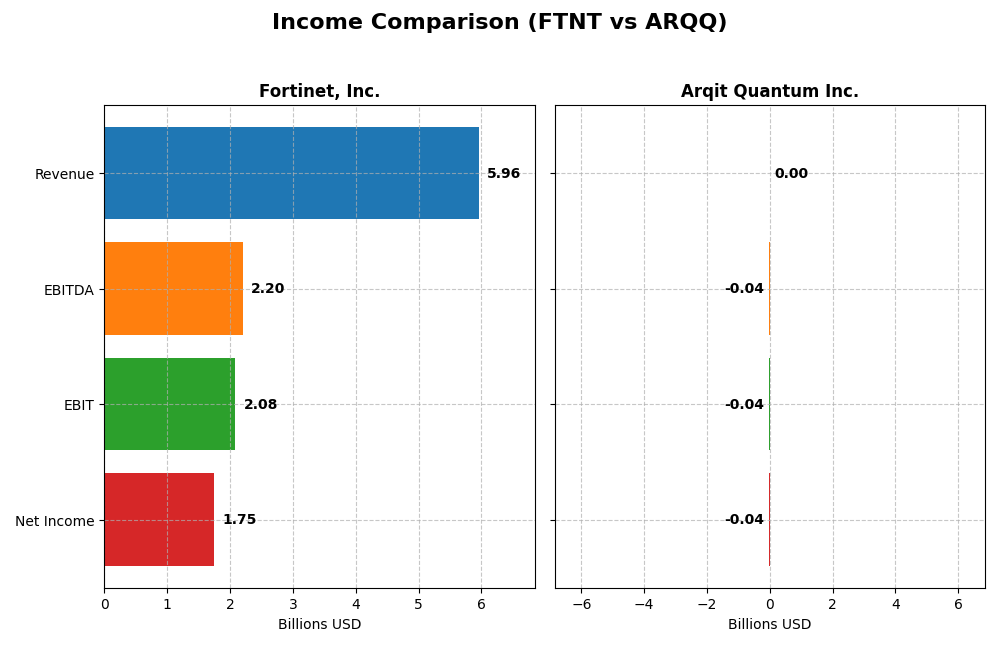
The table below compares the key income statement metrics for Fortinet, Inc. and Arqit Quantum Inc. based on their most recent fiscal years.
| Metric | Fortinet, Inc. (FTNT) | Arqit Quantum Inc. (ARQQ) |
|---|---|---|
| Market Cap | 57.8B | 416M |
| Revenue | 5.96B | 530K |
| EBITDA | 2.20B | -36.8M |
| EBIT | 2.08B | -37.6M |
| Net Income | 1.75B | -35.3M |
| EPS | 2.28 | -2.56 |
| Fiscal Year | 2024 | 2025 |
Income Statement Interpretations
Fortinet, Inc.
Fortinet’s revenue and net income have shown strong growth from 2020 to 2024, with revenue increasing from $2.59B to $5.96B and net income rising from $489M to $1.75B. Margins have remained robust, with a gross margin of 80.56% and net margin of 29.3% in 2024. The latest year showed accelerated growth in revenue (12.27%) and net income (35.43%), reflecting improved profitability and efficient expense management.
Arqit Quantum Inc.
Arqit Quantum’s revenue remains minimal but grew substantially from $47.9K in 2021 to $530K in 2025. However, net income is deeply negative, despite an improvement from a loss of $272M in 2021 to a loss of $35.3M in 2025. Margins are negative, with a gross margin of -43.4% and net margin of -6668.49% in 2025, showing ongoing challenges in profitability. The recent year displayed strong revenue growth (80.89%) but EBIT declined by 58.15%.
Which one has the stronger fundamentals?
Fortinet exhibits stronger fundamentals, with consistent revenue and net income growth, high and stable margins, and favorable profitability metrics. Arqit Quantum shows rapid revenue growth but suffers from persistent heavy losses and negative margins. Despite some positive trends in income growth, Arqit’s overall income statement remains far less favorable than Fortinet’s stable and profitable performance.
Financial Ratios Comparison
This table compares the most recent financial ratios for Fortinet, Inc. (FTNT) and Arqit Quantum Inc. (ARQQ), highlighting key performance and financial health metrics as of their latest fiscal periods.
| Ratios | Fortinet, Inc. (2024) | Arqit Quantum Inc. (2025) |
|---|---|---|
| ROE | 116.8% | -129.8% |
| ROIC | 27.2% | -127.5% |
| P/E | 41.4 | -15.1 |
| P/B | 48.3 | 19.6 |
| Current Ratio | 1.47 | 2.69 |
| Quick Ratio | 1.39 | 2.69 |
| D/E | 0.67 | 0.03 |
| Debt-to-Assets | 10.2% | 1.7% |
| Interest Coverage | 90.2 | -802.9 |
| Asset Turnover | 0.61 | 0.01 |
| Fixed Asset Turnover | 4.41 | 0.74 |
| Payout Ratio | 0 | 0 |
| Dividend Yield | 0% | 0% |
Interpretation of the Ratios
Fortinet, Inc.
Fortinet shows a slightly favorable overall ratio profile with strong returns, including a 116.83% ROE and 27.2% ROIC, indicating efficient use of equity and capital. However, high P/E and P/B ratios point to a potentially overvalued stock. The company does not pay dividends, likely reinvesting earnings to support growth and R&D.
Arqit Quantum Inc.
Arqit’s ratios are largely unfavorable, reflecting significant losses with a negative net margin of -6668.49% and ROE of -129.77%. While liquidity ratios are strong, poor profitability and negative interest coverage highlight financial stress. The absence of dividends aligns with its ongoing investment phase and lack of profitability.
Which one has the best ratios?
Fortinet presents a more robust financial profile with favorable profitability and capital efficiency ratios despite some valuation concerns. Arqit’s ratios reveal weak profitability and financial challenges, resulting in an overall unfavorable evaluation. Based solely on ratios, Fortinet demonstrates stronger financial health.
Strategic Positioning
This section compares the strategic positioning of Fortinet, Inc. and Arqit Quantum Inc., including market position, key segments, and exposure to technological disruption:
Fortinet, Inc.
- Large market cap ($57.7B) with established global presence in cybersecurity, facing competitive pressure in multiple regions.
- Diversified revenue from products ($1.9B), security subscriptions ($2.3B), and technical support ($1.7B) across multiple industries.
- Operates in a mature cybersecurity market with established technologies; potential disruption from emerging quantum and encryption technologies.
Arqit Quantum Inc.
- Small market cap ($416M), UK-based with niche focus, likely facing high competition but less scale pressure.
- Single key segment: QuantumCloud encryption software delivered via satellite and terrestrial platforms.
- Positioned directly in quantum encryption, a disruptive technology in cybersecurity with growth potential but unproven scale.
Fortinet, Inc. vs Arqit Quantum Inc. Positioning
Fortinet’s strategy is diversified with broad product and service offerings across global markets, benefiting from scale but facing intense competition. Arqit’s concentrated focus on quantum encryption targets a specialized niche with disruptive potential but limited current scale and market presence.
Which has the best competitive advantage?
Fortinet demonstrates a durable competitive advantage with very favorable MOAT evaluation due to strong value creation and growing profitability. Arqit shows growing profitability but is currently shedding value, indicating a slightly unfavorable MOAT.
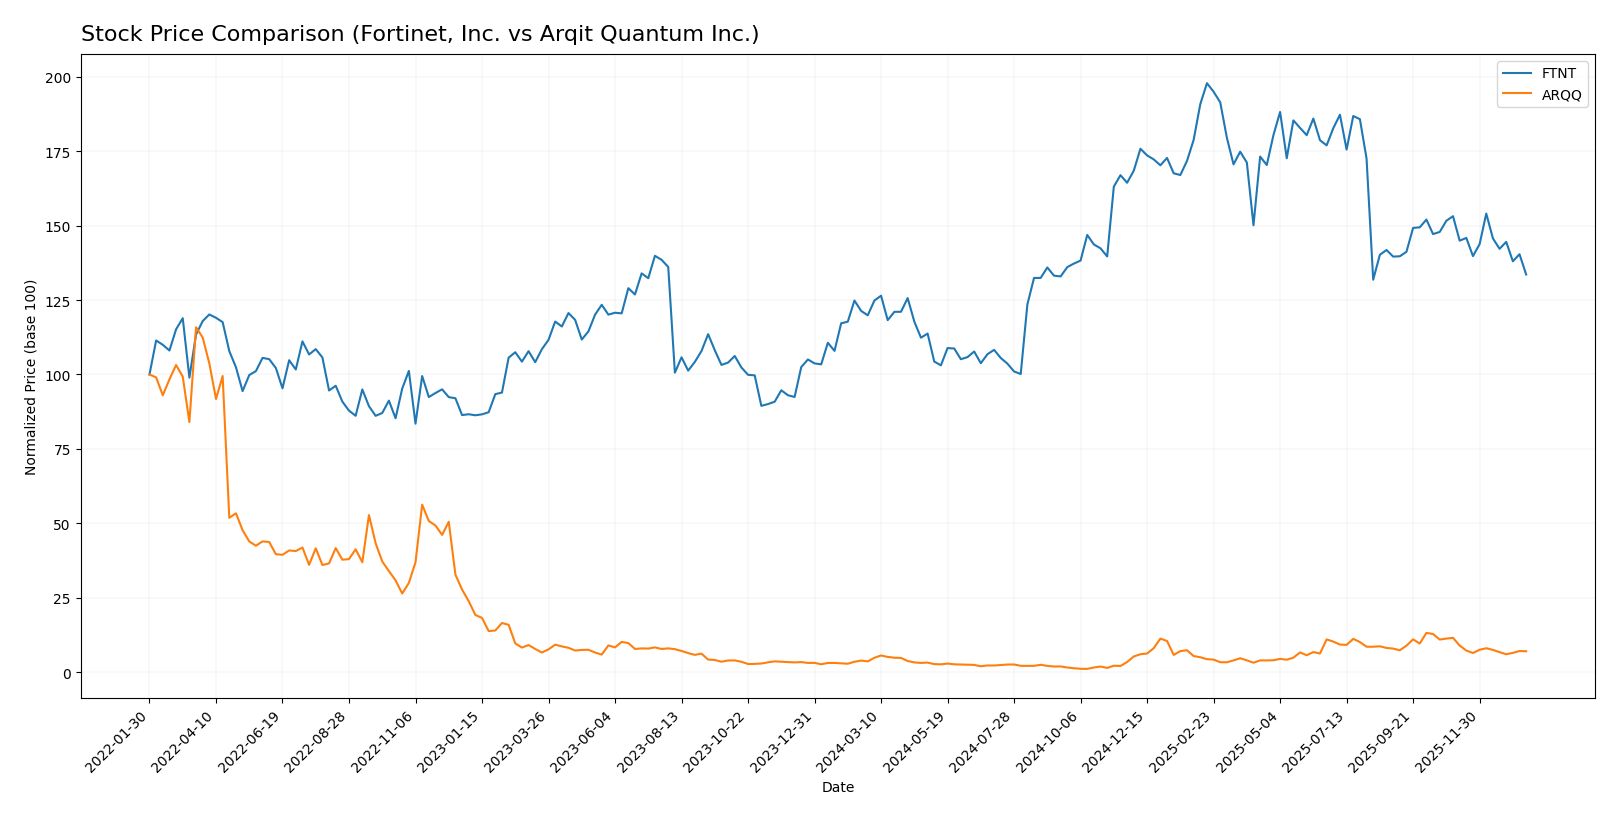
Stock Comparison
The stock price movements over the past 12 months reveal contrasting bullish trends with notable deceleration phases and recent downward corrections in both Fortinet, Inc. and Arqit Quantum Inc.
Trend Analysis
Fortinet, Inc. exhibited a bullish trend with an 11.44% price increase over the past year, though showing deceleration and a recent short-term decline of -12.78%. The stock’s volatility is relatively high, with a standard deviation of 15.27.
Arqit Quantum Inc. posted a strong bullish trend with a 93.6% rise over the same period, also decelerating recently alongside a sharper short-term drop of -39.03%. Volatility remains significant, with an 11.75 standard deviation.
Comparing both, Arqit Quantum Inc. delivered substantially higher market performance over the past year despite recent volatility, outperforming Fortinet by a wide margin in percentage gains.
Target Prices
Here is the current target price consensus for Fortinet, Inc. and Arqit Quantum Inc. based on verified analyst data.
| Company | Target High | Target Low | Consensus |
|---|---|---|---|
| Fortinet, Inc. | 90 | 70 | 82.33 |
| Arqit Quantum Inc. | 60 | 60 | 60 |
Analysts expect Fortinet’s stock to appreciate moderately from its current price of $75.38, while Arqit Quantum shows a strong bullish consensus with a target price more than double its current $26.60.
Analyst Opinions Comparison
This section compares analysts’ ratings and grades for Fortinet, Inc. and Arqit Quantum Inc.:
Rating Comparison
Fortinet, Inc. Rating
- Rating: B+, classified as Very Favorable by analysts.
- Discounted Cash Flow Score: 4, indicating a Favorable outlook.
- ROE Score: 5, considered Very Favorable for profitability.
- ROA Score: 5, rated Very Favorable for asset efficiency.
- Debt To Equity Score: 1, marked Very Unfavorable for leverage.
- Overall Score: 3, categorized as Moderate.
Arqit Quantum Inc. Rating
- Rating: C, also classified as Very Favorable.
- Discounted Cash Flow Score: 2, reflecting a Moderate outlook.
- ROE Score: 1, viewed as Very Unfavorable.
- ROA Score: 1, rated Very Unfavorable.
- Debt To Equity Score: 4, considered Favorable for balance sheet strength.
- Overall Score: 2, also Moderate.
Which one is the best rated?
Based strictly on the provided data, Fortinet holds higher ratings in overall score, discounted cash flow, ROE, and ROA, while Arqit scores better only in debt-to-equity. Fortinet is generally better rated.
Scores Comparison
Here is a comparison of the Altman Z-Score and Piotroski Score for Fortinet, Inc. and Arqit Quantum Inc.:
FTNT Scores
- Altman Z-Score: 5.59, indicating a safe financial zone and low bankruptcy risk.
- Piotroski Score: 6, categorized as average financial strength.
ARQQ Scores
- Altman Z-Score: -0.22, in the distress zone, signaling high bankruptcy risk.
- Piotroski Score: 2, considered very weak financial health.
Which company has the best scores?
Based strictly on the provided data, Fortinet, Inc. has significantly better scores, with a much higher Altman Z-Score in the safe zone and a stronger Piotroski Score compared to Arqit Quantum Inc., which shows distress and very weak financial health.
Grades Comparison
Here is the detailed comparison of the recent grades assigned to Fortinet, Inc. and Arqit Quantum Inc.:
Fortinet, Inc. Grades
The following table summarizes Fortinet’s recent grades from established grading companies:
| Grading Company | Action | New Grade | Date |
|---|---|---|---|
| Citigroup | Maintain | Neutral | 2026-01-13 |
| Piper Sandler | Maintain | Neutral | 2026-01-05 |
| Morgan Stanley | Maintain | Underweight | 2025-12-18 |
| JP Morgan | Downgrade | Underweight | 2025-12-17 |
| JP Morgan | Maintain | Neutral | 2025-11-06 |
| UBS | Maintain | Neutral | 2025-11-06 |
| Piper Sandler | Maintain | Neutral | 2025-11-06 |
| Barclays | Maintain | Equal Weight | 2025-11-06 |
| Mizuho | Maintain | Underperform | 2025-11-06 |
| RBC Capital | Maintain | Sector Perform | 2025-11-06 |
Fortinet’s grades mostly cluster around neutral to underweight ratings, with multiple firms maintaining their stance and one notable downgrade by JP Morgan.
Arqit Quantum Inc. Grades
Below is the grade summary for Arqit Quantum Inc. exclusively from HC Wainwright & Co.:
| Grading Company | Action | New Grade | Date |
|---|---|---|---|
| HC Wainwright & Co. | Maintain | Buy | 2025-10-13 |
| HC Wainwright & Co. | Maintain | Buy | 2025-09-18 |
| HC Wainwright & Co. | Maintain | Buy | 2024-12-31 |
| HC Wainwright & Co. | Maintain | Buy | 2024-12-06 |
| HC Wainwright & Co. | Maintain | Buy | 2024-07-11 |
| HC Wainwright & Co. | Maintain | Buy | 2024-05-29 |
| HC Wainwright & Co. | Maintain | Buy | 2024-05-15 |
| HC Wainwright & Co. | Maintain | Buy | 2023-11-22 |
| HC Wainwright & Co. | Maintain | Buy | 2023-09-27 |
| HC Wainwright & Co. | Maintain | Buy | 2023-09-26 |
Arqit Quantum has consistently received “Buy” ratings, all from the same grading company, HC Wainwright & Co., indicating a stable positive outlook from this source.
Which company has the best grades?
Arqit Quantum Inc. has predominantly received “Buy” ratings from its sole grading company, reflecting a more optimistic view compared to Fortinet, Inc., whose grades are mostly “Neutral” or “Underweight.” For investors, Arqit’s consistently positive grades may indicate higher growth expectations, while Fortinet’s mixed to cautious ratings suggest more moderate prospects and risk considerations.
Strengths and Weaknesses
Below is a comparative table highlighting key strengths and weaknesses of Fortinet, Inc. (FTNT) and Arqit Quantum Inc. (ARQQ) based on their latest financial and operational data.
| Criterion | Fortinet, Inc. (FTNT) | Arqit Quantum Inc. (ARQQ) |
|---|---|---|
| Diversification | Strong product portfolio with security subscriptions and technical support, generating $5.96B in 2024 revenue across multiple streams. | Limited product range; primarily focused on quantum encryption technology with no reported revenue segmentation. |
| Profitability | High profitability with 29.3% net margin and 27.2% ROIC; consistently creating value. | Negative profitability with a net margin of -6668.49% and ROIC at -127.45%; currently shedding value. |
| Innovation | Consistent growth in ROIC (25.6% increase) indicating successful innovation and competitive edge. | Growing ROIC trend (28.6%) suggests improving innovation but still unprofitable. |
| Global presence | Established global cybersecurity presence with diverse client base. | Emerging player with limited global footprint and market penetration. |
| Market Share | Significant market share in cybersecurity with growing revenues and strong asset turnover. | Very low asset turnover (0.01) indicates minimal market traction. |
Key takeaways: Fortinet demonstrates robust diversification, strong profitability, and a durable competitive advantage with growing profitability. Arqit, while showing innovation and improving profitability trends, remains unprofitable and less diversified, indicating higher investment risk.
Risk Analysis
Below is a comparative risk table for Fortinet, Inc. (FTNT) and Arqit Quantum Inc. (ARQQ) based on the most recent data from 2025-2026.
| Metric | Fortinet, Inc. (FTNT) | Arqit Quantum Inc. (ARQQ) |
|---|---|---|
| Market Risk | Moderate (Beta 1.07) | High (Beta 2.41) |
| Debt Level | Moderate (D/E 0.67, Favorable) | Very Low (D/E 0.03, Favorable) |
| Regulatory Risk | Moderate (Global cybersecurity regulations) | Elevated (Quantum encryption tech, UK & global regulations) |
| Operational Risk | Moderate (Scale & complexity of product suite) | High (Small team, emerging tech risk) |
| Environmental Risk | Low | Low |
| Geopolitical Risk | Moderate (US-based, global sales) | Elevated (UK-based, geopolitical tech sensitivity) |
Fortinet’s risks are mostly moderate with strong financial stability and a safe Altman Z-Score (5.59). Arqit faces higher market and operational risks, distressed financial health (Altman Z-Score below 0), and weak profitability, making it more vulnerable to market volatility and regulatory shifts in emerging quantum tech. Investors should weigh Fortinet’s stable profile against Arqit’s high-risk, high-reward potential.
Which Stock to Choose?
Fortinet, Inc. (FTNT) shows a strong income evolution with consistent revenue and net income growth over 2020-2024. Its financial ratios are largely favorable, highlighting high profitability and efficient capital use, supported by low debt and a very favorable rating of B+. The company demonstrates a very favorable moat with ROIC well above WACC and increasing profitability.
Arqit Quantum Inc. (ARQQ) presents volatile income figures with unfavorable margins and profitability, despite high revenue growth. Financial ratios mostly indicate unfavorable status, reflecting value destruction and weak asset utilization. Its debt level is low, but the overall rating of C and distress-zone Altman Z-Score suggest financial instability and a slightly unfavorable moat.
For investors, FTNT’s very favorable rating and durable competitive advantage might appeal to those prioritizing quality and stability. Conversely, ARQQ’s high revenue growth but unfavorable profitability and financial health could be of interest to risk-tolerant investors seeking potential growth opportunities despite higher risk. These interpretations depend on individual risk profiles and investment strategies.
Disclaimer: Investment carries a risk of loss of initial capital. The past performance is not a reliable indicator of future results. Be sure to understand risks before making an investment decision.
Go Further
I encourage you to read the complete analyses of Fortinet, Inc. and Arqit Quantum Inc. to enhance your investment decisions: