Home > Comparison > Technology > FFIV vs ARQQ
The strategic rivalry between F5, Inc. and Arqit Quantum Inc. shapes the landscape of software infrastructure technology. F5, a mature, capital-intensive enterprise, delivers multi-cloud application security at scale. In contrast, Arqit Quantum, a nimble innovator, pioneers quantum encryption for cybersecurity. This analysis explores their divergent growth and risk profiles. I aim to identify which trajectory offers superior risk-adjusted returns for a diversified portfolio in the evolving tech sector.
Table of contents
Companies Overview
F5, Inc. and Arqit Quantum Inc. represent distinct pillars in the evolving software infrastructure sector.
F5, Inc.: Multi-Cloud Application Security Leader
F5, Inc. dominates as a provider of multi-cloud application security and delivery solutions. Its revenue stems from selling advanced hardware and software modules that secure and optimize network applications across on-premises and public clouds. In 2026, its strategic focus remains on expanding partnerships with major cloud providers like AWS, Microsoft Azure, and Google Cloud to enhance application performance and security.
Arqit Quantum Inc.: Innovator in Quantum Cybersecurity
Arqit Quantum Inc. is a UK-based pioneer in quantum encryption technology delivered via satellite and terrestrial platforms. Its core revenue source is QuantumCloud, a software agent enabling highly secure encryption key exchanges across devices. In 2026, Arqit concentrates on scaling its unique quantum cybersecurity platform, aiming to redefine secure communications in an increasingly connected world.
Strategic Collision: Similarities & Divergences
Both companies operate within software infrastructure but diverge in approach: F5 leverages a robust, cloud-integrated security stack, while Arqit bets on cutting-edge quantum encryption. Their primary battleground is data security, with F5 focusing on enterprise multi-cloud environments and Arqit targeting next-gen quantum-safe communications. Investors face contrasting profiles—F5 offers scale and stability, whereas Arqit embodies high-growth innovation with elevated volatility.
Income Statement Comparison
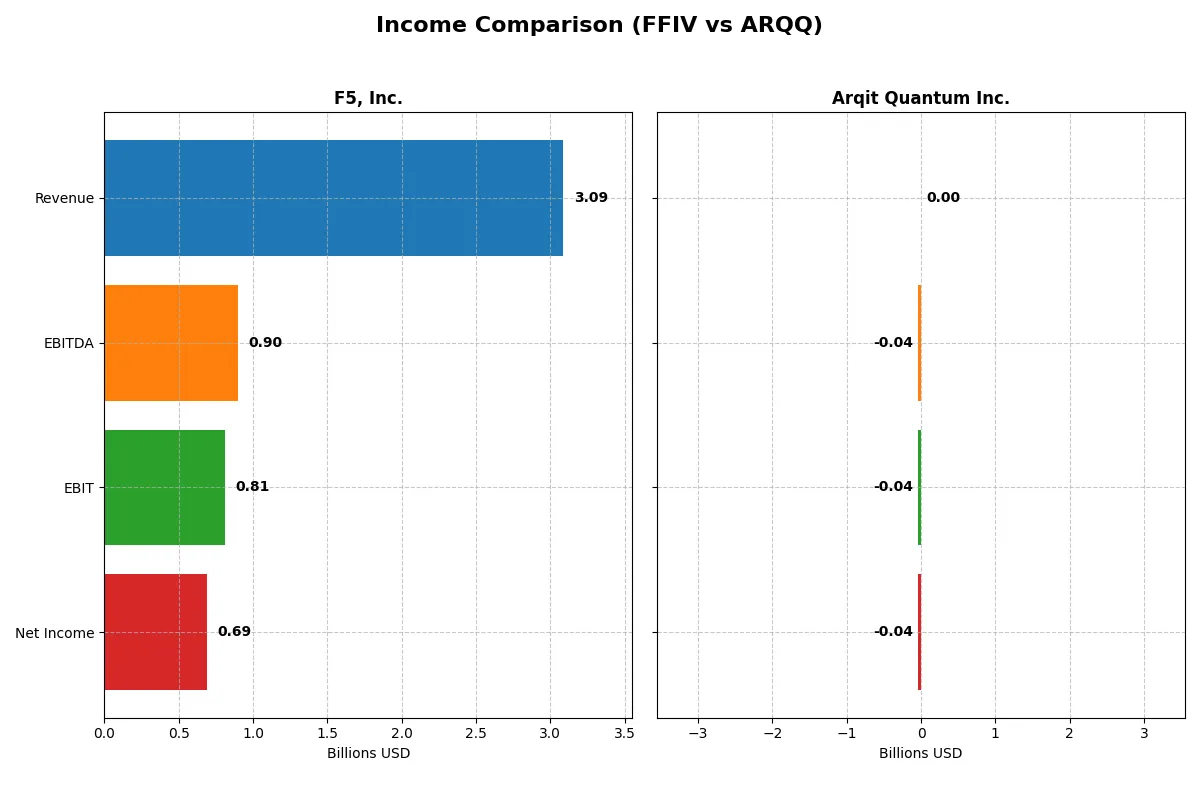
This data dissects the core profitability and scalability of both corporate engines to reveal who dominates the bottom line:
| Metric | F5, Inc. (FFIV) | Arqit Quantum Inc. (ARQQ) |
|---|---|---|
| Revenue | 3.09B | 530K |
| Cost of Revenue | 564M | 760K |
| Operating Expenses | 1.76B | 38.7M |
| Gross Profit | 2.52B | -230K |
| EBITDA | 901M | -36.8M |
| EBIT | 808M | -37.6M |
| Interest Expense | 0 | 48K |
| Net Income | 692M | -35.3M |
| EPS | 11.95 | -2.56 |
| Fiscal Year | 2025 | 2025 |
Income Statement Analysis: The Bottom-Line Duel
This income statement comparison exposes the true operational efficiency and profitability of two distinct corporate engines in 2025.
F5, Inc. Analysis
F5, Inc. demonstrates strong growth with 3.09B in revenue and 692M net income in 2025, up from 2.82B and 567M in 2024. Its gross margin stands at a robust 81.7%, signaling excellent cost control. The net margin of 22.4% confirms solid profitability. Momentum is evident as net income and EPS surged over 20% year-over-year.
Arqit Quantum Inc. Analysis
Arqit Quantum reports modest revenue of 530K in 2025 but posts a net loss of 35M, an improvement from a 55M loss in 2024. The negative gross margin of -43.4% highlights severe cost issues relative to revenue. Despite a steep EBIT margin deficit of -7088%, revenue growth exceeds 80%, showing early-stage momentum. However, sustained losses raise caution.
Margin Mastery vs. Growth Gambit
F5, Inc. excels with exceptional profitability and margin expansion, delivering consistent bottom-line growth and operational efficiency. Arqit Quantum shows rapid top-line growth but remains deeply unprofitable with heavy losses and negative margins. For investors, F5’s mature, margin-driven profile offers a more reliable foundation compared to Arqit’s high-risk growth trajectory.
Financial Ratios Comparison
These vital ratios act as a diagnostic tool to expose the underlying fiscal health, valuation premiums, and capital efficiency for the companies compared below:
| Ratios | F5, Inc. (FFIV) | Arqit Quantum Inc. (ARQQ) |
|---|---|---|
| ROE | 19.3% | -129.8% |
| ROIC | 14.0% | -127.5% |
| P/E | 26.9 | -15.1 |
| P/B | 5.19 | 19.62 |
| Current Ratio | 1.56 | 2.69 |
| Quick Ratio | 1.51 | 2.69 |
| D/E | 0.064 | 0.026 |
| Debt-to-Assets | 3.65% | 1.68% |
| Interest Coverage | 0 | -803 |
| Asset Turnover | 0.49 | 0.012 |
| Fixed Asset Turnover | 9.02 | 0.74 |
| Payout ratio | 0 | 0 |
| Dividend yield | 0 | 0 |
| Fiscal Year | 2025 | 2025 |
Efficiency & Valuation Duel: The Vital Signs
Financial ratios act as a company’s DNA, unveiling hidden risks and operational strengths that guide investment decisions.
F5, Inc.
F5, Inc. demonstrates strong profitability with a ROE of 19.28% and a healthy net margin of 22.42%. Its valuation appears stretched, reflected in a high P/E of 26.91 and a P/B of 5.19. The company foregoes dividends, instead reinvesting heavily in R&D, supporting sustainable growth and operational efficiency.
Arqit Quantum Inc.
Arqit Quantum shows significant operational challenges with a deeply negative ROE at -129.77% and a net margin of -6668.49%. Its valuation metrics are extreme, with a negative P/E and a high P/B of 19.62, signaling distress. Despite a solid current ratio of 2.69, it lacks dividends and depends on cash burn, raising concerns about capital allocation.
Operational Strength vs. High-Risk Speculation
F5, Inc. offers a superior balance of profitability and risk management, reflecting operational strength despite a premium valuation. Arqit Quantum’s ratios warn of deep financial distress and speculative risk. Investors seeking stability may prefer F5, while those with high risk tolerance might consider Arqit’s volatile profile.
Which one offers the Superior Shareholder Reward?
I compare F5, Inc. (FFIV) and Arqit Quantum Inc. (ARQQ) on shareholder returns. FFIV pays no dividends but generates strong free cash flow, supporting robust buybacks and sustainable capital allocation. ARQQ offers no dividends, suffers consistent losses, and negative cash flows, relying on reinvestment for growth with no buyback activity. FFIV’s 2025 free cash flow per share stands at $15.7 with a free cash flow operating cash flow ratio near 95%, indicating excellent cash conversion. Its buyback program, though not quantified here, is feasible given low debt and strong margins above 22%. ARQQ’s margins remain deeply negative, with a net margin of -67% and severe operating losses, undermining any near-term returns. I conclude FFIV offers the superior total shareholder reward in 2026 due to sustainable free cash flow-driven buybacks and operational profitability.
Comparative Score Analysis: The Strategic Profile
The radar chart reveals the fundamental DNA and trade-offs of both firms, highlighting their core financial strengths and vulnerabilities:
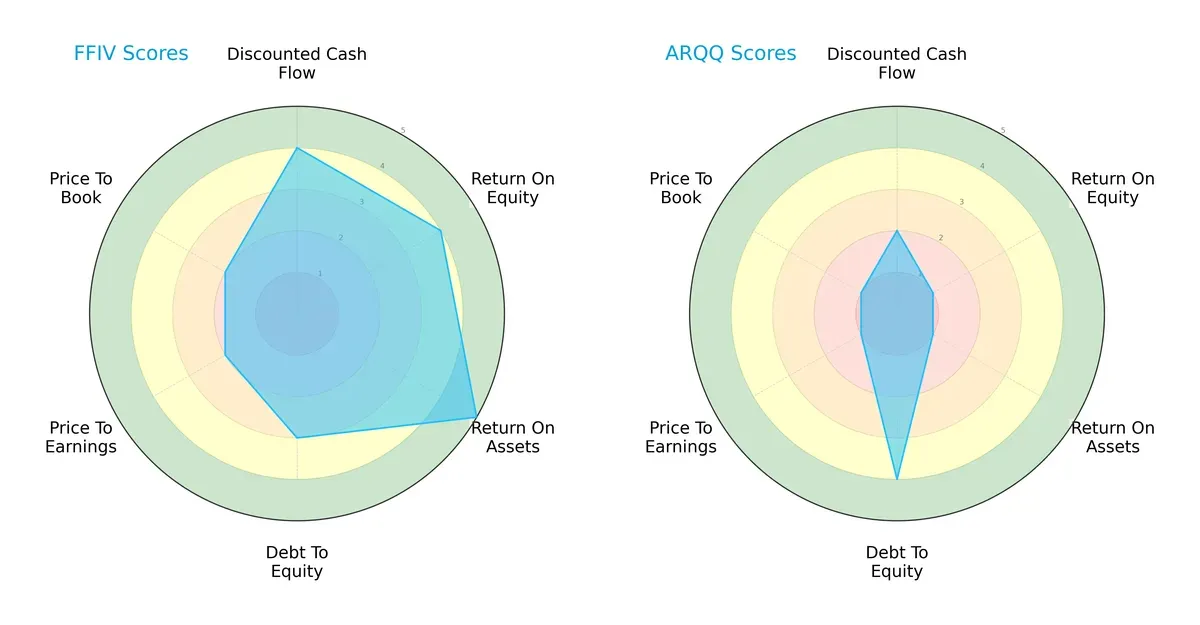
F5, Inc. exhibits a balanced profile with strong returns (ROE 4, ROA 5) and a solid discounted cash flow score (4). Its moderate leverage (Debt/Equity 3) contrasts with Arqit Quantum Inc.’s higher financial risk tolerance (Debt/Equity 4). Arqit relies heavily on leverage but scores very low on profitability (ROE 1, ROA 1) and valuation metrics (P/E 1, P/B 1), indicating a lack of operational efficiency and expensive market pricing. F5 clearly holds the more stable and diversified advantage.
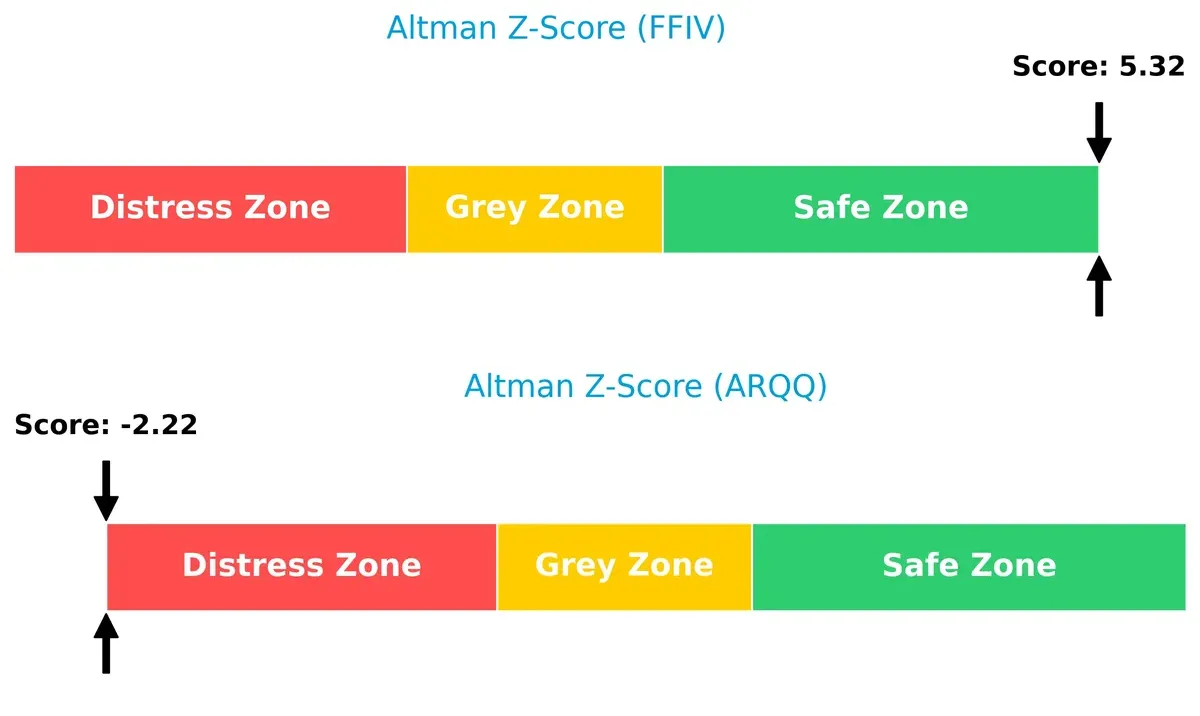
Bankruptcy Risk: Solvency Showdown
F5’s Altman Z-Score at 5.32 places it firmly in the safe zone, signaling strong financial resilience. Arqit’s score of -2.22 signals distress, implying significant bankruptcy risk under current economic cycles:
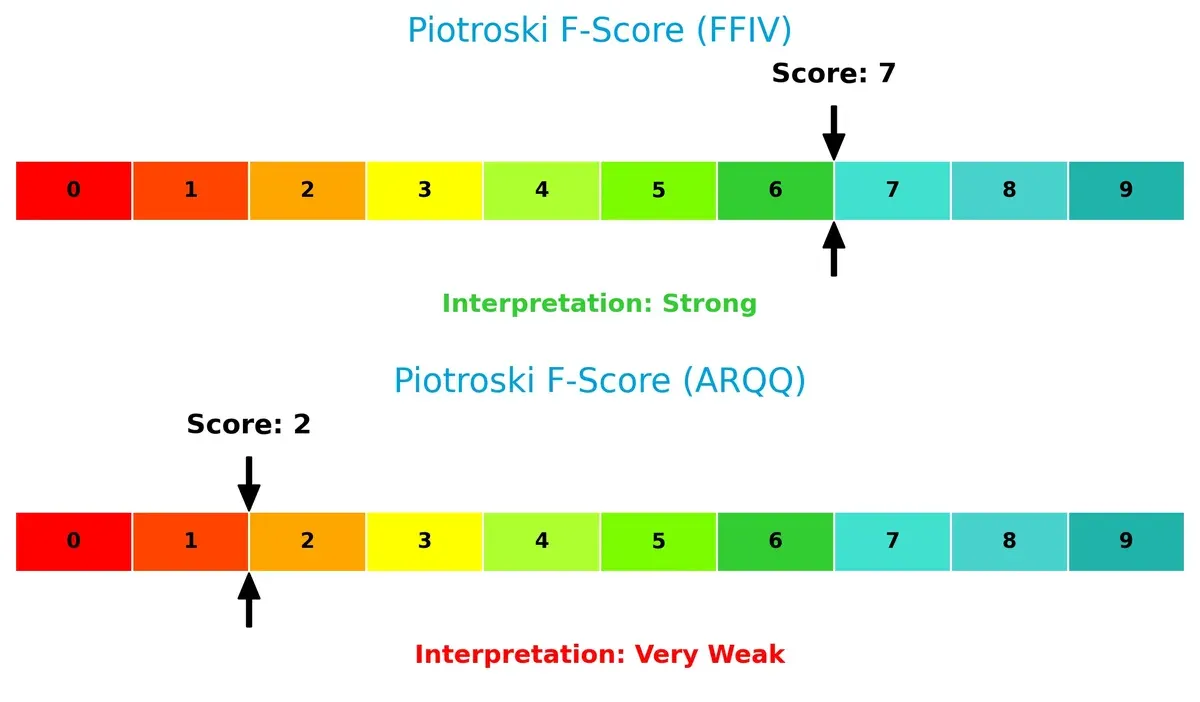
Financial Health: Quality of Operations
F5’s Piotroski F-Score of 7 reflects robust operational quality and financial strength. Arqit’s weak score of 2 raises red flags about internal financial health and sustainability:
How are the two companies positioned?
This section dissects the operational DNA of F5 and Arqit by comparing their revenue distribution and internal dynamics. The goal is to confront their economic moats to reveal which business model offers the most resilient competitive advantage today.
Revenue Segmentation: The Strategic Mix
This visual comparison dissects how both F5, Inc. and Arqit Quantum Inc. diversify their income streams and where their primary sector bets lie:
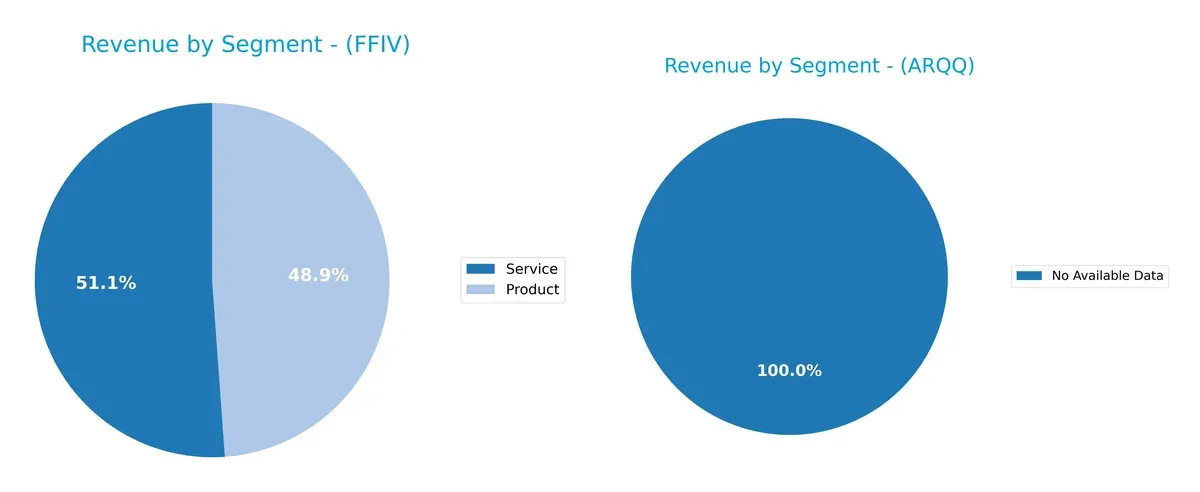
F5, Inc. anchors its revenue almost evenly between Product ($1.51B) and Service ($1.58B) segments in 2025, showing a balanced diversification that reduces concentration risk. Arqit Quantum Inc. lacks available data, preventing a segmentation comparison. F5’s mix suggests a strategic pivot between tangible infrastructure and recurring services, reinforcing ecosystem lock-in and steady cash flow amid sector cyclicality.
Strengths and Weaknesses Comparison
This table compares the Strengths and Weaknesses of F5, Inc. and Arqit Quantum Inc.:
F5 Strengths
- Balanced revenue from products (1.51B) and services (1.58B)
- Favorable profitability with 22.42% net margin and 19.28% ROE
- Strong liquidity ratios: current ratio 1.56 and quick ratio 1.51
- Low leverage: debt-to-assets 3.65% and interest coverage infinite
- Global presence with diversified Americas, EMEA, Asia Pacific sales
Arqit Strengths
- Strong liquidity with current and quick ratios at 2.69
- Very low debt levels: debt-to-assets 1.68% and debt/equity 0.03
F5 Weaknesses
- Unfavorable valuation multiples: PE 26.91, PB 5.19
- Asset turnover low at 0.49, limiting efficiency
- Zero dividend yield despite positive profitability
Arqit Weaknesses
- Severe negative profitability: net margin -6668%, ROE -130%, ROIC -127%
- High WACC at 15.13%, indicating costly capital
- Negative interest coverage at -783, signaling financial distress
- Poor asset turnover at 0.01 and fixed asset turnover 0.74
- Elevated PB multiple at 19.62 and zero dividend yield
F5 demonstrates solid profitability, balanced revenue streams, and a strong global footprint, but valuation and asset utilization require attention. Arqit excels in liquidity and minimal debt but struggles with severe losses and efficiency challenges, highlighting significant operational risks.
The Moat Duel: Analyzing Competitive Defensibility
A structural moat is the only reliable shield against relentless competitive erosion of long-term profits. Here is the moat comparison of:
F5, Inc.: Durable Value Creator with Network Effects
F5 leverages network effects and enterprise switching costs to sustain high ROIC above WACC, reflected in stable 26% EBIT margins. Its multi-cloud security offerings position it to deepen its moat in 2026 amid rising cloud adoption.
Arqit Quantum Inc.: Emerging Innovator with Intangible Assets
Arqit’s moat rests on cutting-edge quantum encryption technology, a stark contrast to F5’s established base. Despite negative margins, its rapid revenue growth signals potential, but its current value destruction risks slowing moat development.
The Moat Face-off: Established Network Effects vs. Nascent Quantum Innovation
F5 commands a wider, more durable moat with strong profitability and capital efficiency. Arqit’s growing but currently negative ROIC spotlights value destruction risks. F5 remains better equipped to defend and expand market share in 2026.
Which stock offers better returns?
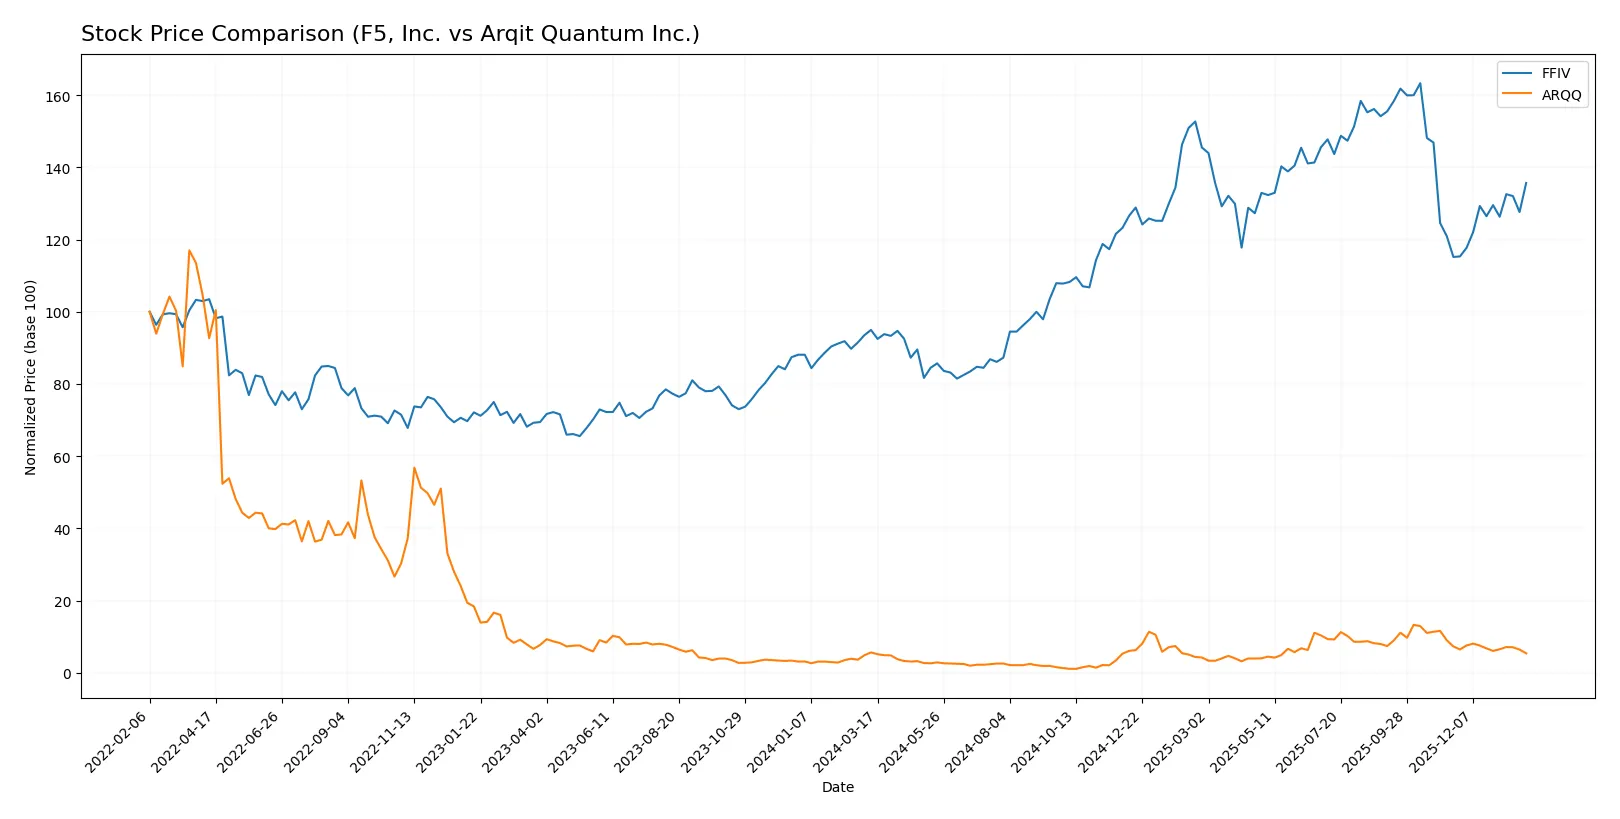
Over the past 12 months, F5, Inc. showed a strong upward price movement with accelerating gains, while Arqit Quantum Inc. experienced a declining trend marked by deceleration and recent sharp losses.
Trend Comparison
F5, Inc.’s stock rose 42.85% over the past year, reflecting a bullish trend with accelerating momentum and notable volatility, hitting a high of 331.75 and a low of 165.57.
Arqit Quantum Inc. declined 4.38% in the same period, showing a bearish trend with decelerating losses and lower volatility, reaching a high of 49.92 and a low of 4.19.
F5, Inc. delivered the highest market performance, outperforming Arqit Quantum Inc. by a wide margin in both price appreciation and volume dynamics.
Target Prices
Analysts set a bullish consensus on F5, Inc. and Arqit Quantum Inc., projecting meaningful upside from current prices.
| Company | Target Low | Target High | Consensus |
|---|---|---|---|
| F5, Inc. | 295 | 352 | 330.67 |
| Arqit Quantum Inc. | 60 | 60 | 60 |
F5, Inc.’s consensus target of 331 suggests a 20% upside versus its current 276 USD price. Arqit Quantum’s 60 USD target implies nearly triple its present 20 USD level.

Don’t Let Luck Decide Your Entry Point
Optimize your entry points with our advanced ProRealTime indicators. You’ll get efficient buy signals with precise price targets for maximum performance. Start outperforming now!
How do institutions grade them?
The following presents the latest institutional grades for F5, Inc. and Arqit Quantum Inc.:
F5, Inc. Grades
Here are the recent grades from leading financial institutions for F5, Inc.:
| Grading Company | Action | New Grade | Date |
|---|---|---|---|
| RBC Capital | Maintain | Outperform | 2026-01-28 |
| Needham | Maintain | Hold | 2026-01-28 |
| Goldman Sachs | Maintain | Neutral | 2026-01-28 |
| Piper Sandler | Maintain | Overweight | 2026-01-28 |
| Barclays | Maintain | Equal Weight | 2026-01-28 |
| JP Morgan | Upgrade | Overweight | 2026-01-15 |
| Piper Sandler | Upgrade | Overweight | 2026-01-05 |
| RBC Capital | Upgrade | Outperform | 2026-01-05 |
| Morgan Stanley | Maintain | Equal Weight | 2025-12-17 |
| Morgan Stanley | Maintain | Equal Weight | 2025-10-28 |
Arqit Quantum Inc. Grades
This table summarizes the ongoing ratings from a recognized grading company for Arqit Quantum Inc.:
| Grading Company | Action | New Grade | Date |
|---|---|---|---|
| HC Wainwright & Co. | Maintain | Buy | 2025-10-13 |
| HC Wainwright & Co. | Maintain | Buy | 2025-09-18 |
| HC Wainwright & Co. | Maintain | Buy | 2024-12-31 |
| HC Wainwright & Co. | Maintain | Buy | 2024-12-06 |
| HC Wainwright & Co. | Maintain | Buy | 2024-07-11 |
| HC Wainwright & Co. | Maintain | Buy | 2024-05-29 |
| HC Wainwright & Co. | Maintain | Buy | 2024-05-15 |
| HC Wainwright & Co. | Maintain | Buy | 2023-11-22 |
| HC Wainwright & Co. | Maintain | Buy | 2023-09-27 |
| HC Wainwright & Co. | Maintain | Buy | 2023-09-26 |
Which company has the best grades?
F5, Inc. shows a mix of Hold, Neutral, and Outperform grades, with recent upgrades to Outperform and Overweight. Arqit Quantum Inc. consistently holds a Buy rating from a single firm. Investors may view F5’s diverse analyst opinions as reflecting nuanced risk and opportunity, while Arqit’s uniform Buy ratings suggest strong support from its sole grading source.
Risks specific to each company
The following categories identify the critical pressure points and systemic threats facing both firms in the 2026 market environment:
1. Market & Competition
F5, Inc.
- Established player in multi-cloud security with steady enterprise demand. Faces intense competition from cloud-native and cybersecurity firms.
Arqit Quantum Inc.
- Emerging quantum cybersecurity firm with niche technology but limited market penetration and higher competitive uncertainty.
2. Capital Structure & Debt
F5, Inc.
- Very low debt-to-equity ratio (0.06), strong interest coverage, and solid liquidity reduce financial risk.
Arqit Quantum Inc.
- Also low debt-to-equity (0.03), but negative interest coverage signals inability to service interest, raising solvency concerns.
3. Stock Volatility
F5, Inc.
- Beta near 1 (0.975) indicates market-level volatility, reflecting stable investor sentiment.
Arqit Quantum Inc.
- High beta (2.407) shows significant price swings, adding risk for investors sensitive to volatility.
4. Regulatory & Legal
F5, Inc.
- Operates globally with exposure to data privacy and cybersecurity regulations; manageable regulatory risks due to experience.
Arqit Quantum Inc.
- UK-based quantum tech faces evolving regulations in emerging tech sectors, increasing compliance uncertainty.
5. Supply Chain & Operations
F5, Inc.
- Large, diversified operations with robust supply chain; risks mitigated by scale and established partnerships.
Arqit Quantum Inc.
- Small workforce (82 employees) and novel technology imply potential operational fragility and supply chain constraints.
6. ESG & Climate Transition
F5, Inc.
- Focus on multi-cloud solutions supports sustainability, but sector-wide energy use and data center emissions remain challenges.
Arqit Quantum Inc.
- Quantum encryption promises energy-efficient security; however, limited ESG disclosures increase transparency risk.
7. Geopolitical Exposure
F5, Inc.
- Global footprint subjects F5 to geopolitical tensions, but diversified markets reduce single-region dependency.
Arqit Quantum Inc.
- UK-centric operations expose Arqit to Brexit-related trade and regulatory uncertainties impacting growth.
Which company shows a better risk-adjusted profile?
F5, Inc. displays a far stronger risk-adjusted profile. Its robust capital structure, stable market position, and safe-zone Altman Z-score (5.3) affirm financial resilience. Arqit Quantum’s distress-zone Z-score (-2.2) and weak profitability metrics highlight significant financial instability. The most impactful risk for F5 is intense competition in cloud security, while Arqit’s greatest threat is severe financial distress coupled with high stock volatility. Recent data confirming Arqit’s negative interest coverage and elevated beta underscore my caution regarding its risk profile.
Final Verdict: Which stock to choose?
F5, Inc. (FFIV) showcases its superpower as a cash-generating machine with a durable competitive advantage. Its ability to consistently generate returns well above its cost of capital signals efficient capital allocation. The main point of vigilance remains its premium valuation multiples. FFIV suits portfolios targeting steady, aggressive growth.
Arqit Quantum Inc. (ARQQ) offers a strategic moat in quantum encryption technology, promising long-term industry disruption. However, its financial profile reveals a value-destroying status with negative profitability metrics, reflecting higher risk. ARQQ fits investors with high risk tolerance seeking speculative growth and asymmetric upside.
If you prioritize strong cash flow and proven value creation, FFIV is the compelling choice due to its durable moat and financial stability. However, if you seek speculative, high-potential growth in emerging technology, ARQQ offers an opportunity, albeit with significantly higher risk and volatility. Both require careful risk management aligned with investor risk appetite.
Disclaimer: Investment carries a risk of loss of initial capital. The past performance is not a reliable indicator of future results. Be sure to understand risks before making an investment decision.
Go Further
I encourage you to read the complete analyses of F5, Inc. and Arqit Quantum Inc. to enhance your investment decisions: