In today’s fast-evolving technology landscape, CCC Intelligent Solutions Holdings Inc. (CCCS) and Arqit Quantum Inc. (ARQQ) stand out as innovators in the software infrastructure sector. CCCS leverages AI and cloud platforms to transform the insurance economy, while ARQQ pioneers quantum cybersecurity solutions via satellite and terrestrial networks. This comparison explores their market positions and innovation strategies to help you identify the most compelling investment opportunity. Let’s dive into which company holds the greatest potential for your portfolio.
Table of contents
Companies Overview
I will begin the comparison between CCC Intelligent Solutions Holdings Inc. and Arqit Quantum Inc. by providing an overview of these two companies and their main differences.
CCC Intelligent Solutions Holdings Inc. Overview
CCC Intelligent Solutions Holdings Inc. operates in the technology sector, specializing in software infrastructure for the property and casualty insurance market. The company offers a SaaS platform with AI-enabled workflows that connect insurance carriers, repairers, parts suppliers, and other stakeholders. Founded in 1980 and headquartered in Chicago, CCC focuses on digitizing insurance processes with solutions spanning insurance, repair, ecosystem, and international services.
Arqit Quantum Inc. Overview
Arqit Quantum Inc. is a UK-based technology company providing cybersecurity services through satellite and terrestrial platforms. Its flagship product, QuantumCloud, enables secure encryption key generation via lightweight software agents on any device. Founded more recently, Arqit operates with a smaller workforce and focuses on innovating security technology within the software infrastructure industry, trading on the NASDAQ Capital Market.
Key similarities and differences
Both companies operate in the software infrastructure segment within the technology sector and are publicly traded on NASDAQ exchanges. CCC targets the insurance ecosystem with a broad SaaS platform integrating AI and telematics, while Arqit concentrates on cybersecurity leveraging quantum encryption technology. CCC has a significantly larger market cap and employee base, reflecting its mature, diversified operations compared to Arqit’s niche focus and earlier-stage profile.
Income Statement Comparison
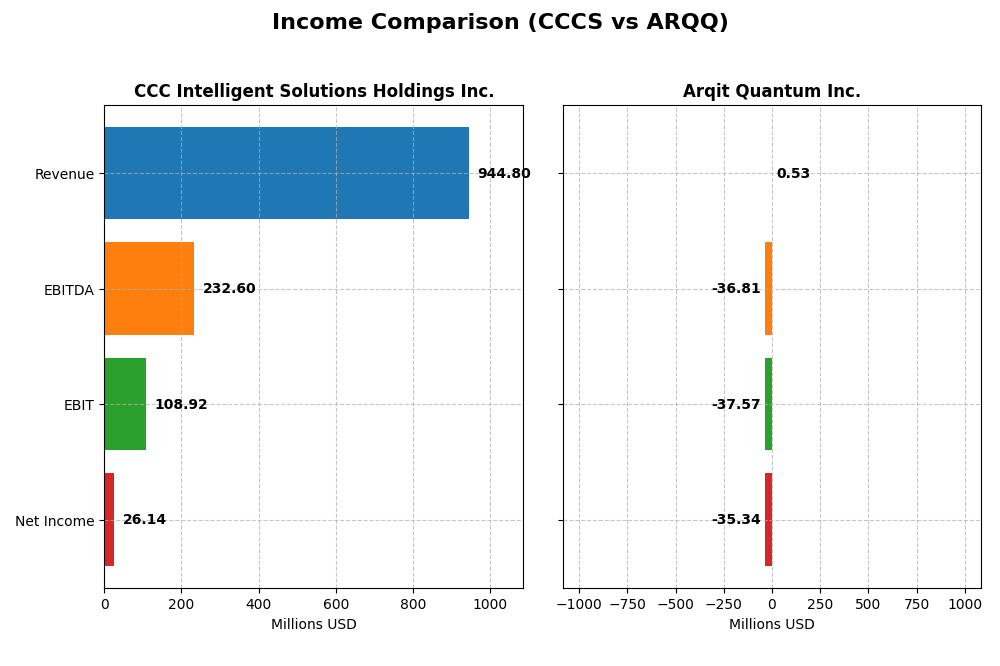
Below is a side-by-side comparison of key income statement metrics for CCC Intelligent Solutions Holdings Inc. and Arqit Quantum Inc. for their most recent fiscal years.
| Metric | CCC Intelligent Solutions Holdings Inc. | Arqit Quantum Inc. |
|---|---|---|
| Market Cap | 5.63B USD | 416M USD |
| Revenue | 945M USD | 530K USD |
| EBITDA | 233M USD | -36.8M USD |
| EBIT | 109M USD | -37.6M USD |
| Net Income | 26.1M USD | -35.3M USD |
| EPS | 0.0428 USD | -2.56 USD |
| Fiscal Year | 2024 | 2025 |
Income Statement Interpretations
CCC Intelligent Solutions Holdings Inc.
CCC Intelligent Solutions Holdings Inc. shows consistent revenue growth from $633M in 2020 to $945M in 2024, with net income turning positive after losses in earlier years. Margins improved notably, with a gross margin of 75.55% and a favorable EBIT margin of 11.53% in 2024. The latest year saw revenue growth of 9.05% and a significant EBIT increase of 619%, reflecting operational improvements.
Arqit Quantum Inc.
Arqit Quantum Inc.’s revenue expanded sharply from $48K in 2021 to $530K in 2025, with net income remaining deeply negative but improving over time. The company’s margins remain unfavorable, with a gross margin of -43.4% and an EBIT margin of -7088.3% in 2025. Despite strong revenue growth of 80.89% in the latest year, profitability challenges persist with negative operating results.
Which one has the stronger fundamentals?
CCC Intelligent Solutions demonstrates stronger fundamentals, backed by sustained revenue and net income growth, favorable margins, and improved operating income in the most recent period. Arqit Quantum shows rapid revenue expansion but continues to struggle with large losses and negative margins, indicating more significant profitability risks despite some growth improvements.
Financial Ratios Comparison
The table below presents a side-by-side comparison of key financial ratios for CCC Intelligent Solutions Holdings Inc. (CCCS) and Arqit Quantum Inc. (ARQQ) based on their most recent fiscal year data.
| Ratios | CCC Intelligent Solutions Holdings Inc. (2024) | Arqit Quantum Inc. (2025) |
|---|---|---|
| ROE | 1.31% | -129.77% |
| ROIC | 1.86% | -127.45% |
| P/E | 274.02 | -15.12 |
| P/B | 3.59 | 19.62 |
| Current Ratio | 3.65 | 2.69 |
| Quick Ratio | 3.65 | 2.69 |
| D/E | 0.425 | 0.026 |
| Debt-to-Assets | 26.65% | 1.68% |
| Interest Coverage | 1.24 | -802.90 |
| Asset Turnover | 0.297 | 0.012 |
| Fixed Asset Turnover | 4.68 | 0.74 |
| Payout ratio | 0 | 0 |
| Dividend yield | 0 | 0 |
Interpretation of the Ratios
CCC Intelligent Solutions Holdings Inc.
CCC Intelligent Solutions shows mixed financial ratios with a strong current ratio of 3.65 indicating good short-term liquidity, but weak returns such as a return on equity of 1.31% and modest operating returns on assets. The company does not pay dividends, likely prioritizing reinvestment in R&D and growth, as indicated by high research and development expenses near 21% of revenue, without share buybacks.
Arqit Quantum Inc.
Arqit Quantum’s ratios are largely unfavorable, with a net margin of -6668.49% and return on equity at -129.77%, reflecting significant losses. However, liquidity ratios like current and quick ratios stand at 2.69, showing solid short-term solvency. The company pays no dividends, consistent with its negative earnings and focus on R&D and development typical of a high-growth technology firm.
Which one has the best ratios?
Comparing the two, CCC Intelligent Solutions presents relatively stronger liquidity and modest profitability, while Arqit Quantum suffers from severe negative returns and earnings despite good liquidity. Overall, CCC’s ratios are more balanced, whereas Arqit’s metrics reflect high risk and operational challenges.
Strategic Positioning
This section compares the strategic positioning of CCC Intelligent Solutions Holdings Inc. and Arqit Quantum Inc., including market position, key segments, and exposure to technological disruption:
CCC Intelligent Solutions Holdings Inc.
- Large market cap of 5.6B with moderate beta, operating in a competitive software infrastructure sector.
- Focuses on SaaS cloud, AI, telematics for insurance and automotive sectors, driven by software subscriptions and services.
- Digital insurance workflows and AI-enabled platforms indicate moderate exposure, leveraging cloud and AI technologies.
Arqit Quantum Inc.
- Smaller market cap of 416M with high beta, competing in cybersecurity software infrastructure in the UK.
- Provides quantum encryption cybersecurity via satellite and terrestrial platforms, targeting secure communications.
- Quantum encryption solutions position it in a highly specialized, potentially disruptive technological niche.
CCC Intelligent Solutions Holdings Inc. vs Arqit Quantum Inc. Positioning
CCC exhibits a diversified approach across insurance and automotive software ecosystems with strong recurring subscription revenue, while Arqit concentrates on quantum cybersecurity, a specialized and emerging technology sector with fewer employees and scale.
Which has the best competitive advantage?
Based on the MOAT evaluation, Arqit Quantum shows a slightly unfavorable moat with value destruction despite improving profitability, while CCC’s MOAT data is unavailable, preventing a definitive comparison of competitive advantages.
Stock Comparison
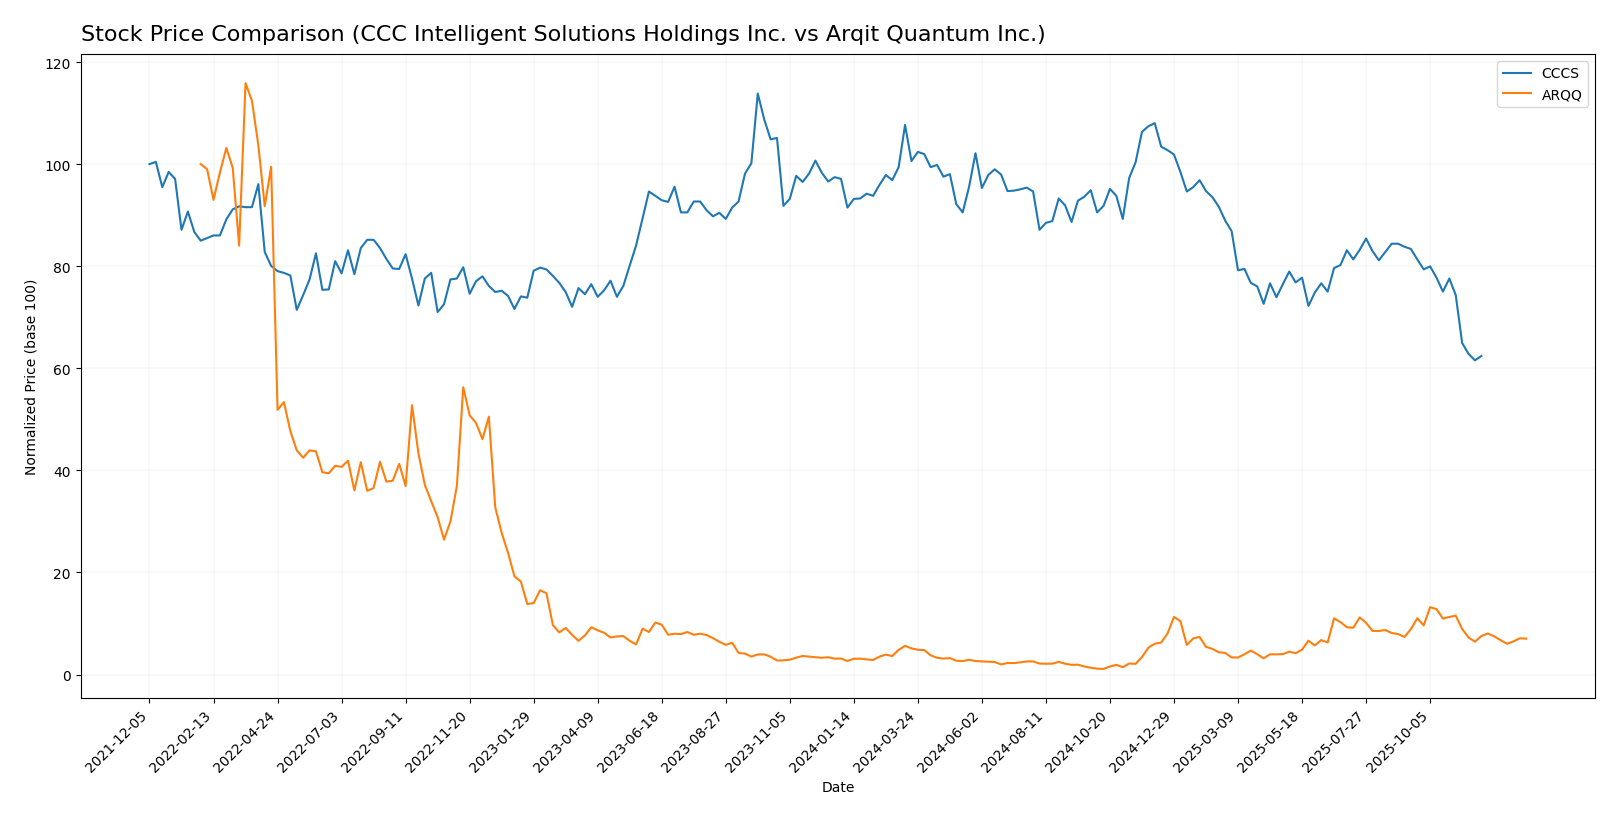
The stock price movement over the past 12 months shows a strong divergence between CCC Intelligent Solutions Holdings Inc. and Arqit Quantum Inc., with CCCS experiencing a sustained bearish trend and ARQQ demonstrating significant bullish gains before recent declines.
Trend Analysis
CCC Intelligent Solutions Holdings Inc. (CCCS) recorded a bearish trend over the past year with a -31.78% price change, showing deceleration and a standard deviation of 1.24. The stock moved between a high of 12.67 and a low of 7.22.
Arqit Quantum Inc. (ARQQ) exhibited a bullish trend over the same period with a 93.6% price increase, despite deceleration and high volatility (std deviation 11.75). Its price ranged from 4.19 to 49.92, but it faced a recent -39.03% correction.
Comparing both, ARQQ delivered the highest market performance with a substantial overall gain, while CCCS suffered notable losses, reflecting divergent investor sentiment and market dynamics.
Target Prices
The current analyst consensus presents a clear target outlook for these technology infrastructure companies.
| Company | Target High | Target Low | Consensus |
|---|---|---|---|
| CCC Intelligent Solutions Holdings Inc. | 11 | 11 | 11 |
| Arqit Quantum Inc. | 60 | 60 | 60 |
Analysts expect CCC Intelligent Solutions to reach $11, above its current $8.75 price, indicating moderate upside. Arqit Quantum’s target at $60 suggests significant growth potential compared to its current $26.60 market price.
Analyst Opinions Comparison
This section compares analysts’ ratings and grades for CCC Intelligent Solutions Holdings Inc. (CCCS) and Arqit Quantum Inc. (ARQQ):
Rating Comparison
CCCS Rating
- No rating available for CCCS.
- Discounted Cash Flow Score: Not available.
- ROE Score: Not available.
- ROA Score: Not available.
- Debt To Equity Score: Not available.
- Overall Score: Not available.
ARQQ Rating
- Rating: C, evaluated as Very Favorable overall.
- Discounted Cash Flow Score: 2, considered Moderate.
- Return on Equity Score: 1, rated Very Unfavorable.
- Return on Assets Score: 1, rated Very Unfavorable.
- Debt To Equity Score: 4, rated Favorable.
- Overall Score: 2, rated Moderate.
Which one is the best rated?
Based strictly on the provided data, ARQQ has a comprehensive rating with a C grade and multiple scores, while CCCS has no available ratings or scores. Therefore, ARQQ is better rated according to the available analyst evaluations.
Scores Comparison
This section presents a comparison of the Altman Z-Score and Piotroski Score for both companies:
CCC Scores
- Altman Z-Score: 2.18, indicating a grey zone with moderate bankruptcy risk.
- Piotroski Score: 3, categorized as very weak financial strength.
ARQQ Scores
- Altman Z-Score: -0.22, placing the company in the distress zone.
- Piotroski Score: 2, also considered very weak financial strength.
Which company has the best scores?
Based on the data, CCC has a higher Altman Z-Score in the grey zone versus ARQQ’s distress zone, and a slightly better Piotroski Score. Overall, CCC shows marginally stronger financial scores than ARQQ.
Grades Comparison
Here is a comparison of the available grades for CCC Intelligent Solutions Holdings Inc. and Arqit Quantum Inc.:
CCC Intelligent Solutions Holdings Inc. Grades
The consensus grades for CCC Intelligent Solutions Holdings Inc. are summarized below.
| Grading Company | Action | New Grade | Date |
|---|---|---|---|
| Consensus | Buy | Buy | N/A |
Overall, CCC Intelligent Solutions Holdings Inc. shows a consensus rating of “Buy” with no strong buy or sell recommendations, indicating moderate confidence from analysts.
Arqit Quantum Inc. Grades
Below are the grades assigned to Arqit Quantum Inc. by a verifiable grading company.
| Grading Company | Action | New Grade | Date |
|---|---|---|---|
| HC Wainwright & Co. | Maintain | Buy | 2025-10-13 |
| HC Wainwright & Co. | Maintain | Buy | 2025-09-18 |
| HC Wainwright & Co. | Maintain | Buy | 2024-12-31 |
| HC Wainwright & Co. | Maintain | Buy | 2024-12-06 |
| HC Wainwright & Co. | Maintain | Buy | 2024-07-11 |
| HC Wainwright & Co. | Maintain | Buy | 2024-05-29 |
| HC Wainwright & Co. | Maintain | Buy | 2024-05-15 |
| HC Wainwright & Co. | Maintain | Buy | 2023-11-22 |
| HC Wainwright & Co. | Maintain | Buy | 2023-09-27 |
| HC Wainwright & Co. | Maintain | Buy | 2023-09-26 |
Arqit Quantum Inc. has consistently maintained a “Buy” rating from HC Wainwright & Co. over multiple review dates, demonstrating stable analyst support.
Which company has the best grades?
Both companies have a consensus “Buy” rating, but Arqit Quantum Inc. benefits from repeated, consistent “Buy” ratings by a specific grading company. This sustained positive affirmation may provide investors with greater confidence in its outlook compared to CCC Intelligent Solutions Holdings Inc.’s broader but less detailed consensus.
Strengths and Weaknesses
Below is a comparison of key strengths and weaknesses for CCC Intelligent Solutions Holdings Inc. (CCCS) and Arqit Quantum Inc. (ARQQ) based on the most recent data.
| Criterion | CCC Intelligent Solutions Holdings Inc. (CCCS) | Arqit Quantum Inc. (ARQQ) |
|---|---|---|
| Diversification | Moderate: Revenue mainly from software subscriptions (over $900M in 2024) with smaller other services | Limited: Focused on quantum encryption technology, no product segmentation data available |
| Profitability | Data unavailable for assessment | Weak: Negative net margin (-6668%), ROE (-130%), and ROIC (-127%) in 2025 indicate losses |
| Innovation | Established software solutions, steady growth in subscriptions | High potential: Quantum technology is innovative but not yet profitable |
| Global presence | Likely moderate; no specific data | Emerging: Technology could have global applications but still early stage |
| Market Share | Significant in software subscription market segment | Small and developing market share in quantum encryption |
Key takeaways: CCC Intelligent Solutions shows solid revenue growth driven by software subscriptions but lacks detailed profitability data. Arqit Quantum exhibits strong innovation potential but is currently unprofitable with negative returns and value destruction, despite a improving ROIC trend. Investors should weigh CCCS’s stable growth against ARQQ’s high-risk, high-reward profile.
Risk Analysis
Below is a comparative risk table for CCC Intelligent Solutions Holdings Inc. (CCCS) and Arqit Quantum Inc. (ARQQ) based on the most recent data from 2025-2026.
| Metric | CCC Intelligent Solutions Holdings Inc. (CCCS) | Arqit Quantum Inc. (ARQQ) |
|---|---|---|
| Market Risk | Moderate (beta 0.72, stable tech sector) | High (beta 2.41, volatile tech) |
| Debt level | Data unavailable | Low (debt-to-equity 0.03, favorable) |
| Regulatory Risk | Moderate (insurance tech sector regulation) | Elevated (UK cybersecurity regulations) |
| Operational Risk | Moderate (scale and complexity of AI/telematics) | High (early-stage, limited employees) |
| Environmental Risk | Low (software industry) | Low (software industry) |
| Geopolitical Risk | Moderate (US-based, global exposure) | High (UK base, geopolitical uncertainty post-Brexit) |
The most impactful risks are Arqit’s high market volatility and financial distress, indicated by its Altman Z-Score in the distress zone and very weak Piotroski score, signaling bankruptcy risk. CCCS shows moderate market risk and financial health in a grey zone, but lacks detailed debt data. Investors should apply caution with ARQQ due to its financial instability and regulatory environment.
Which Stock to Choose?
CCC Intelligent Solutions Holdings Inc. (CCCS) shows a favorable income evolution with strong revenue and net income growth, supported by solid profitability margins. Its financial ratios indicate moderate debt levels and a stable current ratio, though some scores suggest caution. Rating data is unavailable.
Arqit Quantum Inc. (ARQQ) presents a mixed financial picture: despite impressive revenue growth, its profitability remains negative with several unfavorable financial ratios. The company holds low debt and a good current ratio but has a moderate overall rating with weaknesses in return and valuation metrics.
For investors prioritizing income stability and profitable growth, CCCS might appear more favorable given its consistent income statement improvements. Conversely, those with a higher risk tolerance focused on growth potential might see ARQQ’s dynamic revenue expansion and improving ROIC trend as indicative of possible future value creation.
Disclaimer: Investment carries a risk of loss of initial capital. The past performance is not a reliable indicator of future results. Be sure to understand risks before making an investment decision.
Go Further
I encourage you to read the complete analyses of CCC Intelligent Solutions Holdings Inc. and Arqit Quantum Inc. to enhance your investment decisions: