Block, Inc. and Arqit Quantum Inc. are two innovative companies operating in the software infrastructure industry, yet they focus on distinct niches—digital payments and quantum cybersecurity, respectively. Both firms pursue cutting-edge technology strategies to address evolving market demands, making them compelling choices for investors interested in tech-driven growth. In this article, I will analyze their strengths and risks to help you decide which company could be the most promising addition to your portfolio.

Table of contents
Companies Overview
I will begin the comparison between Block, Inc. and Arqit Quantum Inc. by providing an overview of these two companies and their main differences.
Block, Inc. Overview
Block, Inc. operates in the software infrastructure sector, providing tools that enable sellers to accept card payments along with reporting, analytics, and next-day settlement services. Its offerings include hardware such as card readers and payment terminals, as well as software solutions like point-of-sale systems, appointment scheduling, and online checkout. Founded in 2009 and based in Oakland, CA, Block serves markets including the US, Canada, Japan, and Europe.
Arqit Quantum Inc. Overview
Arqit Quantum Inc. is a UK-based cybersecurity company delivering services via satellite and terrestrial platforms. It offers QuantumCloud, a software agent that enables devices to create encryption keys in partnership with others. Operating with 82 employees, Arqit focuses on advanced encryption solutions to enhance security. The firm is listed on NASDAQ and headquartered in London, United Kingdom.
Key similarities and differences
Both companies belong to the technology sector and focus on software infrastructure, but their core business models differ significantly. Block, Inc. centers on payment processing and point-of-sale systems with a broad geographic reach and diversified hardware and software offerings. Arqit Quantum Inc. specializes in quantum encryption technology and cybersecurity, operating primarily in the UK with a smaller workforce and niche product line. Their market capitalizations and operational scales also contrast sharply.
Income Statement Comparison
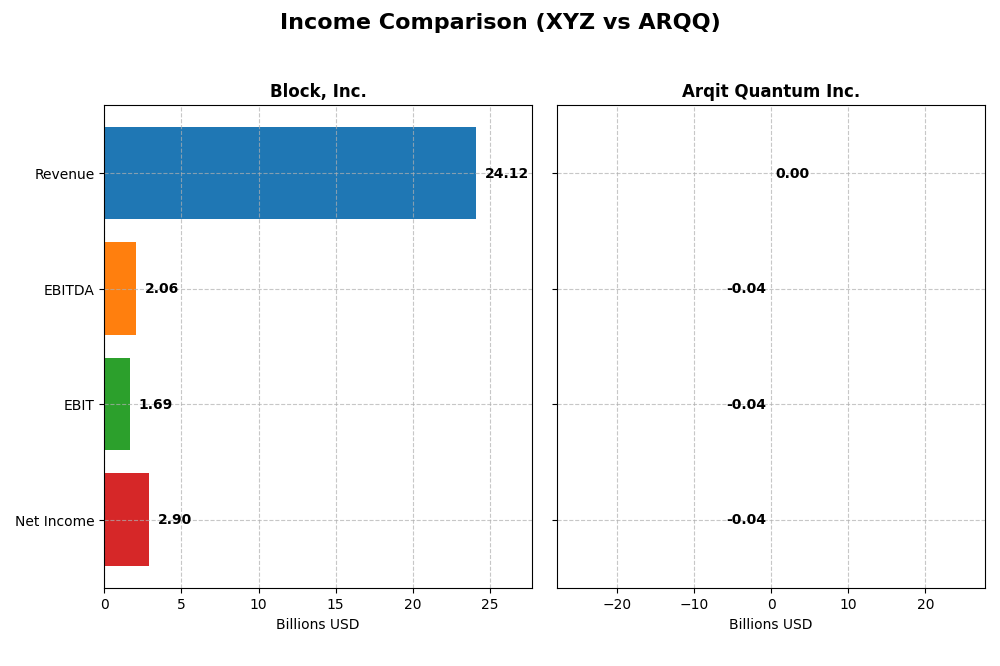
The table below compares key income statement metrics for Block, Inc. and Arqit Quantum Inc. based on their most recent fiscal year results.
| Metric | Block, Inc. (XYZ) | Arqit Quantum Inc. (ARQQ) |
|---|---|---|
| Market Cap | 40B | 416M |
| Revenue | 24.1B | 530K |
| EBITDA | 2.06B | -36.8M |
| EBIT | 1.69B | -37.6M |
| Net Income | 2.9B | -35.3M |
| EPS | 4.7 | -2.56 |
| Fiscal Year | 2024 | 2025 |
Income Statement Interpretations
Block, Inc.
Block, Inc. experienced strong revenue growth from 9.5B in 2020 to 24.1B in 2024, with net income rising from 213M to 2.9B over the same period. Gross margin remained favorable at 36.85%, while net margin improved to 12.01%. In 2024, the company showed solid profit growth and margin expansion, despite operating expenses growing alongside revenue.
Arqit Quantum Inc.
Arqit Quantum’s revenue grew sharply from 48K in 2021 to 530K in 2025, showing an overall favorable trend. However, the company faced negative gross and EBIT margins, with a gross margin of -43.4% and EBIT margin of -7088.3% in 2025. Despite some improvement in net margin and EPS growth recently, the company still reported substantial net losses in the latest year.
Which one has the stronger fundamentals?
Block, Inc. exhibits stronger fundamentals with consistent revenue and net income growth, favorable margins, and positive earnings per share trends. Arqit Quantum, while showing rapid revenue growth, struggles with significant losses and negative profitability metrics. Block’s financial stability contrasts with Arqit’s ongoing challenges to achieve sustained profitability.
Financial Ratios Comparison
The table below presents a side-by-side comparison of key financial ratios for Block, Inc. (XYZ) and Arqit Quantum Inc. (ARQQ) based on the most recent fiscal year data available.
| Ratios | Block, Inc. (XYZ) 2024 | Arqit Quantum Inc. (ARQQ) 2025 |
|---|---|---|
| ROE | 13.62% | -129.77% |
| ROIC | 3.03% | -127.45% |
| P/E | 18.10 | -15.12 |
| P/B | 2.47 | 19.62 |
| Current Ratio | 2.33 | 2.69 |
| Quick Ratio | 2.31 | 2.69 |
| D/E (Debt-to-Equity) | 0.37 | 0.03 |
| Debt-to-Assets | 21.53% | 1.68% |
| Interest Coverage | 95.93 | -802.90 |
| Asset Turnover | 0.66 | 0.01 |
| Fixed Asset Turnover | 45.14 | 0.74 |
| Payout Ratio | 0 | 0 |
| Dividend Yield | 0 | 0 |
Interpretation of the Ratios
Block, Inc.
Block, Inc. shows a balanced financial profile with favorable liquidity ratios such as a current ratio of 2.33 and a debt-to-equity of 0.37, indicating solid short-term financial health and moderate leverage. While net margin is favorable at 12.01%, return on invested capital (3.03%) and WACC (14.27%) are unfavorable, suggesting challenges in generating returns above its cost of capital. The company does not pay dividends, likely prioritizing reinvestment and growth given its zero dividend yield and absence of payout.
Arqit Quantum Inc.
Arqit Quantum’s financial ratios reveal significant weaknesses, with deeply negative profitability indicators including a net margin of -6668.49% and return on equity of -129.77%. Its liquidity appears strong, with a current ratio of 2.69 and low debt-to-equity at 0.03, but poor asset turnover and interest coverage reflect operational and financial inefficiencies. The company does not distribute dividends, consistent with its negative earnings and focus on development and expansion phases.
Which one has the best ratios?
Block, Inc. demonstrates a stronger and more stable financial position with favorable liquidity, moderate profitability, and manageable leverage, resulting in a slightly favorable overall evaluation. In contrast, Arqit Quantum faces pronounced financial difficulties with mostly unfavorable ratios, yielding an unfavorable evaluation. Thus, Block, Inc. has the more robust financial ratios between the two.
Strategic Positioning
This section compares the strategic positioning of Block, Inc. and Arqit Quantum Inc. regarding market position, key segments, and exposure to technological disruption:
Block, Inc.
- Large market cap of 40B USD in software infrastructure, facing high competitive pressure and volatility.
- Diverse revenue streams: software, cryptocurrency assets, hardware, and transaction services.
- Limited explicit exposure to tech disruption; innovates mainly in payment and financial software.
Arqit Quantum Inc.
- Small market cap of 416M USD, operating in a niche cybersecurity segment.
- Focused on cybersecurity via QuantumCloud software leveraging satellite tech.
- Positioned in quantum encryption, exposed to cutting-edge technological shifts.
Block, Inc. vs Arqit Quantum Inc. Positioning
Block operates a diversified business model spanning payments, software, and cryptocurrency, offering multiple revenue drivers. Arqit concentrates solely on quantum cybersecurity, benefiting from specialization but facing narrower market scope and scale.
Which has the best competitive advantage?
Both companies currently shed value with ROIC below WACC but show growing profitability trends. Their economic moats are slightly unfavorable, indicating limited sustainable competitive advantage based on recent capital efficiency data.
Stock Comparison
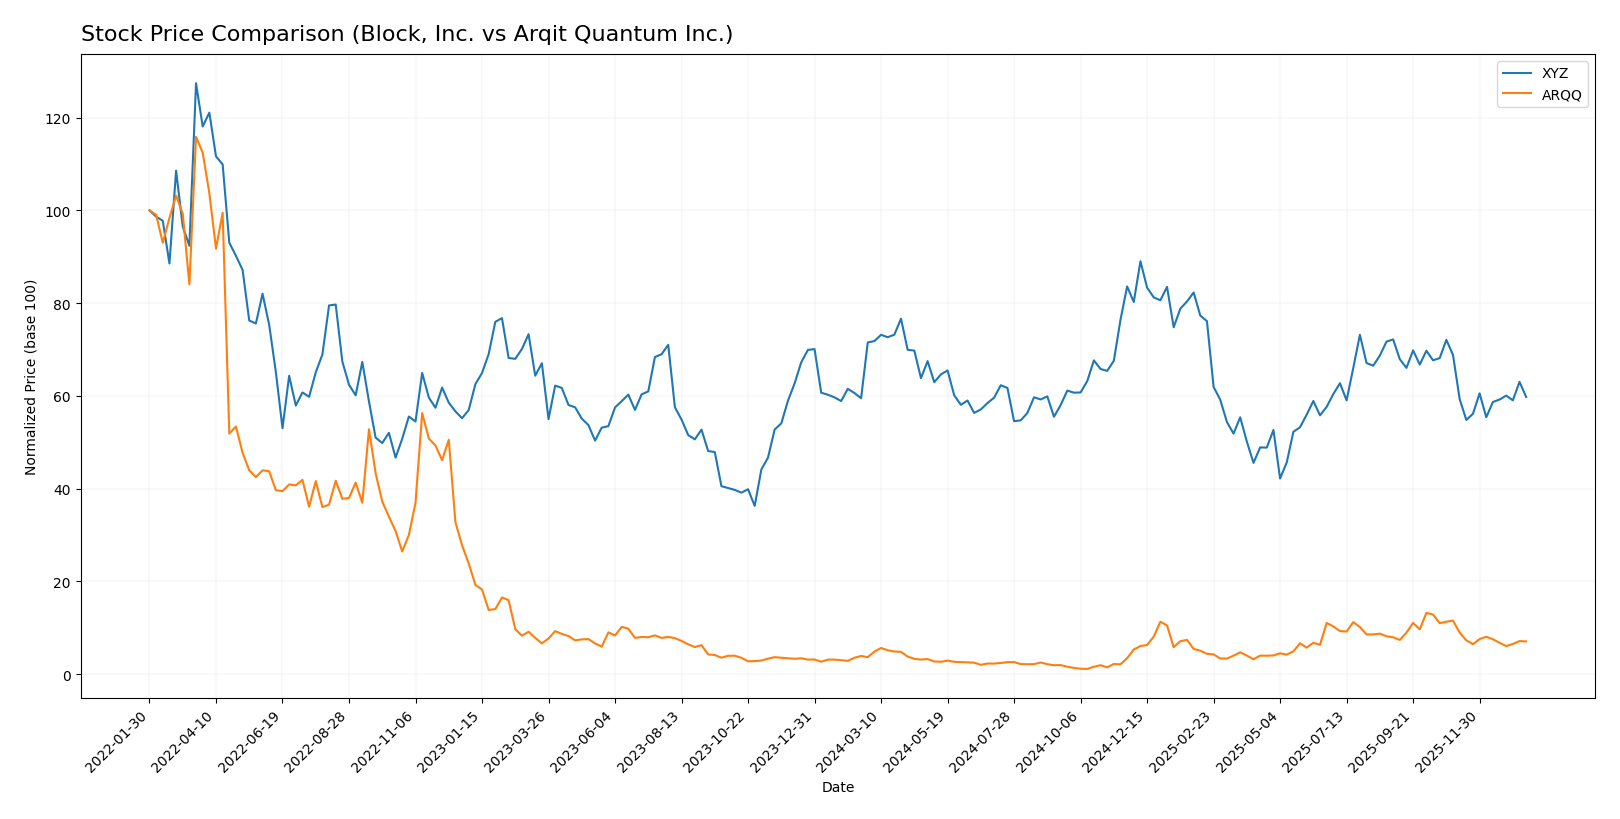
The stock price movements over the past year reveal contrasting dynamics, with Block, Inc. experiencing a sustained decline while Arqit Quantum Inc. showed strong gains before recent downturns affected both stocks’ momentum.
Trend Analysis
Block, Inc. (XYZ) shows a bearish trend over the past 12 months with a -16.43% price change, decelerating decline, and significant volatility (std dev 10.43). The stock ranged between 46.53 and 98.25.
Arqit Quantum Inc. (ARQQ) demonstrated a bullish trend over the same period, rising 93.6% with decelerating gains and higher volatility (std dev 11.75). Recent months, however, saw a sharp -39.03% drop.
Comparing trends, Arqit Quantum delivered the highest market performance with strong annual gains despite recent losses, while Block, Inc. showed a consistent bearish trajectory throughout the year.
Target Prices
The current analyst target consensus suggests potential upside for these technology infrastructure firms.
| Company | Target High | Target Low | Consensus |
|---|---|---|---|
| Block, Inc. | 100 | 65 | 84.91 |
| Arqit Quantum Inc. | 60 | 60 | 60 |
Analysts expect Block, Inc.’s stock to rise significantly above its current price of 65.95 USD, while Arqit Quantum Inc.’s consensus target is well above its present price of 26.6 USD, indicating strong upside potential.
Analyst Opinions Comparison
This section compares analysts’ ratings and key financial scores for Block, Inc. and Arqit Quantum Inc.:
Rating Comparison
Block, Inc. Rating
- Rating: B+ indicating a very favorable status.
- Discounted Cash Flow Score: 3, moderate value.
- ROE Score: 4, favorable efficiency in equity use.
- ROA Score: 4, favorable asset utilization.
- Debt To Equity Score: 2, moderate financial risk.
- Overall Score: 3, moderate overall financial standing.
Arqit Quantum Inc. Rating
- Rating: C reflecting a very unfavorable status.
- Discounted Cash Flow Score: 2, moderate value.
- ROE Score: 1, very unfavorable equity utilization.
- ROA Score: 1, very unfavorable asset utilization.
- Debt To Equity Score: 4, favorable low financial risk.
- Overall Score: 2, moderate overall financial standing.
Which one is the best rated?
Block, Inc. holds a better overall rating of B+ with favorable ROE and ROA scores, despite a moderate debt-to-equity score. Arqit Quantum Inc. has a lower overall rating of C, with weaker profitability metrics but a stronger debt-to-equity position.
Scores Comparison
The scores comparison between Block, Inc. and Arqit Quantum Inc. is as follows:
Block, Inc. Scores
- Altman Z-Score: 2.70, placing the company in the grey zone, indicating moderate bankruptcy risk.
- Piotroski Score: 6, classified as average financial strength.
Arqit Quantum Inc. Scores
- Altman Z-Score: -0.22, in the distress zone, indicating high bankruptcy risk.
- Piotroski Score: 2, indicating very weak financial strength.
Which company has the best scores?
Block, Inc. has higher Altman Z-Score and Piotroski Score values compared to Arqit Quantum Inc. Block is in the grey zone with average financial strength, while Arqit is in distress with very weak financial strength.
Grades Comparison
The following grades comparison outlines recent analyst ratings for Block, Inc. and Arqit Quantum Inc.:
Block, Inc. Grades
This table shows recent grades assigned to Block, Inc. by recognized grading firms.
| Grading Company | Action | New Grade | Date |
|---|---|---|---|
| Piper Sandler | Maintain | Underweight | 2026-01-14 |
| Keefe, Bruyette & Woods | Maintain | Outperform | 2026-01-02 |
| Needham | Maintain | Buy | 2025-11-24 |
| B of A Securities | Maintain | Buy | 2025-11-21 |
| Morgan Stanley | Maintain | Equal Weight | 2025-11-21 |
| BTIG | Maintain | Buy | 2025-11-20 |
| RBC Capital | Maintain | Outperform | 2025-11-20 |
| Stephens & Co. | Maintain | Overweight | 2025-11-20 |
| Mizuho | Maintain | Outperform | 2025-11-20 |
| BTIG | Maintain | Buy | 2025-11-14 |
Block, Inc. shows a predominantly positive outlook with multiple “Buy,” “Outperform,” and “Overweight” ratings, balanced by a single “Underweight” and an “Equal Weight.”
Arqit Quantum Inc. Grades
This table presents recent ratings from HC Wainwright & Co. for Arqit Quantum Inc.
| Grading Company | Action | New Grade | Date |
|---|---|---|---|
| HC Wainwright & Co. | Maintain | Buy | 2025-10-13 |
| HC Wainwright & Co. | Maintain | Buy | 2025-09-18 |
| HC Wainwright & Co. | Maintain | Buy | 2024-12-31 |
| HC Wainwright & Co. | Maintain | Buy | 2024-12-06 |
| HC Wainwright & Co. | Maintain | Buy | 2024-07-11 |
| HC Wainwright & Co. | Maintain | Buy | 2024-05-29 |
| HC Wainwright & Co. | Maintain | Buy | 2024-05-15 |
| HC Wainwright & Co. | Maintain | Buy | 2023-11-22 |
| HC Wainwright & Co. | Maintain | Buy | 2023-09-27 |
| HC Wainwright & Co. | Maintain | Buy | 2023-09-26 |
Arqit Quantum Inc. has consistently received “Buy” ratings from a single grading company, showing a stable positive sentiment without variation.
Which company has the best grades?
Block, Inc. has a broader range of grades from multiple respected grading firms, including several “Buy” and “Outperform” ratings, while Arqit Quantum Inc.’s grades come solely from HC Wainwright & Co. both consensus ratings indicate a “Buy.” This diversity in Block’s ratings may provide investors with a more nuanced perspective on risk and opportunity.
Strengths and Weaknesses
The table below summarizes the core strengths and weaknesses of Block, Inc. (XYZ) and Arqit Quantum Inc. (ARQQ) based on their latest financial and operational data.
| Criterion | Block, Inc. (XYZ) | Arqit Quantum Inc. (ARQQ) |
|---|---|---|
| Diversification | High: diverse revenue streams including Software & Data Products (7.16B), Cryptocurrency Assets (10.2B), Hardware, and Transactions | Low: primarily focused on quantum technologies with limited diversification |
| Profitability | Moderate: net margin 12.01%, ROE 13.62%, but ROIC 3.03% below WACC (14.27%) indicates value destruction | Low: strong losses, negative net margin (-6668%), negative ROE and ROIC, indicating significant value destruction |
| Innovation | Strong: consistent revenue growth in Software and Crypto products suggests ongoing innovation and market adaptation | Emerging: high R&D focus but currently unprofitable and struggling to convert innovation into returns |
| Global presence | Significant: operates globally with substantial cryptocurrency and transaction volumes | Limited: early-stage with less global market penetration |
| Market Share | Solid in fintech and crypto transaction segments | Minimal, niche quantum security market with early-stage adoption |
Key takeaways: Block, Inc. shows strong diversification and moderate profitability with improving ROIC trends, suggesting potential for value creation despite current challenges. Arqit Quantum Inc. remains an emerging player with high risks due to substantial losses and limited market presence, though its innovation trajectory is promising. Risk management favors cautious exposure to ARQQ and more confidence in XYZ’s growth potential.
Risk Analysis
Below is a comparison of key risks for Block, Inc. (XYZ) and Arqit Quantum Inc. (ARQQ) based on the most recent data from 2025-2026:
| Metric | Block, Inc. (XYZ) | Arqit Quantum Inc. (ARQQ) |
|---|---|---|
| Market Risk | High beta 2.665, volatile tech sector | High beta 2.407, niche quantum cybersecurity market |
| Debt level | Moderate debt-to-equity 0.37, favorable | Very low debt-to-equity 0.03, favorable |
| Regulatory Risk | Moderate, US and international payments regulations | High, UK and international cybersecurity compliance |
| Operational Risk | Moderate, scale and hardware/software integration | High, early-stage tech with limited employees (82) |
| Environmental Risk | Low, standard tech industry impact | Low, limited physical footprint |
| Geopolitical Risk | Moderate, exposure to multiple countries | High, sensitive quantum tech with geopolitical implications |
Block, Inc. faces typical market and regulatory risks of a large fintech player but maintains favorable debt levels and operational stability. Arqit Quantum is highly exposed to regulatory and geopolitical risks due to its advanced cybersecurity niche and UK base, alongside financial distress signals. The most impactful risks are Arqit’s financial instability and geopolitical sensitivity, while Block’s key risk lies in market volatility.
Which Stock to Choose?
Block, Inc. (XYZ) shows a favorable income evolution with a 10.06% revenue growth in 2024 and a strong net margin of 12.01%. Financial ratios are slightly favorable overall, with solid debt management and liquidity. Profitability is moderate with ROE at 13.62%, but ROIC is below WACC, indicating value destruction despite improving trends. The rating is very favorable with a B+ grade.
Arqit Quantum Inc. (ARQQ) exhibits high revenue growth of 80.89% in 2025 but suffers from severe profitability issues, with deeply negative net margin and ROE. Financial ratios are mostly unfavorable except for strong liquidity and low debt. The company is also shedding value though profitability shows signs of improvement. Its rating is lower, with a C grade reflecting these challenges.
For investors focused on stability and moderate profitability, Block, Inc. might appear more favorable due to its stronger rating and income quality. Conversely, risk-tolerant investors seeking aggressive growth potential could consider Arqit Quantum, though its unfavorable financial ratios and value destruction signal higher risk. The choice may thus depend on one’s risk appetite and investment strategy.
Disclaimer: Investment carries a risk of loss of initial capital. The past performance is not a reliable indicator of future results. Be sure to understand risks before making an investment decision.
Go Further
I encourage you to read the complete analyses of Block, Inc. and Arqit Quantum Inc. to enhance your investment decisions: