In the fast-evolving semiconductor industry, Arm Holdings plc and Tower Semiconductor Ltd. stand out as key players driving innovation and market growth. Arm focuses on designing cutting-edge CPU architectures and intellectual property, while Tower specializes in analog mixed-signal manufacturing and foundry services. Both companies address critical technology markets, making them compelling candidates for investors seeking exposure to semiconductor advancements. This article will help you determine which company holds the most promising investment potential.
Table of contents
Companies Overview
I will begin the comparison between Arm Holdings plc American Depositary Shares and Tower Semiconductor Ltd. by providing an overview of these two companies and their main differences.
Arm Holdings plc Overview
Arm Holdings plc designs and licenses central processing unit products and related technologies for semiconductor companies and original equipment manufacturers. Its offerings include microprocessors, systems IPs, graphics processing units, and software tools used across automotive, computing infrastructure, consumer technologies, and IoT markets. Headquartered in Cambridge, UK, Arm operates globally, including in the US, China, and Taiwan, with a market cap of approximately 111B USD.
Tower Semiconductor Ltd. Overview
Tower Semiconductor Ltd. is an independent semiconductor foundry specializing in analog intensive mixed-signal devices and customizable process technologies like SiGe, BiCMOS, RF CMOS, and MEMS. Serving markets such as consumer electronics, automotive, aerospace, and medical devices, Tower operates primarily in the US, Japan, Asia, and Europe. The Israel-based company has a market cap near 13.9B USD and offers wafer fabrication and design enablement services.
Key similarities and differences
Both companies operate in the semiconductor industry, serving diverse technology markets including automotive and consumer electronics. Arm focuses on architecture, licensing, and intellectual property for CPUs and related technologies, while Tower is a foundry concentrating on manufacturing analog and mixed-signal devices with extensive process technology options. Arm’s business model centers on licensing, whereas Tower’s is manufacturing and fabrication services.
Income Statement Comparison
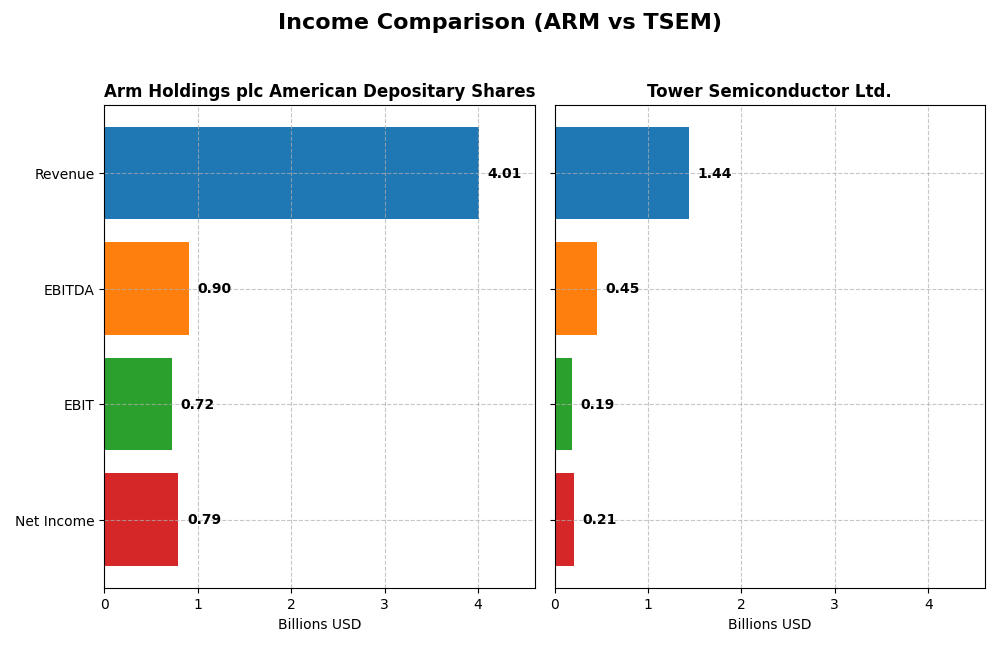
This table presents a side-by-side comparison of key income statement metrics for Arm Holdings plc American Depositary Shares (ARM) and Tower Semiconductor Ltd. (TSEM) for their most recent fiscal years.
| Metric | Arm Holdings plc American Depositary Shares (ARM) | Tower Semiconductor Ltd. (TSEM) |
|---|---|---|
| Market Cap | 111B | 13.9B |
| Revenue | 4.01B | 1.44B |
| EBITDA | 903M | 451M |
| EBIT | 720M | 185M |
| Net Income | 792M | 208M |
| EPS | 0.75 | 1.87 |
| Fiscal Year | 2025 | 2024 |
Income Statement Interpretations
Arm Holdings plc American Depositary Shares
Arm Holdings showed robust revenue growth from $2.03B in 2021 to $4.01B in 2025, nearly doubling over five years. Net income improved from $388M to $792M, with net margins rising slightly to 19.77%. The 2025 fiscal year displayed favorable growth acceleration, with revenue up 23.9% and EBIT soaring 239.6%, reflecting improved operational efficiency and strong margin stability.
Tower Semiconductor Ltd.
Tower Semiconductor’s revenue increased modestly from $1.27B in 2020 to $1.44B in 2024, a 13.5% rise over the period, while net income grew substantially from $82M to $208M. Margins remain stable but lower than Arm’s, with net margin at 14.47%. The latest year showed a slight revenue increase of 0.94% but marked declines in EBIT and net margin growth, indicating some recent operational challenges.
Which one has the stronger fundamentals?
Arm Holdings demonstrates stronger fundamentals with significantly higher revenue and net income growth and superior margins, including a gross margin near 95% and consistent EBIT and net margin expansion. Tower Semiconductor, despite solid net income growth over the longer term, faces recent margin compression and slower revenue growth. Overall, Arm’s income statement reflects more favorable and sustained financial performance.
Financial Ratios Comparison
Below is a table comparing key financial ratios for Arm Holdings plc (ARM) and Tower Semiconductor Ltd. (TSEM) based on their most recent fiscal year data.
| Ratios | Arm Holdings plc (2025) | Tower Semiconductor Ltd. (2024) |
|---|---|---|
| ROE | 11.58% | 7.83% |
| ROIC | 10.28% | 6.41% |
| P/E | 141.58 | 27.54 |
| P/B | 16.40 | 2.16 |
| Current Ratio | 5.20 | 6.18 |
| Quick Ratio | 5.20 | 5.23 |
| D/E | 0.05 | 0.07 |
| Debt-to-Assets | 3.99% | 5.87% |
| Interest Coverage | 0 | 32.64 |
| Asset Turnover | 0.45 | 0.47 |
| Fixed Asset Turnover | 5.61 | 1.11 |
| Payout Ratio | 0 | 0 |
| Dividend Yield | 0% | 0% |
Interpretation of the Ratios
Arm Holdings plc American Depositary Shares
Arm Holdings shows mixed financial ratios with 42.86% favorable and 50% unfavorable. Key strengths include a strong quick ratio of 5.2, low debt-to-equity of 0.05, and infinite interest coverage. Concerns arise from high valuation multiples (PE 141.58, PB 16.4) and weak asset turnover (0.45). The company does not pay dividends, likely focusing on reinvestment and growth.
Tower Semiconductor Ltd.
Tower Semiconductor presents a more balanced ratio profile with 42.86% favorable and 35.71% unfavorable. It benefits from a very strong interest coverage ratio of 31.57 and a low debt-to-equity ratio of 0.07, though its net margin of 14.47% is slightly lower than Arm’s. Tower also does not pay dividends, possibly prioritizing reinvestment and operational expansion.
Which one has the best ratios?
Tower Semiconductor’s ratios are slightly more favorable overall, with better coverage and lower risk indicators compared to Arm’s high valuation multiples and weaker asset turnover. However, both companies share some strengths and weaknesses, and their ratio profiles reflect different strategic focuses and market valuations.
Strategic Positioning
This section compares the strategic positioning of Arm Holdings plc and Tower Semiconductor Ltd., including Market position, Key segments, and Exposure to technological disruption:
Arm Holdings plc American Depositary Shares
- Leading semiconductor IP provider with high market cap; faces strong competitive pressure in licensing and royalty sectors.
- Focuses on licensing CPU architectures, graphics IP, and related technologies for diverse markets like automotive and IoT.
- High exposure to rapid innovation in semiconductor architectures and IP licensing models, critical for technology evolution.
Tower Semiconductor Ltd.
- Independent foundry with smaller market cap; competes in analog mixed-signal semiconductor manufacturing amid moderate pressure.
- Specializes in analog-intensive mixed-signal devices and wafer fabrication services across automotive, industrial, and aerospace sectors.
- Exposure centered on analog and mixed-signal process technologies requiring continuous manufacturing advancements.
Arm Holdings plc vs Tower Semiconductor Ltd. Positioning
Arm’s approach centers on diversified IP licensing across multiple end markets, yielding broad exposure but high competitive intensity. Tower concentrates on foundry services and analog semiconductors, benefiting from customization but with narrower market scope and lower scale.
Which has the best competitive advantage?
Both companies are shedding value, with Arm’s ROIC significantly below WACC and stable profitability, while Tower shows growing ROIC yet remains slightly unfavorable, indicating Tower’s improving but still challenged competitive advantage.
Stock Comparison
The stock price movements over the past 12 months reveal a stark contrast in trading dynamics, with Arm Holdings showing a significant decline while Tower Semiconductor demonstrates strong growth and accelerating momentum.

Trend Analysis
Arm Holdings plc American Depositary Shares experienced a bearish trend over the past year, with a 21.17% price decline and decelerating negative momentum. The stock fluctuated between a high of 181.19 and a low of 87.19, exhibiting notable volatility with a standard deviation of 19.31.
Tower Semiconductor Ltd. posted a bullish trend, gaining 272.71% over the same period with accelerating upward momentum. The stock price ranged from 29.65 to 124.0, showing higher volatility at 23.67 standard deviation and a strong recent positive slope.
Comparing the two, Tower Semiconductor delivered the highest market performance with robust gains and buyer dominance, whereas Arm Holdings declined markedly, reflecting divergent investor sentiment and market positioning.
Target Prices
The current analyst consensus for target prices indicates significant upside potential for both Arm Holdings plc and Tower Semiconductor Ltd.
| Company | Target High | Target Low | Consensus |
|---|---|---|---|
| Arm Holdings plc American Depositary Shares | 210 | 120 | 166 |
| Tower Semiconductor Ltd. | 125 | 66 | 96 |
Analysts expect Arm Holdings’ stock price to nearly double from the current 105.11 USD consensus, while Tower Semiconductor’s 124 USD market price is close to its target high, indicating limited upside.
Analyst Opinions Comparison
This section compares analysts’ ratings and grades for Arm Holdings plc American Depositary Shares (ARM) and Tower Semiconductor Ltd. (TSEM):
Rating Comparison
ARM Rating
- Rating: B, classified as Very Favorable by analysts.
- Discounted Cash Flow Score: 3, indicating a Moderate valuation.
- ROE Score: 3, reflecting Moderate efficiency in profit generation.
- ROA Score: 4, showing Favorable asset utilization.
- Debt To Equity Score: 4, indicating a Favorable financial risk profile.
- Overall Score: 3, considered Moderate in overall financial standing.
TSEM Rating
- Rating: B+, classified as Very Favorable by analysts.
- Discounted Cash Flow Score: 3, indicating a Moderate valuation.
- ROE Score: 3, reflecting Moderate efficiency in profit generation.
- ROA Score: 4, showing Favorable asset utilization.
- Debt To Equity Score: 4, indicating a Favorable financial risk profile.
- Overall Score: 3, considered Moderate in overall financial standing.
Which one is the best rated?
Based strictly on the provided data, TSEM holds a slightly higher rating of B+ compared to ARM’s B, while both companies share identical scores across key financial metrics, reflecting similar analyst views on their financial profiles.
Scores Comparison
The following table presents a comparison of the Altman Z-Score and Piotroski Score for Arm Holdings plc and Tower Semiconductor Ltd:
Arm Holdings plc Scores
- Altman Z-Score: 32.43, indicating a safe zone.
- Piotroski Score: 7, reflecting strong financial health.
Tower Semiconductor Ltd. Scores
- Altman Z-Score: 21.06, indicating a safe zone.
- Piotroski Score: 7, reflecting strong financial health.
Which company has the best scores?
Both Arm Holdings plc and Tower Semiconductor Ltd. have Altman Z-Scores well within the safe zone, indicating low bankruptcy risk. Their Piotroski Scores are equal at 7, showing strong financial health for both companies.
Grades Comparison
Here is a detailed comparison of the latest grades assigned to Arm Holdings plc American Depositary Shares and Tower Semiconductor Ltd.:
Arm Holdings plc American Depositary Shares Grades
The following table presents recent grades from reputable grading companies for Arm Holdings plc ADS:
| Grading Company | Action | New Grade | Date |
|---|---|---|---|
| B of A Securities | Downgrade | Neutral | 2026-01-13 |
| B of A Securities | Maintain | Buy | 2025-12-16 |
| Goldman Sachs | Downgrade | Sell | 2025-12-15 |
| Loop Capital | Maintain | Buy | 2025-11-12 |
| TD Cowen | Maintain | Buy | 2025-11-06 |
| Rosenblatt | Maintain | Buy | 2025-11-06 |
| Wells Fargo | Maintain | Overweight | 2025-11-06 |
| Mizuho | Maintain | Outperform | 2025-11-06 |
| Barclays | Maintain | Overweight | 2025-11-06 |
| UBS | Maintain | Buy | 2025-11-06 |
Most grades for Arm Holdings are Buy or equivalent positive ratings, with a recent downgrade from Buy to Neutral and a Sell rating from Goldman Sachs, indicating some caution.
Tower Semiconductor Ltd. Grades
Below is a summary table of recent grades from recognized grading firms for Tower Semiconductor Ltd.:
| Grading Company | Action | New Grade | Date |
|---|---|---|---|
| Benchmark | Maintain | Buy | 2026-01-09 |
| Wedbush | Downgrade | Neutral | 2025-12-31 |
| Benchmark | Maintain | Buy | 2025-11-11 |
| Susquehanna | Maintain | Positive | 2025-11-11 |
| Wedbush | Maintain | Outperform | 2025-11-11 |
| Barclays | Maintain | Equal Weight | 2025-11-11 |
| Benchmark | Maintain | Buy | 2025-09-08 |
| Susquehanna | Maintain | Positive | 2025-08-05 |
| Benchmark | Maintain | Buy | 2025-08-05 |
| Benchmark | Maintain | Buy | 2025-08-04 |
Tower Semiconductor’s grades are predominantly Buy or equivalent, with a recent downgrade from Outperform to Neutral by Wedbush, reflecting some moderation in outlook.
Which company has the best grades?
Both companies have an overall consensus rating of Buy, but Arm Holdings shows a slightly broader range of positive ratings including Outperform and Overweight from several firms. Tower Semiconductor’s grades are more consistently Buy or Positive, with fewer high-end ratings. This suggests Arm may have more varied analyst sentiment, which could impact investor expectations differently.
Strengths and Weaknesses
Below is a comparative overview of Arm Holdings plc (ARM) and Tower Semiconductor Ltd. (TSEM) based on key criteria relevant to investors.
| Criterion | Arm Holdings plc (ARM) | Tower Semiconductor Ltd. (TSEM) |
|---|---|---|
| Diversification | Medium – Primarily semiconductor IP licensing and royalties | Medium – Focused on semiconductor manufacturing |
| Profitability | Strong net margin (19.77%) but value destroying (ROIC < WACC) | Moderate net margin (14.47%) with improving profitability (growing ROIC) |
| Innovation | High – Leading semiconductor IP innovator | Moderate – Focus on niche manufacturing processes |
| Global presence | Extensive – Licensing globally across multiple markets | Moderate – Global manufacturing footprint |
| Market Share | Significant in semiconductor IP licensing | Smaller share in specialty semiconductor manufacturing |
Key takeaways: ARM excels in innovation and global licensing reach but currently destroys value with ROIC below WACC. TSEM shows improving profitability and solid financial health but has a smaller market footprint. Both require cautious evaluation with respect to long-term value creation.
Risk Analysis
Below is a comparative table of key risks associated with Arm Holdings plc (ARM) and Tower Semiconductor Ltd. (TSEM) based on the most recent data from 2025 and 2024 respectively:
| Metric | Arm Holdings plc (ARM) | Tower Semiconductor Ltd. (TSEM) |
|---|---|---|
| Market Risk | High beta of 4.36 indicates high volatility and market sensitivity. | Moderate beta of 0.88 suggests lower market volatility. |
| Debt level | Very low debt-to-equity ratio of 0.05, indicating strong balance sheet. | Low debt-to-equity ratio of 0.07, financially stable but slightly higher leverage. |
| Regulatory Risk | Operating globally including China and Taiwan; exposed to complex tech export regulations. | Global operations with exposure to international trade policies, especially in Israel and Asia. |
| Operational Risk | Relies heavily on licensing and IP management, risks in tech innovation cycles. | Foundry manufacturing risks including capacity and technology upgrades. |
| Environmental Risk | Moderate due to semiconductor manufacturing impact; no specific red flags reported. | Similar environmental footprint with regulatory compliance needed. |
| Geopolitical Risk | Exposure to UK, US, China, Taiwan tensions could disrupt supply chains. | Israeli base with exposure to Middle East geopolitical instability and global trade tensions. |
Synthesis: The most impactful risks for ARM are its high market volatility and geopolitical exposure, especially with its significant presence in politically sensitive regions. TSEM shows moderate market risk but faces notable geopolitical risks due to its Israeli headquarters. Both companies maintain low debt levels, which is favorable for financial stability, but investors should monitor evolving regulatory and operational risks in the semiconductor sector.
Which Stock to Choose?
Arm Holdings plc American Depositary Shares (ARM) shows a strong income evolution with a 23.94% revenue growth in the last year and a favorable global income statement evaluation. Its financial ratios are mixed, with 42.86% favorable and 50% unfavorable, indicating slight challenges. ARM’s profitability is moderate with an 11.58% ROE and low debt levels. The company’s rating is very favorable, classified as B, supported by a strong Altman Z-Score of 32.4 and a Piotroski score of 7, though ROIC is below WACC, signaling value destruction.
Tower Semiconductor Ltd. (TSEM) presents a moderate income evolution with a 0.94% revenue growth last year but overall favorable income performance. Its financial ratios are slightly more favorable, at 42.86% favorable and 35.71% unfavorable, with a slightly favorable global opinion. Profitability is lower than ARM’s, with a 7.83% ROE, but debt remains low. TSEM holds a very favorable B+ rating, a safe Altman Z-Score of 21.1, and a Piotroski score of 7. Despite ROIC below WACC, the company shows improving profitability.
Investors focusing on growth might find ARM’s strong income growth and profitability appealing, while those prioritizing slightly better financial ratios and improving profitability trends could consider TSEM. The ratings and MOAT evaluations imply both companies face value creation challenges but differ in growth dynamics and financial stability, suggesting the choice could depend on one’s risk tolerance and investment strategy.
Disclaimer: Investment carries a risk of loss of initial capital. The past performance is not a reliable indicator of future results. Be sure to understand risks before making an investment decision.
Go Further
I encourage you to read the complete analyses of Arm Holdings plc American Depositary Shares and Tower Semiconductor Ltd. to enhance your investment decisions: