Home > Comparison > Technology > TXN vs ARM
The strategic rivalry between Texas Instruments and Arm Holdings defines the current trajectory of the semiconductor sector. Texas Instruments operates as a capital-intensive manufacturer specializing in analog and embedded processing products, while Arm Holdings excels as a high-margin licensor of CPU architecture and related IP. This head-to-head pits hardware production against intellectual property innovation. This analysis will determine which corporate model offers a superior risk-adjusted return for diversified portfolios in the evolving technology landscape.
Table of contents
Companies Overview
Texas Instruments and Arm Holdings each command significant roles in the semiconductor industry, shaping global technology trends.
Texas Instruments Incorporated: Analog and Embedded Powerhouse
Texas Instruments dominates as a semiconductor manufacturer specializing in analog and embedded processing chips. Its revenue stems primarily from power management and signal processing products used across industrial, automotive, and consumer electronics. In 2026, TXN focuses strategically on enhancing its analog portfolio and embedded systems to address growing demand for energy-efficient and connected devices.
Arm Holdings plc American Depositary Shares: Chip Architecture Leader
Arm Holdings leads as a semiconductor IP licensor, designing CPUs and related technologies that other chipmakers integrate. It generates revenue by licensing microprocessor designs and development tools essential for smartphones, IoT, and automotive sectors. Arm’s 2026 strategy centers on expanding its intellectual property footprint in computing infrastructure and emerging markets worldwide.
Strategic Collision: Similarities & Divergences
Texas Instruments pursues a product manufacturing model, while Arm leverages a licensing ecosystem. Their battlefront lies in supplying the building blocks for connected devices and automotive applications. TXN offers tangible components, Arm delivers chip blueprints. Investors face contrasting profiles: TXN’s stable manufacturing cash flow versus Arm’s high-growth licensing leverage.
Income Statement Comparison
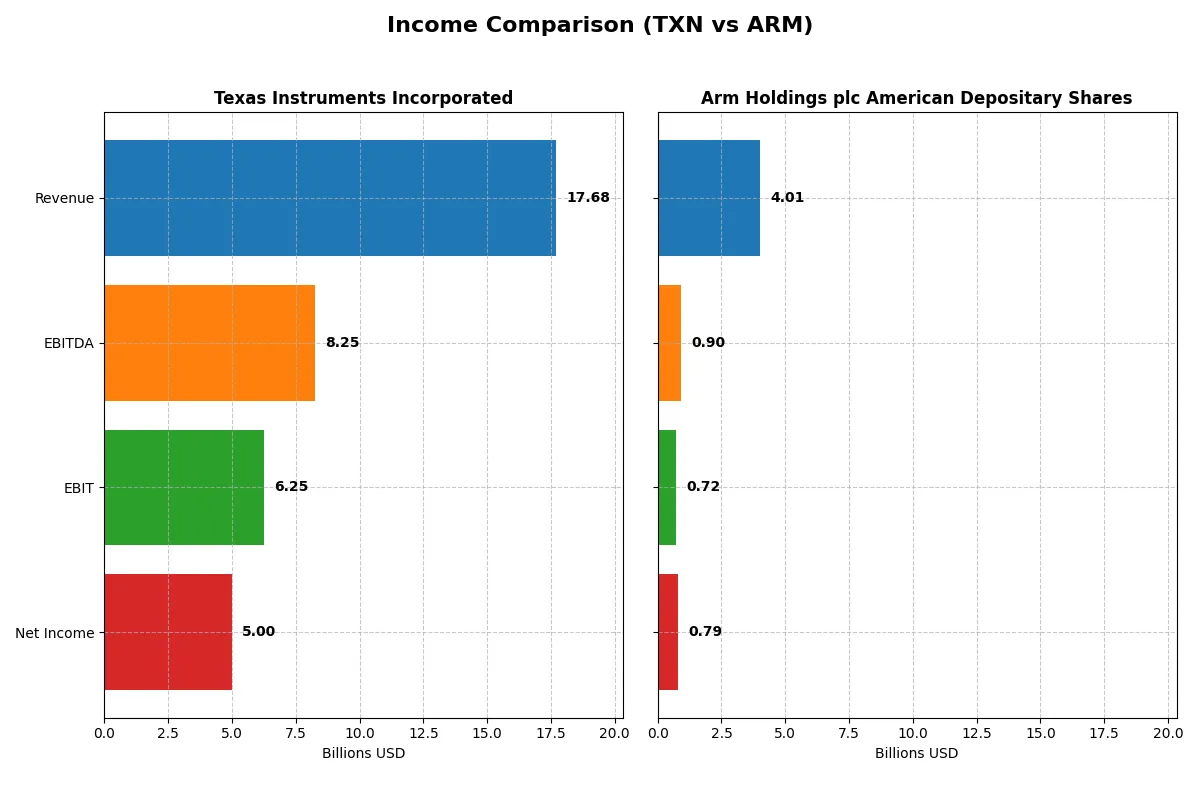
This data dissects the core profitability and scalability of both corporate engines to reveal who dominates the bottom line:
| Metric | Texas Instruments Incorporated (TXN) | Arm Holdings plc American Depositary Shares (ARM) |
|---|---|---|
| Revenue | 17.7B | 4.0B |
| Cost of Revenue | 7.6B | 206M |
| Operating Expenses | 4.1B | 3.0B |
| Gross Profit | 10.1B | 3.8B |
| EBITDA | 8.3B | 903M |
| EBIT | 6.3B | 720M |
| Interest Expense | 543M | 0 |
| Net Income | 5.0B | 792M |
| EPS | 5.45 | 0.75 |
| Fiscal Year | 2025 | 2025 |
Income Statement Analysis: The Bottom-Line Duel
This income statement comparison reveals which company operates its corporate engine with greater efficiency and growth momentum.
Texas Instruments Incorporated Analysis
Texas Instruments shows fluctuating revenue, peaking at $20B in 2022 before settling around $17.7B in 2025. Net income declined from $8.7B in 2022 to $5B in 2025, signaling margin pressure. Despite a strong gross margin of 57%, net margin slipped to 28%, reflecting rising expenses and a slight drop in profit efficiency.
Arm Holdings plc American Depositary Shares Analysis
Arm Holdings rapidly expanded revenue from $2B in 2021 to $4B in 2025, nearly doubling overall. Net income surged from $388M to $792M, supported by a robust 95% gross margin and improving net margin near 20%. Operating leverage bolstered EBIT growth by 240% year-over-year, highlighting accelerating profitability and operational momentum.
Margin Strength vs. Growth Velocity
Texas Instruments delivers stronger absolute profits and solid margins but faces declining net income and margin compression. Arm commands superior growth rates and expanding profitability with exceptional gross margins but from a smaller base. For investors, Arm offers dynamic growth potential, while Texas Instruments presents entrenched scale and margin resilience.
Financial Ratios Comparison
These vital ratios act as a diagnostic tool to expose the underlying fiscal health, valuation premiums, and capital efficiency of the companies compared below:
| Ratios | Texas Instruments (TXN) | Arm Holdings (ARM) |
|---|---|---|
| ROE | 30.7% | 11.6% |
| ROIC | 16.5% | 10.3% |
| P/E | 31.5 | 141.6 |
| P/B | 9.7 | 16.4 |
| Current Ratio | 4.35 | 5.20 |
| Quick Ratio | 2.83 | 5.20 |
| D/E | 0.86 | 0.05 |
| Debt-to-Assets | 40.6% | 4.0% |
| Interest Coverage | 11.1 | 0 |
| Asset Turnover | 0.51 | 0.45 |
| Fixed Asset Turnover | 1.44 | 5.61 |
| Payout ratio | 100% | 0% |
| Dividend yield | 3.17% | 0% |
| Fiscal Year | 2025 | 2025 |
Efficiency & Valuation Duel: The Vital Signs
Financial ratios serve as a company’s DNA, exposing hidden risks and highlighting operational excellence through measurable performance indicators.
Texas Instruments Incorporated
Texas Instruments demonstrates robust profitability, with a 30.7% ROE and a strong 28.3% net margin, signaling operational efficiency. The stock trades at a stretched P/E of 31.5 and a high P/B of 9.7, reflecting premium valuation. Shareholders receive a favorable 3.17% dividend yield, indicating steady returns alongside focused R&D investments.
Arm Holdings plc American Depositary Shares
Arm’s profitability is moderate, with an 11.6% ROE and a 19.8% net margin, showing decent operational metrics. The valuation appears highly stretched, with a P/E soaring at 141.6 and P/B at 16.4. The company returns no dividends, prioritizing capital allocation toward growth and heavy R&D spending, evident from a 50.1% R&D-to-revenue ratio.
Premium Valuation vs. Operational Safety
Texas Instruments balances superior profitability with shareholder returns despite a high valuation. Arm’s steep multiples and weaker returns reflect growth ambitions but higher risk. Investors seeking operational safety and income may prefer Texas Instruments, while growth-focused profiles might consider Arm’s potential trade-offs.
Which one offers the Superior Shareholder Reward?
I see Texas Instruments (TXN) delivers steady dividends with a 3.17% yield in 2025, nearly fully covered by free cash flow. Its payout ratio hovers around 100%, signaling strong commitment but limited growth flexibility. TXN also executes consistent buybacks, boosting total shareholder return. Arm Holdings (ARM) pays no dividends, focusing on reinvestment for growth, shown by its high gross margins and low payout. ARM’s buyback activity is minimal, reflecting capital allocation towards R&D and expansion. Considering sustainability and income, I favor TXN for reliable total returns in 2026. ARM offers growth potential but lacks immediate shareholder rewards.
Comparative Score Analysis: The Strategic Profile
The radar chart reveals the fundamental DNA and trade-offs of Texas Instruments and Arm Holdings, highlighting their operational and valuation strengths:
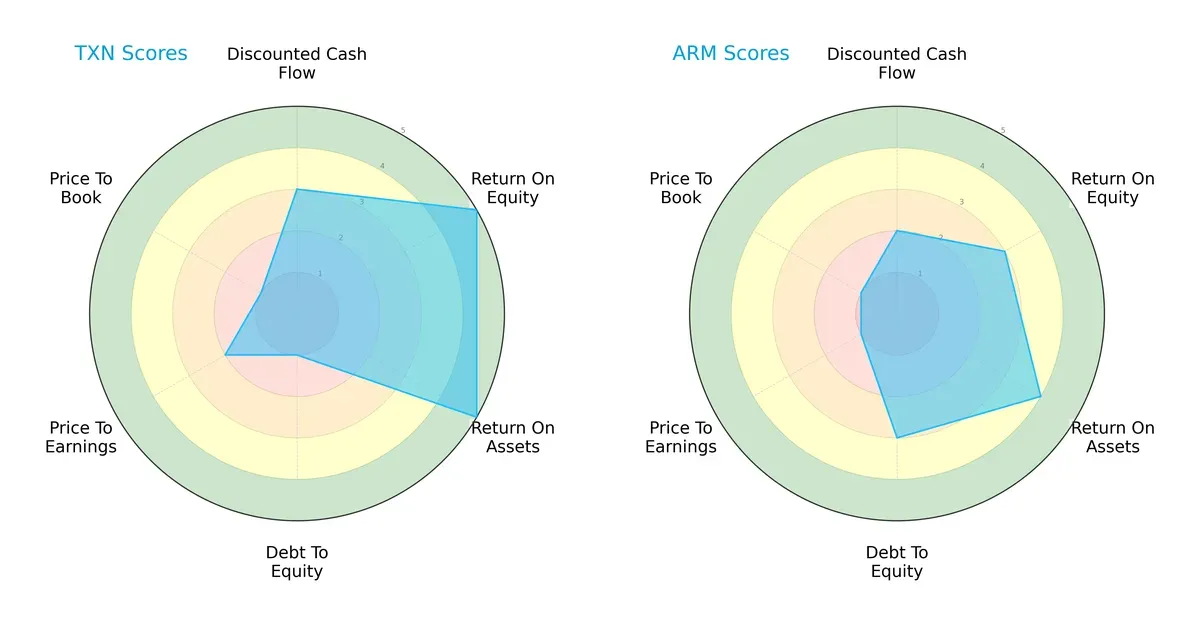
Texas Instruments dominates in profitability metrics, scoring very favorable 5s in ROE and ROA, compared to Arm’s moderate 3 and favorable 4. However, Texas Instruments carries significant financial risk with a very unfavorable 1 in debt-to-equity, while Arm manages a moderate 3 there. Valuation scores are weak for both, but Texas Instruments fares slightly better in P/E at 2 versus Arm’s very unfavorable 1. Overall, Texas Instruments shows a profit-driven profile leveraged by operational efficiency, whereas Arm relies more on balanced leverage and moderate asset returns.
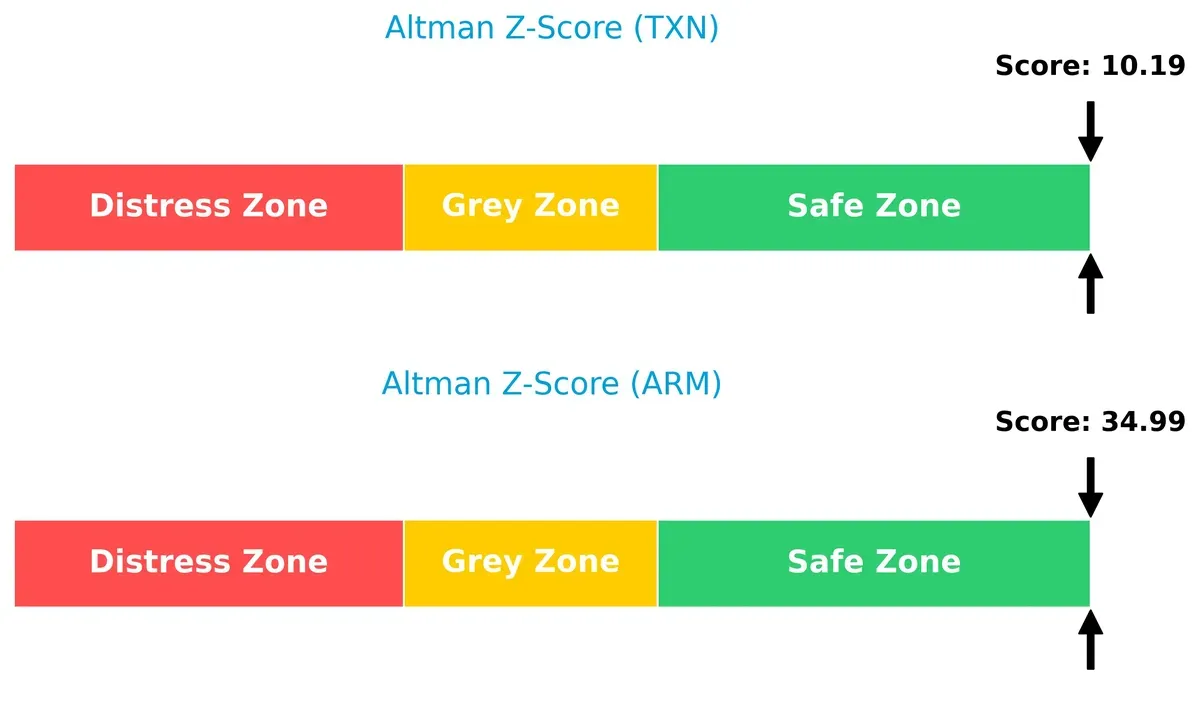
Bankruptcy Risk: Solvency Showdown
Texas Instruments and Arm both reside comfortably in the safe zone, but Arm’s Altman Z-Score of 35 vastly outperforms Texas Instruments’ 10, signaling superior financial resilience in this cycle:
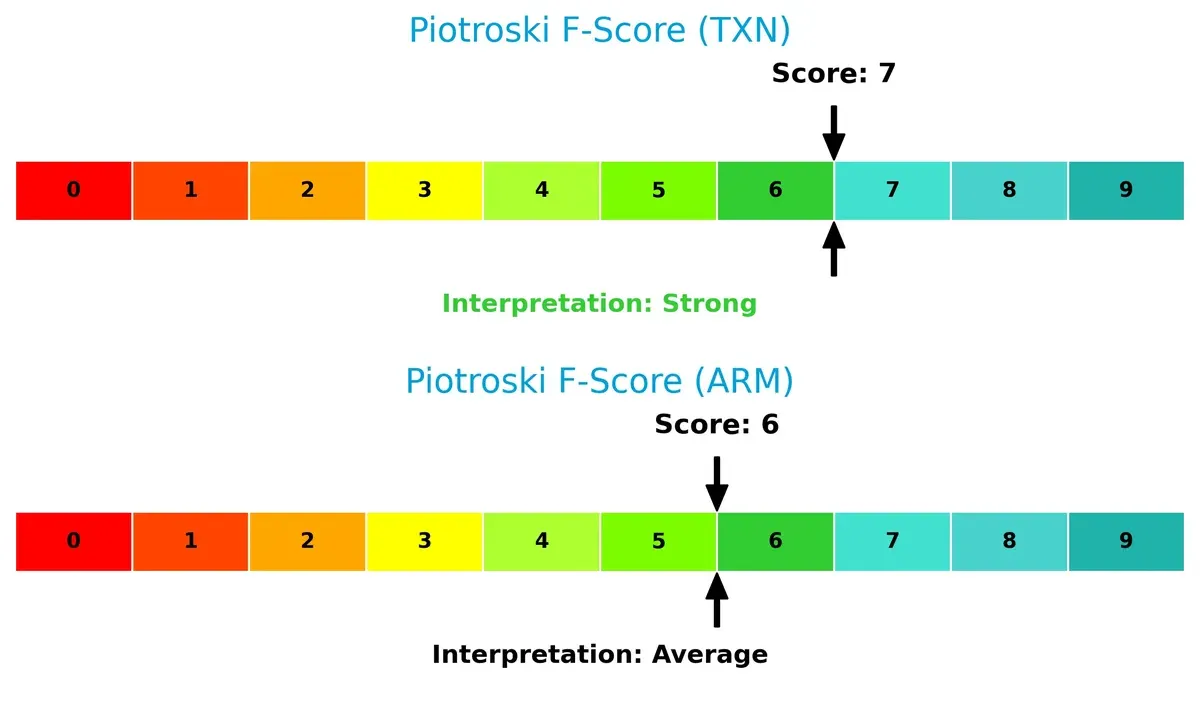
Financial Health: Quality of Operations
Texas Instruments scores a strong 7 on the Piotroski scale, indicating robust internal financial health. Arm’s 6, though respectable, suggests comparatively weaker fundamentals and possible red flags in operational metrics:
How are the two companies positioned?
This section dissects the operational DNA of TXN and ARM by comparing their revenue distribution and internal dynamics. The goal is to confront their economic moats to identify which model offers the most resilient competitive advantage today.
Revenue Segmentation: The Strategic Mix
The following visual comparison dissects how Texas Instruments and Arm Holdings diversify their income streams and where their primary sector bets lie:
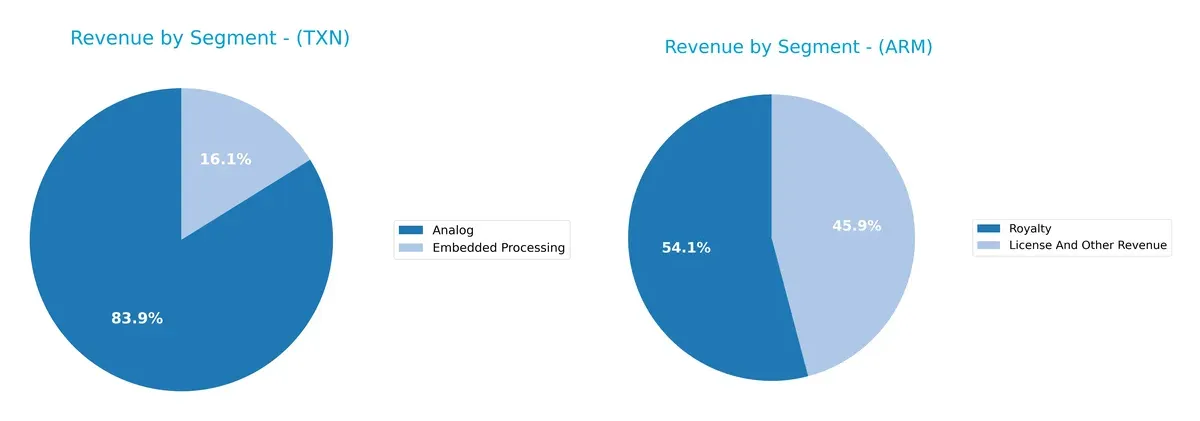
Texas Instruments leans heavily on its Analog segment, generating $14B in 2025, dwarfing its $2.7B Embedded Processing revenue. This signals a concentration risk but also dominance in analog semiconductor infrastructure. Arm Holdings shows a more balanced mix with $2.17B from royalties and $1.84B from licenses, pivoting on ecosystem lock-in through IP licensing. TI’s focus anchors on hardware, while Arm capitalizes on scalable software royalties.
Strengths and Weaknesses Comparison
This table compares the Strengths and Weaknesses of Texas Instruments Incorporated (TXN) and Arm Holdings plc (ARM):
TXN Strengths
- Strong profitability with 28.28% net margin
- High ROE at 30.73%
- Favorable ROIC at 16.52%
- Diverse revenue from Analog and Embedded Processing segments
- Broad global presence including US, China, and EMEA
- Solid dividend yield of 3.17%
ARM Strengths
- Favorable net margin at 19.77%
- Very low debt-to-assets at 3.99%
- Infinite interest coverage ratio
- High fixed asset turnover at 5.61
- Favorable quick ratio of 5.2
- Revenue from diversified geographic markets including US, China, Taiwan
TXN Weaknesses
- Unfavorable valuation metrics with PE of 31.53 and PB of 9.69
- High current ratio at 4.35 flagged as unfavorable
- Neutral debt-to-equity at 0.86
- Moderate asset turnover at 0.51
- Exposure to China and Asia markets may present geopolitical risks
ARM Weaknesses
- Unfavorable high WACC at 24.35%
- Low ROIC of 10.28% flagged unfavorable
- Unfavorable PE of 141.58 and PB of 16.4
- No dividend yield
- Unfavorable asset turnover at 0.45
- High proportion of unfavorable financial ratios (50%)
Overall, TXN demonstrates robust profitability and a diversified product and geographic footprint, balanced by valuation and liquidity concerns. ARM shows strengths in low leverage and asset efficiency but faces challenges with high capital costs and valuation metrics. These profiles suggest differing strategic priorities in capital allocation and market positioning.
The Moat Duel: Analyzing Competitive Defensibility
A structural moat shields long-term profits from relentless competition erosion. Here’s how Texas Instruments and Arm Holdings defend their turf:
Texas Instruments Incorporated: Cost Advantage Moat
Texas Instruments leverages a robust cost advantage in analog and embedded semiconductors. Its 35% EBIT margin and 8.4% ROIC premium over WACC reflect efficient capital use. However, a declining ROIC trend signals potential margin pressure in 2026 from intensifying competition and supply chain shifts.
Arm Holdings plc American Depositary Shares: Intangible Asset Moat
Arm’s moat centers on its intellectual property licensing model, enabling high gross margins near 95%. Despite a negative ROIC premium signaling value destruction, explosive revenue and net income growth suggest successful market expansion. Its ecosystem lock-in may deepen if new chip designs win broader adoption.
Cost Efficiency vs. Intellectual Property Licensing
Texas Instruments holds a deeper moat through consistent value creation despite eroding returns. Arm shows rapid growth but struggles to translate innovations into ROIC above cost of capital. I see Texas Instruments better positioned to defend market share amid semiconductor sector volatility.
Which stock offers better returns?
The past year reveals contrasting price dynamics: Texas Instruments shows strong gains with accelerating momentum, while Arm Holdings faces a modest decline amid decelerating trend signals.
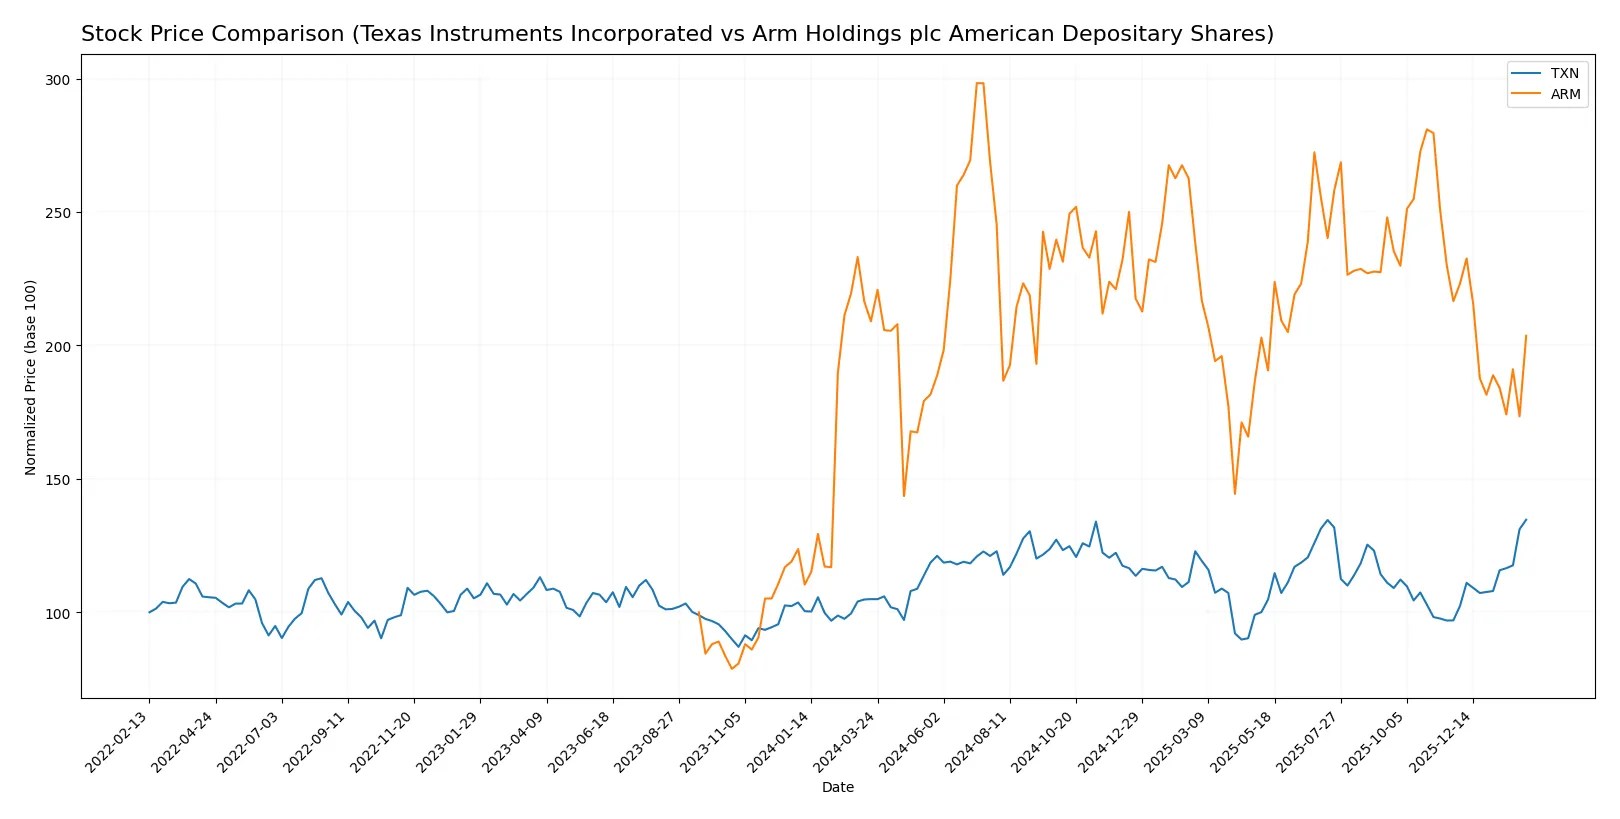
Trend Comparison
Texas Instruments’ stock price rose 28.36% over the past year, marking a bullish trend with acceleration. The price ranged between 147.6 and 221.44, showing strong upward momentum.
Arm Holdings’ stock declined 2.58% in the same period, signaling a bearish trend with deceleration. The price fluctuated from 87.19 to 181.19, reflecting volatility but overall negative direction.
Texas Instruments outperformed Arm Holdings significantly, delivering the highest market returns with clear bullish acceleration versus Arm’s mild bearish deceleration.
Target Prices
Analysts present a clear consensus on target prices for Texas Instruments and Arm Holdings.
| Company | Target Low | Target High | Consensus |
|---|---|---|---|
| Texas Instruments Incorporated | 160 | 260 | 204.64 |
| Arm Holdings plc American Depositary Shares | 120 | 170 | 156.25 |
The target consensus for Texas Instruments sits below its current price of $221.44, indicating modest downside risk. Arm Holdings shows strong upside potential, with its $156.25 consensus well above the current $123.70 stock price.

Don’t Let Luck Decide Your Entry Point
Optimize your entry points with our advanced ProRealTime indicators. You’ll get efficient buy signals with precise price targets for maximum performance. Start outperforming now!
How do institutions grade them?
Texas Instruments Incorporated Grades
Here are the most recent grades from notable grading companies for Texas Instruments Incorporated:
| Grading Company | Action | New Grade | Date |
|---|---|---|---|
| Rosenblatt | maintain | Buy | 2026-02-05 |
| JP Morgan | maintain | Overweight | 2026-01-28 |
| Cantor Fitzgerald | maintain | Neutral | 2026-01-28 |
| Wells Fargo | maintain | Equal Weight | 2026-01-28 |
| Truist Securities | maintain | Hold | 2026-01-28 |
| Stifel | maintain | Hold | 2026-01-28 |
| UBS | maintain | Buy | 2026-01-28 |
| Mizuho | maintain | Underperform | 2026-01-28 |
| Jefferies | maintain | Hold | 2026-01-28 |
| Benchmark | maintain | Buy | 2026-01-28 |
Arm Holdings plc American Depositary Shares Grades
Here are the most recent grades from notable grading companies for Arm Holdings plc American Depositary Shares:
| Grading Company | Action | New Grade | Date |
|---|---|---|---|
| Wells Fargo | maintain | Overweight | 2026-02-05 |
| Benchmark | maintain | Hold | 2026-02-05 |
| JP Morgan | maintain | Overweight | 2026-02-05 |
| TD Cowen | maintain | Buy | 2026-02-05 |
| Rosenblatt | maintain | Buy | 2026-02-05 |
| Evercore ISI Group | maintain | Outperform | 2026-02-05 |
| Mizuho | maintain | Outperform | 2026-02-05 |
| UBS | maintain | Buy | 2026-02-05 |
| RBC Capital | maintain | Outperform | 2026-02-05 |
| Wells Fargo | maintain | Overweight | 2026-01-26 |
Which company has the best grades?
Arm Holdings holds generally stronger grades, including multiple “Outperform” ratings versus Texas Instruments’ highest grade of “Buy.” This suggests investors may find more bullish sentiment around Arm’s outlook.
Risks specific to each company
The following categories identify the critical pressure points and systemic threats facing both firms in the 2026 market environment:
1. Market & Competition
Texas Instruments Incorporated
- Strong analog and embedded segments with steady demand in industrial and automotive markets.
Arm Holdings plc American Depositary Shares
- Faces intense competition in CPU architecture licensing; innovation pace and adoption critical.
2. Capital Structure & Debt
Texas Instruments Incorporated
- Moderate leverage (D/E 0.86), manageable interest coverage of 11.52x.
Arm Holdings plc American Depositary Shares
- Very low debt (D/E 0.05), effectively no interest burden, but high WACC at 24.35%.
3. Stock Volatility
Texas Instruments Incorporated
- Beta near 1 (0.995) suggests market-level volatility.
Arm Holdings plc American Depositary Shares
- Extremely high beta (4.374) signals significant stock price swings and investor risk.
4. Regulatory & Legal
Texas Instruments Incorporated
- US-based with established regulatory environment; geopolitical trade tensions may impact exports.
Arm Holdings plc American Depositary Shares
- UK-headquartered with exposure to multiple jurisdictions, including China, increasing regulatory complexity.
5. Supply Chain & Operations
Texas Instruments Incorporated
- Vertically integrated manufacturing reduces supply chain risk; strong operational efficiency.
Arm Holdings plc American Depositary Shares
- Licensing model limits operational risk but depends heavily on partners’ supply chains.
6. ESG & Climate Transition
Texas Instruments Incorporated
- Increasing pressure to manage energy use in manufacturing; strong disclosure expected.
Arm Holdings plc American Depositary Shares
- Faces ESG scrutiny on global operations and carbon footprint from licensees’ manufacturing.
7. Geopolitical Exposure
Texas Instruments Incorporated
- US-China trade tensions pose risks to sales and supply chains.
Arm Holdings plc American Depositary Shares
- Global footprint including China and Taiwan exposes it to heightened geopolitical tensions.
Which company shows a better risk-adjusted profile?
Texas Instruments’ most impactful risk is moderate leverage combined with exposure to US-China trade tensions. Arm’s greatest risk is extreme stock volatility driven by high beta and regulatory complexity across jurisdictions. I see Texas Instruments as having a more balanced risk-adjusted profile. Their Altman Z-score of 10.2 and strong profitability metrics contrast with Arm’s elevated WACC (24.35%) and unfavorable valuation multiples. Arm’s stock surged 11.6% recently, reflecting speculative risk that investors must weigh carefully.
Final Verdict: Which stock to choose?
Texas Instruments’ superpower lies in its robust cash generation and disciplined capital allocation. It sustains a strong economic moat with solid returns well above its cost of capital. The point of vigilance is its slightly declining profitability trend and stretched valuation metrics. It fits well in portfolios targeting steady income and moderate growth.
Arm Holdings commands a strategic moat through its dominant intellectual property in chip design, underpinning recurring revenue streams. It offers a safer balance sheet and high growth potential, though at a premium valuation and lower current profitability. This profile suits investors focused on growth at a reasonable price with tolerance for volatility.
If you prioritize reliable cash flow and proven value creation, Texas Instruments is the compelling choice due to its efficient capital use and income stability. However, if you seek higher growth potential with a strategic moat in innovation, Arm Holdings offers superior revenue expansion but commands a premium and carries more risk.
Disclaimer: Investment carries a risk of loss of initial capital. The past performance is not a reliable indicator of future results. Be sure to understand risks before making an investment decision.
Go Further
I encourage you to read the complete analyses of Texas Instruments Incorporated and Arm Holdings plc American Depositary Shares to enhance your investment decisions: