Home > Comparison > Technology > ARM vs TER
The strategic rivalry between Arm Holdings plc and Teradyne, Inc. shapes the semiconductor industry’s evolution. Arm is a technology licensor specializing in CPU architectures and intellectual property, enabling diverse manufacturers globally. Teradyne operates as a capital-intensive producer of automated test equipment across semiconductor and industrial segments. This analysis contrasts Arm’s scalable IP model with Teradyne’s manufacturing focus to identify which offers superior risk-adjusted returns for diversified portfolios in today’s technology landscape.
Table of contents
Companies Overview
Arm Holdings and Teradyne stand as pivotal players shaping the semiconductor industry’s future.
Arm Holdings plc American Depositary Shares: Leading Semiconductor Architect
Arm Holdings dominates semiconductor design by licensing CPU and related technology to chipmakers globally. Its core revenue stems from licensing fees and royalties on microprocessors, GPUs, and system IPs. In 2026, the company focuses on expanding its intellectual property footprint across automotive and IoT markets, reinforcing its competitive advantage in power-efficient chip architecture.
Teradyne, Inc.: Premier Test Equipment Innovator
Teradyne specializes in automatic test equipment for semiconductors and wireless devices. It generates revenue through sales of test platforms and industrial automation products. In 2026, Teradyne emphasizes advancing its robotic automation and wireless test solutions, targeting increased adoption in semiconductor manufacturing and 5G wireless device testing, solidifying its market leadership in test technology.
Strategic Collision: Similarities & Divergences
Arm and Teradyne pursue distinct but complementary strategies. Arm champions an open licensing model, enabling broad adoption of its IP, while Teradyne relies on proprietary test systems and automation to serve semiconductor manufacturers. Their primary battleground is the semiconductor value chain—Arm at design, Teradyne at production validation. This contrast defines their unique investment profiles: Arm as an intellectual property powerhouse, Teradyne as a capital equipment specialist.
Income Statement Comparison
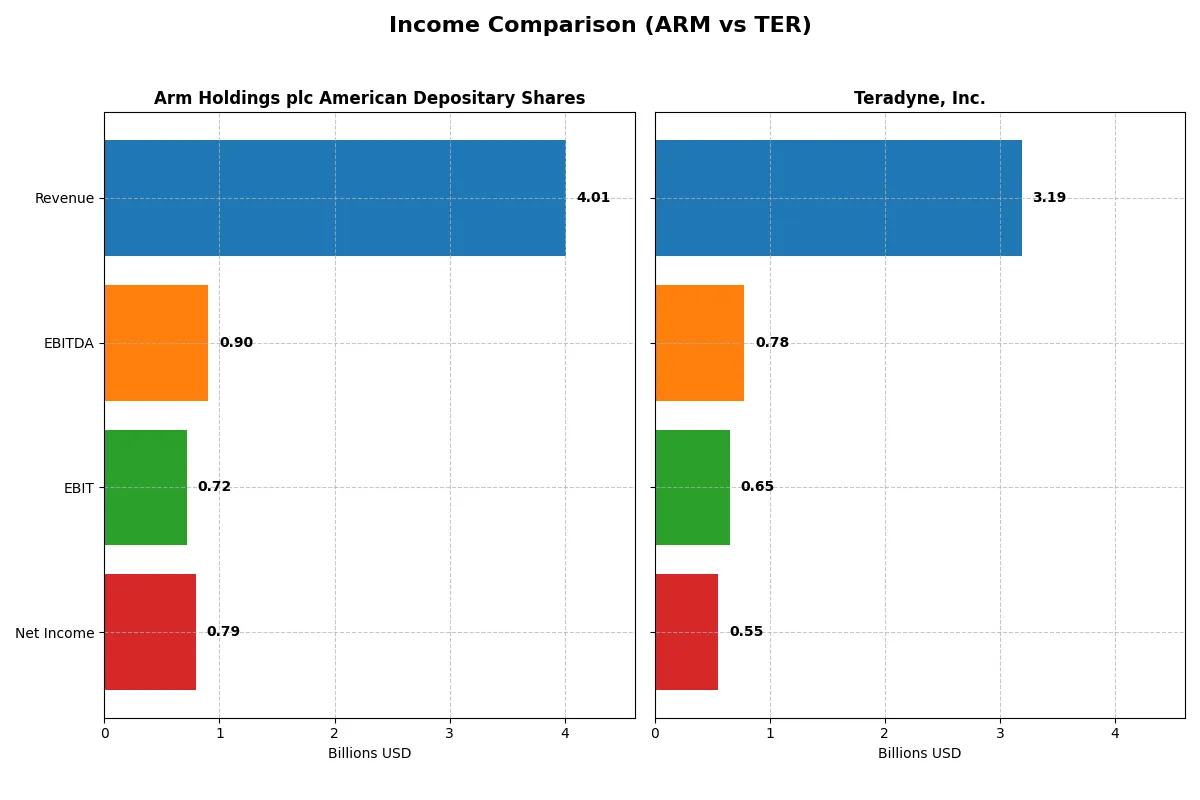
This data dissects the core profitability and scalability of both corporate engines to reveal who dominates the bottom line:
| Metric | Arm Holdings plc American Depositary Shares (ARM) | Teradyne, Inc. (TER) |
|---|---|---|
| Revenue | 4B | 3.19B |
| Cost of Revenue | 206M | 1.32B |
| Operating Expenses | 2.97B | 1.17B |
| Gross Profit | 3.8B | 1.87B |
| EBITDA | 903M | 780M |
| EBIT | 720M | 653M |
| Interest Expense | 0 | 8M |
| Net Income | 792M | 554M |
| EPS | 0.75 | 3.49 |
| Fiscal Year | 2025 | 2025 |
Income Statement Analysis: The Bottom-Line Duel
This income statement comparison reveals which company converts revenue into profit most efficiently and sustains healthy margins over time.
Arm Holdings plc American Depositary Shares Analysis
Arm’s revenue nearly doubled from 2.0B in 2021 to 4.0B in 2025, with net income more than doubling to 792M. Its gross margin remains exceptionally high at 94.9%, signaling strong cost control. The net margin improved to 19.8% in 2025, reflecting effective operational leverage and rapid EBIT growth of 240% year-over-year.
Teradyne, Inc. Analysis
Teradyne’s revenue declined by 14% from 3.7B in 2021 to 3.2B in 2025. Net income fell sharply by 45%, reaching 554M in 2025. Gross margin of 58.6% stays solid but lags Arm’s by a wide margin. Despite a stable EBIT margin near 20.5%, the net margin slipped to 17.4%, indicating rising costs or tax impacts undermining bottom-line growth.
Rapid Growth and Margin Excellence vs. Revenue Contraction and Margin Pressure
Arm dominates with superior revenue growth and near-95% gross margins, doubling its net income since 2021. Teradyne’s shrinking top line and lower net margin reflect operational challenges despite solid EBIT margins. Investors may find Arm’s high-margin, high-growth profile more compelling for long-term value creation.
Financial Ratios Comparison
These vital ratios act as a diagnostic tool to expose the underlying fiscal health, valuation premiums, and capital efficiency of the companies compared below:
| Ratios | Arm Holdings plc (ARM) | Teradyne, Inc. (TER) |
|---|---|---|
| ROE | 11.6% | 19.8% |
| ROIC | 10.3% | 18.4% |
| P/E | 142 | 54.6 |
| P/B | 16.4 | 10.8 |
| Current Ratio | 5.20 | 1.76 |
| Quick Ratio | 5.20 | 1.41 |
| D/E | 0.05 | 0.12 |
| Debt-to-Assets | 4.0% | 8.3% |
| Interest Coverage | 0 | 86.4 |
| Asset Turnover | 0.45 | 0.76 |
| Fixed Asset Turnover | 5.61 | 4.99 |
| Payout ratio | 0 | 14% |
| Dividend yield | 0 | 0.25% |
| Fiscal Year | 2025 | 2025 |
Efficiency & Valuation Duel: The Vital Signs
Financial ratios serve as a company’s DNA, uncovering hidden risks and operational strength that raw numbers often mask.
Arm Holdings plc American Depositary Shares
Arm shows a moderate ROE of 11.58% and a strong net margin near 20%, indicating decent profitability. However, its valuation multiples are stretched, with a P/E of 141.58 and P/B of 16.4, reflecting high market expectations. The firm does not pay dividends, instead reinvesting heavily in R&D, which accounts for over 50% of revenue, signaling growth prioritization.
Teradyne, Inc.
Teradyne delivers a robust ROE of 19.82% and a solid net margin of 17.37%, reflecting efficient profit generation. Its valuation is more reasonable with a P/E of 54.64 and P/B of 10.83, though still elevated. Teradyne maintains shareholder value through modest dividends and steady cash flow, supported by a strong free cash flow yield around 1.5%, balancing growth with income.
Premium Valuation vs. Operational Safety
Teradyne offers a better balance of profitability and valuation, exhibiting stronger returns on equity and capital with fewer red flags. Arm’s steep multiples and heavy reinvestment suit growth-focused investors willing to accept higher risk. Teradyne fits those seeking operational efficiency with moderate valuation risk.
Which one offers the Superior Shareholder Reward?
Arm Holdings plc (ARM) does not pay dividends but focuses on reinvestment and growth, with no payout ratio and zero dividend yield. Teradyne, Inc. (TER) pays a modest dividend yield around 0.25–0.38%, with payout ratios near 14%. ARM’s buyback activity is minimal, while TER maintains steady dividends and moderate buybacks. ARM prioritizes free cash flow reinvestment into R&D and expansion, reflecting a growth-driven strategy. TER combines dividends with buybacks, delivering income plus capital return. I judge TER offers a more attractive total shareholder return profile in 2026, balancing yield sustainability and capital discipline, while ARM’s high valuation and negligible distributions raise risk for income-focused investors.
Comparative Score Analysis: The Strategic Profile
The radar chart reveals the fundamental DNA and trade-offs of Arm Holdings plc and Teradyne, Inc., highlighting their relative strengths and risk exposures:
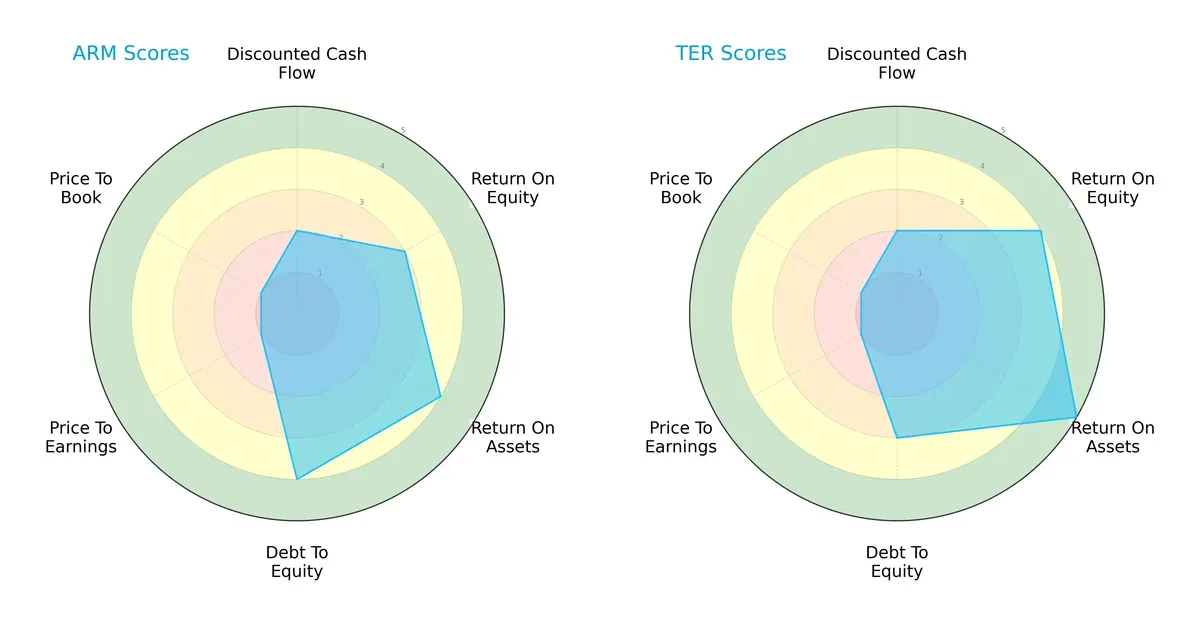
Arm and Teradyne share a balanced overall score of 3, but Teradyne edges ahead in profitability metrics, with superior ROE (4 vs. 3) and ROA (5 vs. 4) scores. Arm demonstrates stronger financial conservatism, reflected in a better debt-to-equity score (4 vs. 3). Both struggle on valuation metrics, scoring very unfavorably on P/E and P/B ratios. Teradyne’s profile suggests operational efficiency, while Arm relies more on a solid capital structure.
Bankruptcy Risk: Solvency Showdown
The Altman Z-Scores indicate both companies reside comfortably in the safe zone, implying strong resilience in this economic cycle:
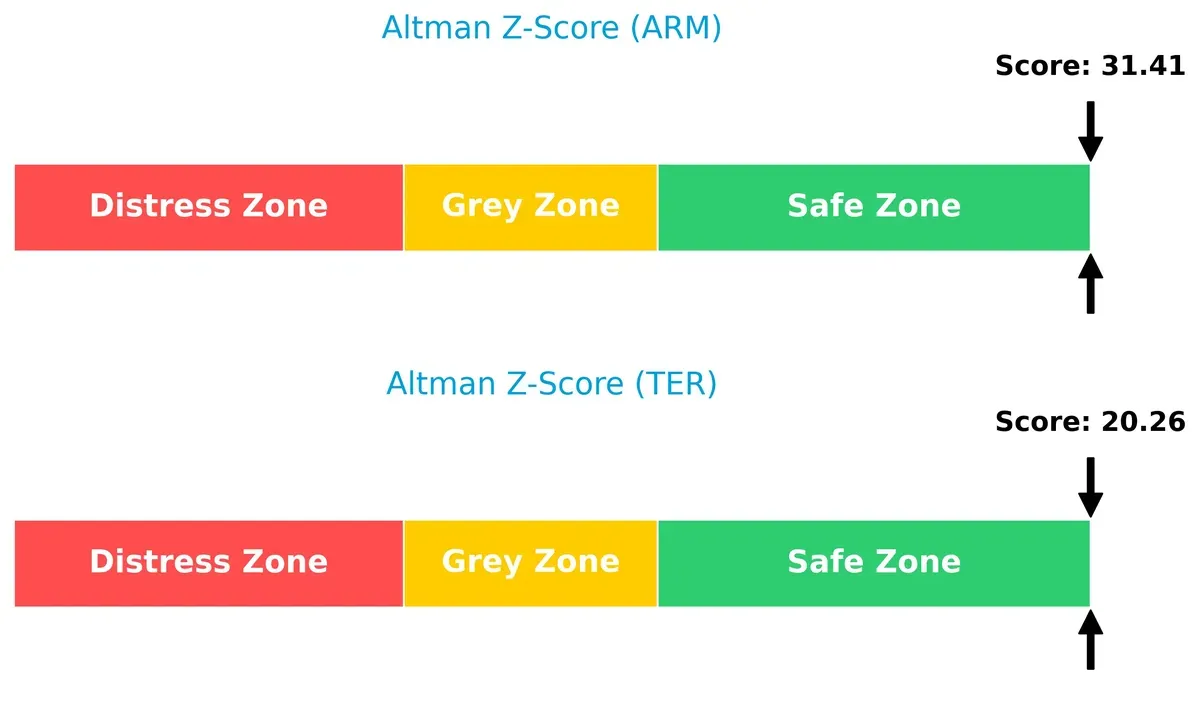
Arm boasts a significantly higher Z-Score of 31.4 compared to Teradyne’s 20.3, signaling a lower bankruptcy risk and greater financial stability over the long term.
Financial Health: Quality of Operations
Arm’s Piotroski F-Score of 7 signals robust financial health, outperforming Teradyne’s score of 6, which is merely average:
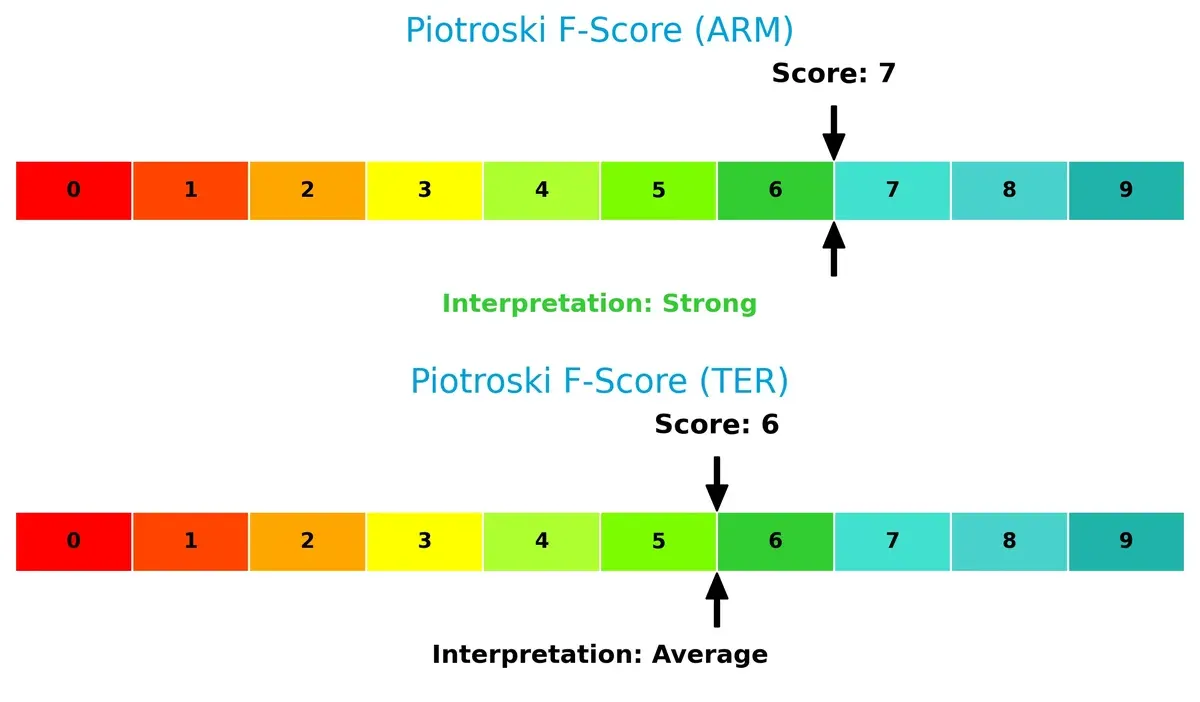
Arm’s higher score highlights stronger internal operational metrics and fewer red flags, suggesting better quality earnings and asset management relative to Teradyne.
How are the two companies positioned?
This section dissects the operational DNA of Arm and Teradyne by comparing their revenue distribution and internal strengths and weaknesses. The goal is to confront their economic moats to identify which model delivers the most resilient competitive advantage today.
Revenue Segmentation: The Strategic Mix
This visual comparison dissects how Arm Holdings plc and Teradyne, Inc. diversify their income streams and where their primary sector bets lie:
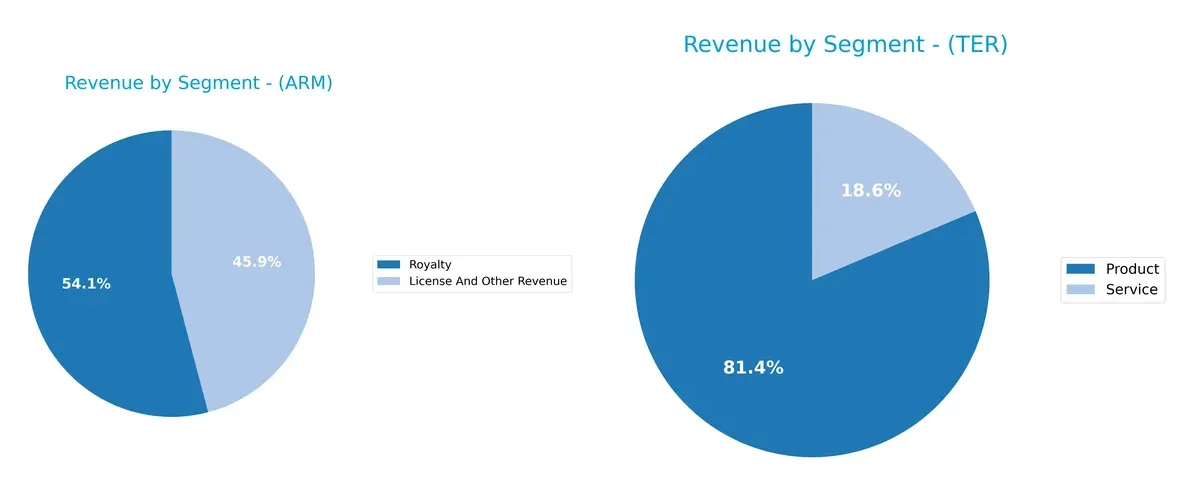
Arm Holdings pivots on two segments: License And Other Revenue at $1.8B and Royalty at $2.2B, showing a focused but balanced model. Teradyne relies heavily on Product sales, which dwarf its Service segment at $2.3B versus $525M. Arm’s mix signals ecosystem lock-in through licensing and royalties, while Teradyne’s concentration in Products highlights infrastructure dominance but exposes it to higher concentration risk.
Strengths and Weaknesses Comparison
This table compares the Strengths and Weaknesses of Arm and Teradyne based on diversification, profitability, financials, innovation, global presence, and market share:
Arm Strengths
- High net margin at 19.77%
- Low debt-to-assets at 3.99%
- Strong quick ratio at 5.2
- Favorable interest coverage (infinite)
- Diversified revenue from licenses and royalties
- Significant U.S. and Asian market presence
Teradyne Strengths
- Strong profitability with 19.82% ROE and 18.45% ROIC
- Favorable current and quick ratios
- Low debt-to-assets at 8.32%
- Diversified product and services revenue streams
- Wide global footprint including EMEA, Asia, U.S.
- Consistent fixed asset turnover
Arm Weaknesses
- High WACC at 24.41% exceeds ROIC
- Unfavorable P/E at 141.58 and P/B at 16.4
- Low asset turnover at 0.45
- No dividend yield
- Slightly unfavorable overall ratio profile
Teradyne Weaknesses
- WACC at 12.35% still above ROIC
- Unfavorable P/E at 54.64 and P/B at 10.83
- Moderate asset turnover at 0.76
- Low dividend yield at 0.25%
- Some exposure to volatile Asian markets
Arm demonstrates strong liquidity and conservative leverage but struggles with capital efficiency and valuation. Teradyne shows robust profitability and balanced financial health but faces moderate valuation and capital cost challenges. Both firms leverage global markets differently, influencing their strategic positioning.
The Moat Duel: Analyzing Competitive Defensibility
A structural moat protects long-term profits from relentless competitive pressures. Only a durable competitive advantage ensures sustainable returns:
Arm Holdings plc: Intellectual Property Licensing Moat
Arm’s moat stems from its vast portfolio of semiconductor IP licenses. This generates high gross margins near 95%, reflecting strong pricing power. In 2026, expansion into automotive and IoT markets could deepen its IP dominance, though fierce patent challenges loom.
Teradyne, Inc.: Automation and Test Equipment Cost Advantage
Teradyne’s moat relies on specialized automated test equipment, driving stable EBIT margins around 20%. Unlike Arm, Teradyne leverages manufacturing scale and industrial automation to control costs. Its 2026 outlook includes growth in robotics and wireless test segments, offsetting a recent ROIC decline.
Verdict: Licensing Power vs. Manufacturing Scale
Arm’s IP licensing model yields a wider moat with near 95% gross margins but currently destroys value on a ROIC-WACC basis. Teradyne creates value with solid margins and cost control, though its profitability trends downward. Arm’s moat is broader, but Teradyne is better equipped to defend market share amid rising competitive pressures.
Which stock offers better returns?
Over the past year, Arm Holdings plc ADS declined sharply by 17.3%, while Teradyne, Inc. surged with strong price gains and accelerating momentum.
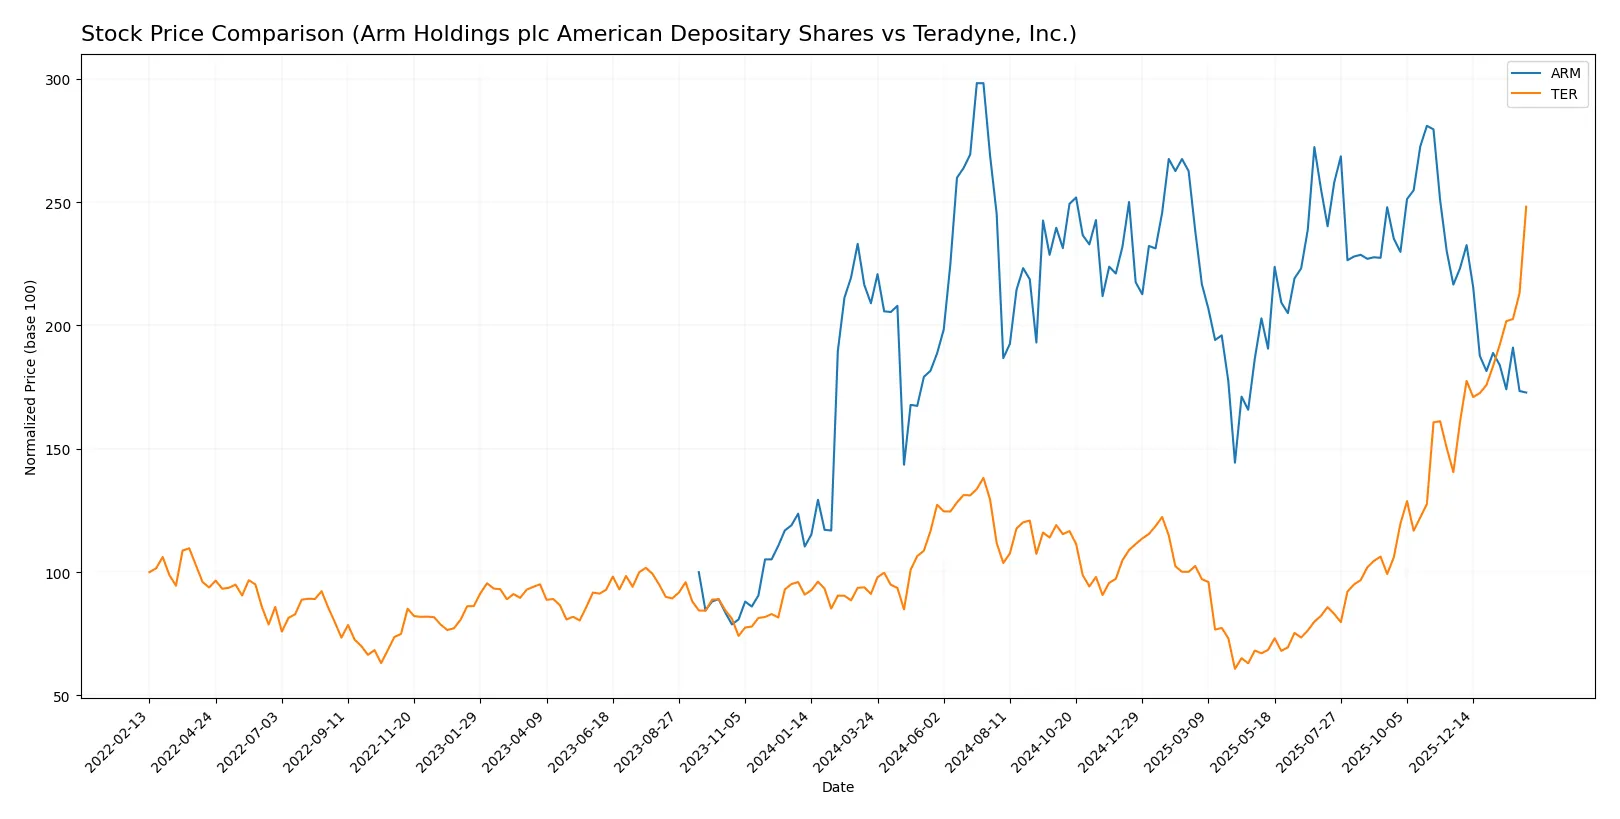
Trend Comparison
Arm Holdings shows a bearish trend with a 17.3% price drop over 12 months, decelerating after a recent 20.2% decline. Its volatility is moderate with a 19.9% standard deviation.
Teradyne posts a robust 172.4% gain over the year, reflecting a bullish, accelerating trend. Recent gains of 76.6% confirm strong momentum amid higher volatility at 39.6%.
Teradyne outperformed Arm significantly, delivering the highest market returns with accelerating upward momentum compared to Arm’s steady decline.
Target Prices
Analysts present a strong bullish consensus for Arm Holdings plc and Teradyne, Inc., indicating significant upside potential.
| Company | Target Low | Target High | Consensus |
|---|---|---|---|
| Arm Holdings plc American Depositary Shares | 120 | 170 | 157.5 |
| Teradyne, Inc. | 175 | 335 | 276.08 |
The target consensus for Arm implies a 48% premium over its current price of $106.64, reflecting optimism in semiconductor IP growth. Teradyne’s targets suggest a modest upside of about 1% from $279.44, signaling cautious confidence amid cyclical pressures.

Don’t Let Luck Decide Your Entry Point
Optimize your entry points with our advanced ProRealTime indicators. You’ll get efficient buy signals with precise price targets for maximum performance. Start outperforming now!
How do institutions grade them?
The following tables present recent institutional grades for Arm Holdings plc American Depositary Shares and Teradyne, Inc.:
Arm Holdings plc American Depositary Shares Grades
This table summarizes recent grades and actions by major financial institutions for Arm Holdings.
| Grading Company | Action | New Grade | Date |
|---|---|---|---|
| Benchmark | Maintain | Hold | 2026-02-05 |
| UBS | Maintain | Buy | 2026-01-26 |
| Wells Fargo | Maintain | Overweight | 2026-01-26 |
| Morgan Stanley | Maintain | Overweight | 2026-01-23 |
| Susquehanna | Upgrade | Positive | 2026-01-21 |
| B of A Securities | Downgrade | Neutral | 2026-01-13 |
| B of A Securities | Maintain | Buy | 2025-12-16 |
| Goldman Sachs | Downgrade | Sell | 2025-12-15 |
| Loop Capital | Maintain | Buy | 2025-11-12 |
| Keybanc | Maintain | Overweight | 2025-11-06 |
Teradyne, Inc. Grades
Here are the latest institutional grades and actions for Teradyne, Inc.
| Grading Company | Action | New Grade | Date |
|---|---|---|---|
| Cantor Fitzgerald | Maintain | Overweight | 2026-02-04 |
| Goldman Sachs | Maintain | Buy | 2026-02-04 |
| Stifel | Maintain | Buy | 2026-02-04 |
| Evercore ISI Group | Maintain | Outperform | 2026-02-04 |
| Citigroup | Maintain | Buy | 2026-02-04 |
| Evercore ISI Group | Maintain | Outperform | 2026-02-03 |
| Cantor Fitzgerald | Maintain | Overweight | 2026-02-02 |
| Stifel | Maintain | Buy | 2026-01-30 |
| UBS | Maintain | Buy | 2026-01-26 |
| B of A Securities | Maintain | Buy | 2026-01-22 |
Which company has the best grades?
Teradyne consistently receives strong Buy and Outperform ratings from multiple top-tier firms. Arm shows more mixed grades, including Hold and Sell from some institutions. Teradyne’s superior consensus may signal greater institutional confidence, affecting investor sentiment positively.
Risks specific to each company
The 2026 market environment presents critical pressure points and systemic threats for both Arm Holdings plc American Depositary Shares and Teradyne, Inc., outlined as follows:
1. Market & Competition
Arm Holdings plc American Depositary Shares
- Faces intense competition in semiconductor IP licensing with rapid technology shifts.
Teradyne, Inc.
- Competes in diverse test equipment markets, requiring constant innovation to maintain share.
2. Capital Structure & Debt
Arm Holdings plc American Depositary Shares
- Very low debt-to-equity ratio (0.05), indicating strong balance sheet and low financial risk.
Teradyne, Inc.
- Moderate leverage (debt-to-equity 0.12) but still financially stable with solid interest coverage.
3. Stock Volatility
Arm Holdings plc American Depositary Shares
- High beta (4.37) signals substantial stock price volatility and sensitivity to market swings.
Teradyne, Inc.
- Lower beta (1.82) reflects more moderate stock price fluctuations and reduced market risk.
4. Regulatory & Legal
Arm Holdings plc American Depositary Shares
- Exposure to global IP regulations and export controls in semiconductor sector.
Teradyne, Inc.
- Subject to industry-specific compliance and trade regulations, with risk in defense segment.
5. Supply Chain & Operations
Arm Holdings plc American Depositary Shares
- Relies on global semiconductor ecosystem with potential disruptions in Asia-Pacific region.
Teradyne, Inc.
- Operations diversified across semiconductor test and industrial automation, mitigating single-source risk.
6. ESG & Climate Transition
Arm Holdings plc American Depositary Shares
- Increasing pressure to reduce carbon footprint in semiconductor manufacturing processes.
Teradyne, Inc.
- Focus on automation offers ESG benefits, but energy use and supply chain impacts remain challenges.
7. Geopolitical Exposure
Arm Holdings plc American Depositary Shares
- Significant exposure to China and Taiwan tensions, affecting licensing and partnerships.
Teradyne, Inc.
- US-based with global operations; geopolitical shifts in trade policies pose manageable risks.
Which company shows a better risk-adjusted profile?
Teradyne faces fewer risks in stock volatility and geopolitical exposure, and it maintains a healthier capital structure. Arm’s high beta and unfavorable valuation metrics heighten risk. Teradyne’s balanced leverage and strong operational diversification deliver a superior risk-adjusted profile. Notably, Arm’s beta above 4 signals outsized market sensitivity, which warrants caution despite its robust liquidity ratios.
Final Verdict: Which stock to choose?
Arm Holdings’ superpower lies in its dominant intellectual property and unmatched efficiency in chip design. This cash-generative engine fuels growth, yet its sky-high valuation and ROIC below WACC signal a point of vigilance. It suits aggressive growth portfolios willing to weather valuation risk for innovation exposure.
Teradyne’s strategic moat centers on strong operational returns and a robust capital allocation track record. Its healthier financial ratios and value-creating profile offer better stability compared to Arm. Teradyne aligns with GARP investors seeking steady growth with reasonable valuation discipline.
If you prioritize cutting-edge innovation and market leadership, Arm outshines with its growth potential despite financial caution flags. However, if you seek a more stable investment with value creation and consistent returns, Teradyne offers a superior risk-adjusted profile for a balanced portfolio.
Disclaimer: Investment carries a risk of loss of initial capital. The past performance is not a reliable indicator of future results. Be sure to understand risks before making an investment decision.
Go Further
I encourage you to read the complete analyses of Arm Holdings plc American Depositary Shares and Teradyne, Inc. to enhance your investment decisions: