In the fast-evolving semiconductor industry, Taiwan Semiconductor Manufacturing Company Limited (TSMC) and Arm Holdings plc stand out as pivotal players driving innovation and technological advancement. TSMC leads in wafer fabrication and integrated circuit manufacturing, while Arm specializes in CPU architecture and intellectual property licensing. Their complementary yet competitive roles make them ideal for comparison. In this article, I will help you determine which company offers the most compelling investment opportunity in 2026.

Table of contents
Companies Overview
I will begin the comparison between Taiwan Semiconductor Manufacturing Company Limited (TSM) and Arm Holdings plc American Depositary Shares (ARM) by providing an overview of these two companies and their main differences.
Taiwan Semiconductor Manufacturing Company Limited Overview
TSM is a leading semiconductor manufacturer headquartered in Hsinchu City, Taiwan. Established in 1987, the company specializes in wafer fabrication processes and integrated circuits, serving markets such as high performance computing, smartphones, automotive, and digital consumer electronics. With a market cap of approximately 1.7T USD and over 65K employees, TSM operates globally, including in the US, Europe, and Asia.
Arm Holdings plc American Depositary Shares Overview
ARM, based in Cambridge, UK, is a semiconductor technology company focused on designing and licensing CPU products and related IP for semiconductor firms and OEMs. Founded in 1990, ARM’s offerings include microprocessors, GPUs, and software used in automotive, computing infrastructure, and IoT markets. The company has a market cap near 111B USD and employs around 8.3K people worldwide, operating as a subsidiary of Kronos II LLC.
Key similarities and differences
Both TSM and ARM operate within the semiconductor sector but differ in their business models. TSM is primarily a manufacturer of chips and semiconductor devices, while ARM focuses on IP licensing and design. Both serve diverse markets such as automotive and IoT, yet TSM’s global manufacturing scale contrasts with ARM’s licensing-based revenue model. Their geographic footprints overlap in Asia and the US, but ARM is headquartered in the UK and TSM in Taiwan.
Income Statement Comparison
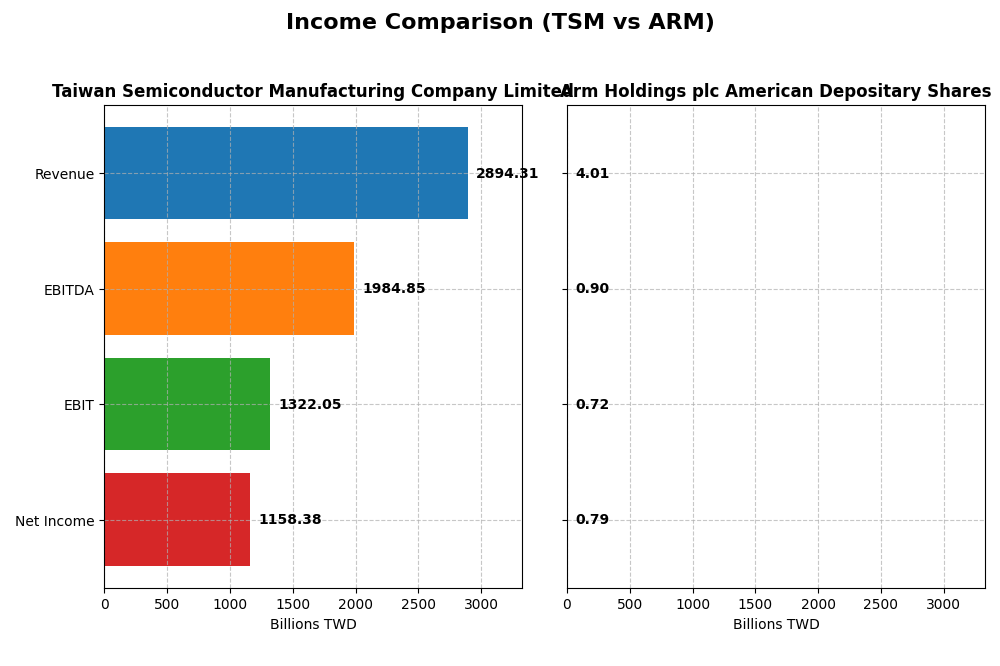
The table below presents a side-by-side comparison of key income statement metrics for Taiwan Semiconductor Manufacturing Company Limited and Arm Holdings plc for their most recent fiscal years.
| Metric | Taiwan Semiconductor Manufacturing Company Limited | Arm Holdings plc American Depositary Shares |
|---|---|---|
| Market Cap | 1.70T TWD | 111B USD |
| Revenue | 2.89T TWD | 4.01B USD |
| EBITDA | 1.98T TWD | 903M USD |
| EBIT | 1.32T TWD | 720M USD |
| Net Income | 1.16T TWD | 792M USD |
| EPS | 223.4 TWD | 0.75 USD |
| Fiscal Year | 2024 | 2025 |
Income Statement Interpretations
Taiwan Semiconductor Manufacturing Company Limited
TSMC exhibited strong revenue growth from 2020 to 2024, increasing from TWD 1.34T to TWD 2.89T, with net income rising from TWD 511B to TWD 1.16T. Margins remained stable, with a gross margin around 56% and net margin near 40%. In 2024, revenue growth accelerated to 33.9%, supported by a favorable 1.6% net margin increase, indicating solid profitability enhancement.
Arm Holdings plc American Depositary Shares
Arm’s revenue grew from USD 2.03B in 2021 to USD 4.01B in 2025, with net income increasing from USD 388M to USD 792M. The company maintained an exceptional gross margin near 95%, though the net margin was lower at about 20%. In 2025, Arm saw a strong 23.9% revenue growth and a significant 108.8% rise in net margin, reflecting improving operational efficiency and profitability.
Which one has the stronger fundamentals?
Both companies demonstrated favorable income trends with revenue and net income growth over their respective periods. TSMC shows higher absolute profit figures and more robust net margins, while Arm boasts superior gross margins and faster margin expansion recently. Arm’s higher percentage growth contrasts with TSMC’s larger scale and stable profitability, offering different fundamental strengths in their financial profiles.
Financial Ratios Comparison
Below is a comparison of key financial ratios for Taiwan Semiconductor Manufacturing Company Limited (TSM) and Arm Holdings plc American Depositary Shares (ARM), based on the most recent fiscal year data available.
| Ratios | TSM (2024) | ARM (2025) |
|---|---|---|
| ROE | 27.29% | 11.58% |
| ROIC | 20.00% | 10.28% |
| P/E | 29.04 | 141.58 |
| P/B | 7.92 | 16.40 |
| Current Ratio | 2.36 | 5.20 |
| Quick Ratio | 2.14 | 5.20 |
| D/E | 0.25 | 0.05 |
| Debt-to-Assets | 15.65% | 3.99% |
| Interest Coverage | 125.96 | 0 (not applicable) |
| Asset Turnover | 0.43 | 0.45 |
| Fixed Asset Turnover | 0.88 | 5.61 |
| Payout Ratio | 31.34% | 0% |
| Dividend Yield | 1.08% | 0% |
Interpretation of the Ratios
Taiwan Semiconductor Manufacturing Company Limited
Taiwan Semiconductor Manufacturing Company Limited shows mostly favorable financial ratios, including a strong net margin of 40.02% and robust return on equity at 27.29%. However, valuation metrics such as P/E at 29.04 and P/B at 7.92 are less favorable. The company maintains a healthy dividend yield around 1.08%, supported by stable payout ratios and consistent free cash flow coverage, indicating sustainable shareholder returns.
Arm Holdings plc American Depositary Shares
Arm Holdings plc presents mixed ratios with a favorable net margin of 19.77%, but its return on invested capital at 10.28% and weighted average cost of capital at 24.25% raise concerns. The firm does not pay dividends, reflecting a reinvestment strategy aligned with its growth phase. Despite a strong quick ratio and low debt levels, elevated valuation multiples and a zero dividend yield suggest cautious investor scrutiny.
Which one has the best ratios?
Taiwan Semiconductor Manufacturing Company Limited generally exhibits more favorable ratios with higher profitability, solid returns, and a sustainable dividend policy. In contrast, Arm Holdings plc shows several unfavorable valuation and profitability metrics, compounded by no dividend payments. Overall, Taiwan Semiconductor Manufacturing Company Limited’s ratios appear stronger relative to Arm Holdings plc’s slightly unfavorable profile.
Strategic Positioning
This section compares the strategic positioning of Taiwan Semiconductor Manufacturing Company Limited (TSM) and Arm Holdings plc (ARM), including market position, key segments, and exposure to disruption:
TSM
- Leading semiconductor manufacturer with global scale; faces industry competition.
- Focus on wafer fabrication processes and related products; drives revenue via high-volume manufacturing.
- Manufacturing-centric, less exposed to rapid technological shifts; invests in technology startups.
ARM
- Semiconductor IP licensor with competitive pressure from other IP providers.
- Generates revenue mainly from licensing and royalties in CPU and system IP markets.
- Dependent on IP innovation; faces risk from evolving semiconductor architectures.
TSM vs ARM Positioning
TSM’s strategy is manufacturing-focused with diversified semiconductor products, benefiting from scale but facing capital intensity. ARM concentrates on IP licensing and royalties, offering innovation leverage but dependent on maintaining design relevance and licensing demand.
Which has the best competitive advantage?
TSM shows a slightly favorable moat with value creation despite declining ROIC, indicating efficient capital use and scale advantages. ARM’s unfavorable moat reflects value destruction and stable but insufficient profitability, suggesting weaker competitive advantage.
Stock Comparison
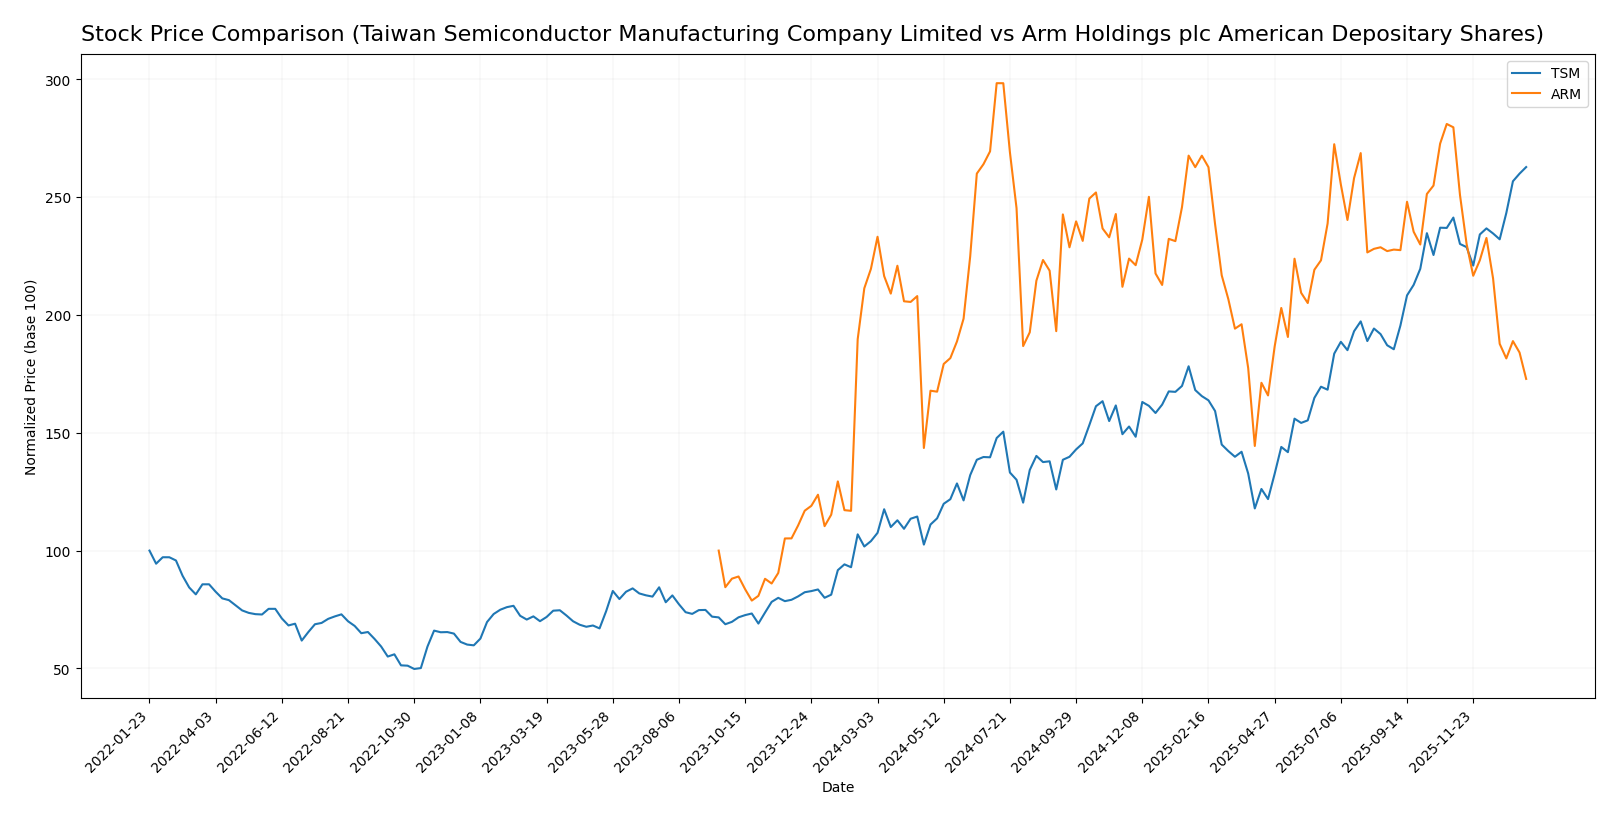
The stock price movements over the past 12 months reveal a strong bullish trend for Taiwan Semiconductor Manufacturing Company Limited (TSM) with significant price appreciation, while Arm Holdings plc American Depositary Shares (ARM) experienced a marked bearish trend and deceleration in value.
Trend Analysis
Taiwan Semiconductor Manufacturing Company Limited (TSM) showed a robust bullish trend over the past year with a 152.54% price increase, acceleration in growth, and significant volatility indicated by a 51.25 std deviation.
Arm Holdings plc (ARM) demonstrated a bearish trend with a 21.26% price decline and deceleration in the downward movement, combined with moderate volatility at a 19.31 std deviation.
Comparing both stocks, TSM delivered the highest market performance with a strong positive trend, while ARM’s stock declined significantly over the same period.
Target Prices
The consensus target prices for Taiwan Semiconductor Manufacturing Company Limited and Arm Holdings plc reflect optimistic analyst expectations.
| Company | Target High | Target Low | Consensus |
|---|---|---|---|
| Taiwan Semiconductor Manufacturing Company Limited | 400 | 330 | 361.25 |
| Arm Holdings plc American Depositary Shares | 210 | 120 | 166 |
Analysts expect TSM’s stock to rise above its current price of 327.11 USD, while ARM’s consensus target price is significantly higher than its current 104.99 USD, indicating potential upside for both.
Analyst Opinions Comparison
This section compares analysts’ ratings and grades for Taiwan Semiconductor Manufacturing Company Limited (TSM) and Arm Holdings plc American Depositary Shares (ARM):
Rating Comparison
TSM Rating
- Rating: A- with a very favorable overall evaluation.
- Discounted Cash Flow Score: 5, indicating very favorable valuation based on future cash flow.
- ROE Score: 5, signifying very efficient profit generation from shareholders’ equity.
- ROA Score: 5, demonstrating very effective asset utilization to generate earnings.
- Debt To Equity Score: 3, a moderate level of financial risk due to debt compared to equity.
- Overall Score: 4, representing a favorable financial standing.
ARM Rating
- Rating: B with a very favorable overall evaluation.
- Discounted Cash Flow Score: 3, showing a moderate valuation assessment based on cash flow.
- ROE Score: 3, reflecting moderate efficiency in generating profit from equity.
- ROA Score: 4, indicating favorable asset utilization to generate earnings.
- Debt To Equity Score: 4, indicating a favorable financial risk profile with lower leverage.
- Overall Score: 3, corresponding to a moderate financial standing.
Which one is the best rated?
Based strictly on the provided data, TSM holds a higher rating (A-) and overall score (4) compared to ARM’s rating (B) and overall score (3). TSM also outperforms ARM in discounted cash flow, ROE, and ROA scores, despite a moderately higher debt-to-equity score.
Scores Comparison
Here is a comparison of the financial stability and strength scores for the two companies:
TSM Scores
- Altman Z-Score: 2.94, positioned in the grey zone, indicating moderate bankruptcy risk.
- Piotroski Score: 8, categorized as very strong financial health.
ARM Scores
- Altman Z-Score: 32.43, in the safe zone, indicating very low bankruptcy risk.
- Piotroski Score: 7, categorized as strong financial health.
Which company has the best scores?
ARM exhibits a significantly higher Altman Z-Score, placing it well in the safe zone, while TSM is in the grey zone. TSM holds a slightly better Piotroski Score, but ARM’s overall scores suggest stronger financial stability.
Grades Comparison
Here is a detailed comparison of the latest grades assigned to Taiwan Semiconductor Manufacturing Company Limited and Arm Holdings plc American Depositary Shares:
Taiwan Semiconductor Manufacturing Company Limited Grades
This table summarizes recent grade actions from reputable grading firms for TSM:
| Grading Company | Action | New Grade | Date |
|---|---|---|---|
| Bernstein | maintain | Outperform | 2025-12-08 |
| Needham | maintain | Buy | 2025-10-27 |
| Barclays | maintain | Overweight | 2025-10-17 |
| Needham | maintain | Buy | 2025-10-16 |
| Susquehanna | maintain | Positive | 2025-10-10 |
| Barclays | maintain | Overweight | 2025-10-09 |
| Barclays | maintain | Overweight | 2025-09-16 |
| Needham | maintain | Buy | 2025-07-17 |
| Susquehanna | maintain | Positive | 2025-07-14 |
| Needham | maintain | Buy | 2025-07-01 |
The overall trend for TSM shows consistent positive ratings, primarily “Buy” and “Overweight,” with no downgrades or negative revisions.
Arm Holdings plc American Depositary Shares Grades
This table shows recent grading actions from established firms for ARM:
| Grading Company | Action | New Grade | Date |
|---|---|---|---|
| B of A Securities | downgrade | Neutral | 2026-01-13 |
| B of A Securities | maintain | Buy | 2025-12-16 |
| Goldman Sachs | downgrade | Sell | 2025-12-15 |
| Loop Capital | maintain | Buy | 2025-11-12 |
| Rosenblatt | maintain | Buy | 2025-11-06 |
| TD Cowen | maintain | Buy | 2025-11-06 |
| Wells Fargo | maintain | Overweight | 2025-11-06 |
| Mizuho | maintain | Outperform | 2025-11-06 |
| Barclays | maintain | Overweight | 2025-11-06 |
| UBS | maintain | Buy | 2025-11-06 |
ARM’s grades reflect a mix of “Buy,” “Overweight,” and “Outperform” ratings but also include recent downgrades to “Neutral” and “Sell,” indicating some increased caution.
Which company has the best grades?
TSM has maintained uniformly positive and stable grades with no downgrades, whereas ARM shows mixed signals with recent downgrades despite a majority of buy ratings. This suggests TSM currently holds a stronger consensus grade profile, potentially indicating greater confidence from analysts and possibly less perceived risk for investors.
Strengths and Weaknesses
Below is a table summarizing the key strengths and weaknesses of Taiwan Semiconductor Manufacturing Company Limited (TSM) and Arm Holdings plc (ARM) based on their most recent financial and operational data.
| Criterion | Taiwan Semiconductor Manufacturing Company Limited (TSM) | Arm Holdings plc (ARM) |
|---|---|---|
| Diversification | Moderate product diversification with dominant wafer segment (approx. 3.8T TWD revenue in wafers and other products combined) | Focused on licensing and royalty revenues (approx. 4.0B USD total), less diversified product base |
| Profitability | High net margin (40.02%), strong ROE (27.29%), and ROIC (20.0%) indicating efficient capital use | Moderate net margin (19.77%), lower ROE (11.58%), and ROIC (10.28%) below WACC, signaling value destruction |
| Innovation | Leading-edge semiconductor manufacturing technology with consistent investment | Strong intellectual property base in chip architecture but investment returns are currently weak |
| Global presence | Extensive global manufacturing and customer base, critical in semiconductor supply chain | Global licensing footprint but less tangible operational presence |
| Market Share | Market leader in semiconductor foundry with significant share in wafer production | Leading IP provider in processor architecture but faces competitive pressure |
Key takeaways: TSM stands out with strong profitability, efficient capital use, and a robust global manufacturing presence, despite a recent decline in ROIC trend. ARM benefits from a unique IP licensing model but currently struggles with profitability and value creation challenges. Investors should weigh TSM’s stable operational strength against ARM’s innovation potential tempered by financial caution.
Risk Analysis
Below is a comparative risk overview of Taiwan Semiconductor Manufacturing Company Limited (TSM) and Arm Holdings plc (ARM) based on the latest available 2024-2025 data.
| Metric | Taiwan Semiconductor Manufacturing Company Limited (TSM) | Arm Holdings plc (ARM) |
|---|---|---|
| Market Risk | Beta 1.27 – Moderate volatility | Beta 4.36 – High volatility |
| Debt level | Low debt-to-equity 0.25 – Favorable | Very low debt-to-equity 0.05 – Favorable |
| Regulatory Risk | Medium – Operating in multiple jurisdictions including Taiwan and China | Medium-High – UK and US regulatory scrutiny |
| Operational Risk | Moderate – Large scale manufacturing with supply chain complexity | Moderate – Dependence on licensing and IP protection |
| Environmental Risk | Medium – Semiconductor manufacturing environmental impact | Medium – Less direct manufacturing but exposure to regulatory norms |
| Geopolitical Risk | High – Taiwan-China tensions impacting supply chains | Medium – UK-based but global operations |
TSM shows a balanced risk profile with strong financial stability but faces significant geopolitical risks due to Taiwan’s geopolitical environment. ARM demonstrates higher market volatility and regulatory risks, amplified by a very elevated beta and valuation concerns. Investors should weigh TSM’s geopolitical exposure against ARM’s valuation and market volatility risks.
Which Stock to Choose?
Taiwan Semiconductor Manufacturing Company Limited (TSM) shows a strong income evolution with 33.89% revenue growth in 2024 and favorable profitability ratios such as a 40.02% net margin and 27.29% ROE. Its debt levels are manageable with a 0.25 debt-to-equity ratio, supported by a very favorable A- rating.
Arm Holdings plc (ARM) presents solid income growth of 23.94% in 2025 and a high gross margin of 94.86%, but profitability ratios like 11.58% ROE and 10.28% ROIC are less robust. Its debt is very low with a 0.05 debt-to-equity ratio, and it holds a favorable B rating despite some unfavorable valuation metrics.
For investors, TSM’s favorable rating and strong profitability might appeal to those prioritizing quality and stability, while ARM’s growth and income improvements could attract risk-tolerant investors focused on growth potential despite valuation concerns. Both companies show favorable income statements, but TSM’s stronger financial ratios and higher rating might suggest a more balanced profile.
Disclaimer: Investment carries a risk of loss of initial capital. The past performance is not a reliable indicator of future results. Be sure to understand risks before making an investment decision.
Go Further
I encourage you to read the complete analyses of Taiwan Semiconductor Manufacturing Company Limited and Arm Holdings plc American Depositary Shares to enhance your investment decisions: