Home > Comparison > Technology > ARM vs STM
The strategic rivalry between Arm Holdings plc and STMicroelectronics N.V. shapes the semiconductor sector’s evolution. Arm excels as a technology licensor specializing in CPU architectures and system IPs, whereas STMicroelectronics operates as a diversified semiconductor manufacturer with strong automotive and industrial segments. This analysis pits Arm’s intellectual property model against ST’s manufacturing scale to assess which offers superior risk-adjusted returns for a balanced portfolio in today’s dynamic tech landscape.
Table of contents
Companies Overview
Arm Holdings plc and STMicroelectronics N.V. are pivotal players shaping the global semiconductor landscape.
Arm Holdings plc American Depositary Shares: Architect of Semiconductor Innovation
Arm Holdings dominates as a semiconductor IP licensor, generating revenue by licensing CPU designs and related technologies. Its core strength lies in providing scalable microprocessors and system IPs widely adopted in automotive, computing, and IoT markets. In 2026, Arm focuses on expanding its architecture into new verticals while enhancing energy efficiency across platforms.
STMicroelectronics N.V.: Diverse Semiconductor Manufacturer
STMicroelectronics stands out as a broad-based semiconductor manufacturer with diversified segments including automotive ICs, analog and MEMS sensors, and microcontrollers. It generates revenues by producing integrated circuits and discrete components for automotive, industrial, and consumer electronics. In 2026, STMicroelectronics prioritizes innovation in power solutions and connectivity to capture emerging industrial and automotive demand.
Strategic Collision: Similarities & Divergences
Arm’s licensing model contrasts with STMicroelectronics’ manufacturing approach—an ecosystem of design versus physical production. Their primary battleground centers on automotive and IoT markets where chip design and hardware integration converge. Investors face distinct profiles: Arm offers high-margin, scalable IP licensing, while STMicroelectronics delivers diversified hardware exposure with direct manufacturing risks.
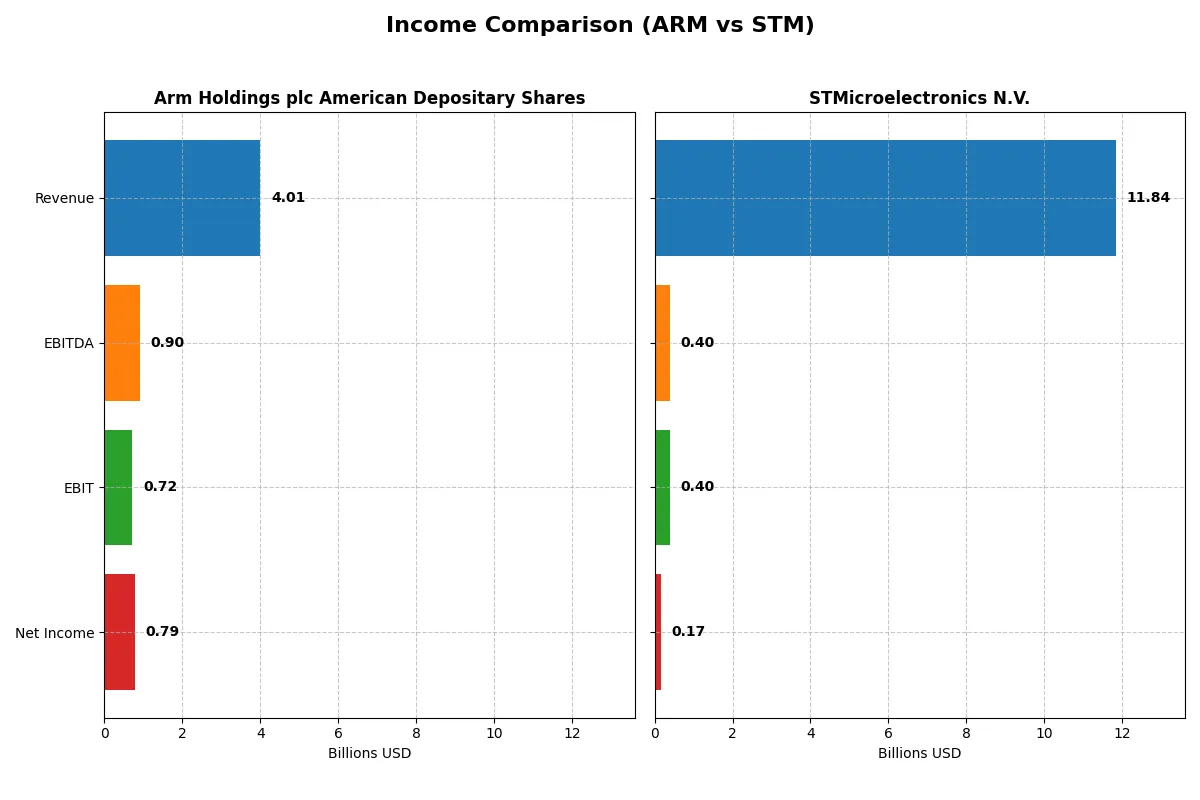
Income Statement Comparison
This data dissects the core profitability and scalability of both corporate engines to reveal who dominates the bottom line:
| Metric | Arm Holdings plc American Depositary Shares (ARM) | STMicroelectronics N.V. (STM) |
|---|---|---|
| Revenue | 4B | 11.8B |
| Cost of Revenue | 206M | 7.8B |
| Operating Expenses | 2.97B | 3.69B |
| Gross Profit | 3.8B | 4B |
| EBITDA | 903M | 401M |
| EBIT | 720M | 401M |
| Interest Expense | 0 | 0 |
| Net Income | 792M | 0 |
| EPS | 0.75 | 0.18 |
| Fiscal Year | 2025 | 2025 |
Income Statement Analysis: The Bottom-Line Duel
This income statement comparison reveals which company drives efficiency and profitability more effectively through their revenue and cost management.
Arm Holdings plc American Depositary Shares Analysis
Arm’s revenue nearly doubled from 2021 to 2025, reaching $4B in 2025 with a net income rising to $792M. Its gross margin consistently stays above 90%, reflecting exceptional cost control. The net margin improved to 19.8%, signaling strong profitability momentum and operational efficiency in the latest fiscal year.
STMicroelectronics N.V. Analysis
STM’s revenue declined by over 7% across the five-year span, falling to $11.8B in 2025, with net income plummeting by 92% to $167M. Gross margin remains modest at 33.9%, while net margin is a weak 1.4%. The sharp profitability drop and narrowing margins in 2025 highlight pressure on STM’s operational leverage and cost structure.
Efficiency and Growth: High Margin Precision vs. Scale Under Pressure
Arm demonstrates superior margin quality and robust growth, delivering a near 20% net margin with sustained revenue expansion. STM, despite larger scale, struggles with declining revenue and razor-thin profitability. For investors prioritizing margin strength and growth, Arm’s profile clearly outshines STM’s challenged earnings trajectory.
Financial Ratios Comparison
These vital ratios act as a diagnostic tool to expose underlying fiscal health, valuation premiums, and capital efficiency for investors to analyze:
| Ratios | Arm Holdings plc (ARM) | STMicroelectronics N.V. (STM) |
|---|---|---|
| ROE | 11.6% | 0.9% |
| ROIC | 10.3% | 0.7% |
| P/E | 142 | N/A |
| P/B | 16.4 | N/A |
| Current Ratio | 5.20 | 3.36 |
| Quick Ratio | 5.20 | 2.43 |
| D/E | 0.05 | 0.12 |
| Debt-to-Assets | 4.0% | 8.6% |
| Interest Coverage | 0 | 0 |
| Asset Turnover | 0.45 | 0.48 |
| Fixed Asset Turnover | 5.61 | 1.07 |
| Payout ratio | 0 | 0 |
| Dividend yield | 0 | 0 |
| Fiscal Year | 2025 | 2025 |
Efficiency & Valuation Duel: The Vital Signs
Financial ratios act as a company’s DNA, exposing hidden risks and operational strengths essential for investor insight.
Arm Holdings plc American Depositary Shares
Arm shows solid profitability with an 11.58% ROE and a strong 19.77% net margin. However, its valuation appears stretched, with a high P/E of 141.58 and P/B of 16.4. The firm does not pay dividends, instead reinvesting heavily in R&D (50% of revenue), signaling a growth-focused capital allocation approach.
STMicroelectronics N.V.
STM struggles with profitability, posting a weak 0.93% ROE and a thin 1.41% net margin. Its valuation metrics show no P/E or P/B, indicating undervaluation or lack of earnings. STM maintains a conservative balance sheet with moderate leverage and a quick ratio of 2.43. It also lacks dividends, focusing on modest R&D investment (17% of revenue).
Premium Valuation vs. Operational Safety
Arm commands a premium valuation justified by better profitability but faces risks from high WACC and stretched multiples. STM offers a more neutral valuation backdrop but suffers from weak returns. Investors seeking growth might favor Arm’s reinvestment, while those prioritizing balance sheet stability may lean toward STM’s cautious profile.
Which one offers the Superior Shareholder Reward?
Arm Holdings (ARM) pays no dividends but aggressively reinvests in R&D, fueling its high gross margin (~95%) and strong free cash flow (FCF) growth. STM pays a modest dividend (~1.28% yield in 2024) with a low payout ratio (~18%), but its free cash flow is often negative or volatile. ARM’s minimal debt and massive cash ratio (2.24x) support buybacks, though its buyback data is limited. STM maintains steady but lower-margin operations with moderate debt and consistent dividend plus buyback activity. I find ARM’s capital allocation, focused on growth and occasional buybacks, more sustainable and likely to deliver superior total shareholder returns in 2026.
Comparative Score Analysis: The Strategic Profile
The radar chart reveals the fundamental DNA and trade-offs of Arm Holdings plc American Depositary Shares and STMicroelectronics N.V.:
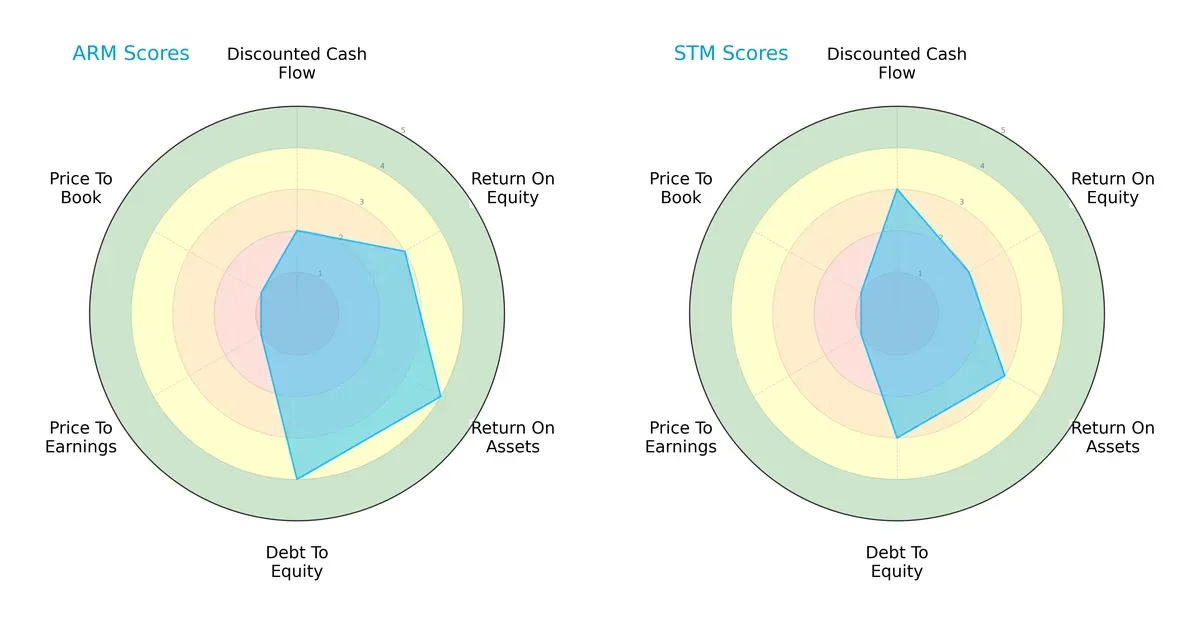
Arm shows a more balanced profile with favorable scores in ROA (4) and Debt/Equity (4), indicating efficient asset use and financial stability. STMicroelectronics relies on a slightly higher DCF score (3) but lags in ROE (2) and Debt/Equity (3), reflecting moderate operational efficiency and more leverage risk. Both share very unfavorable valuation scores, suggesting market caution.
—
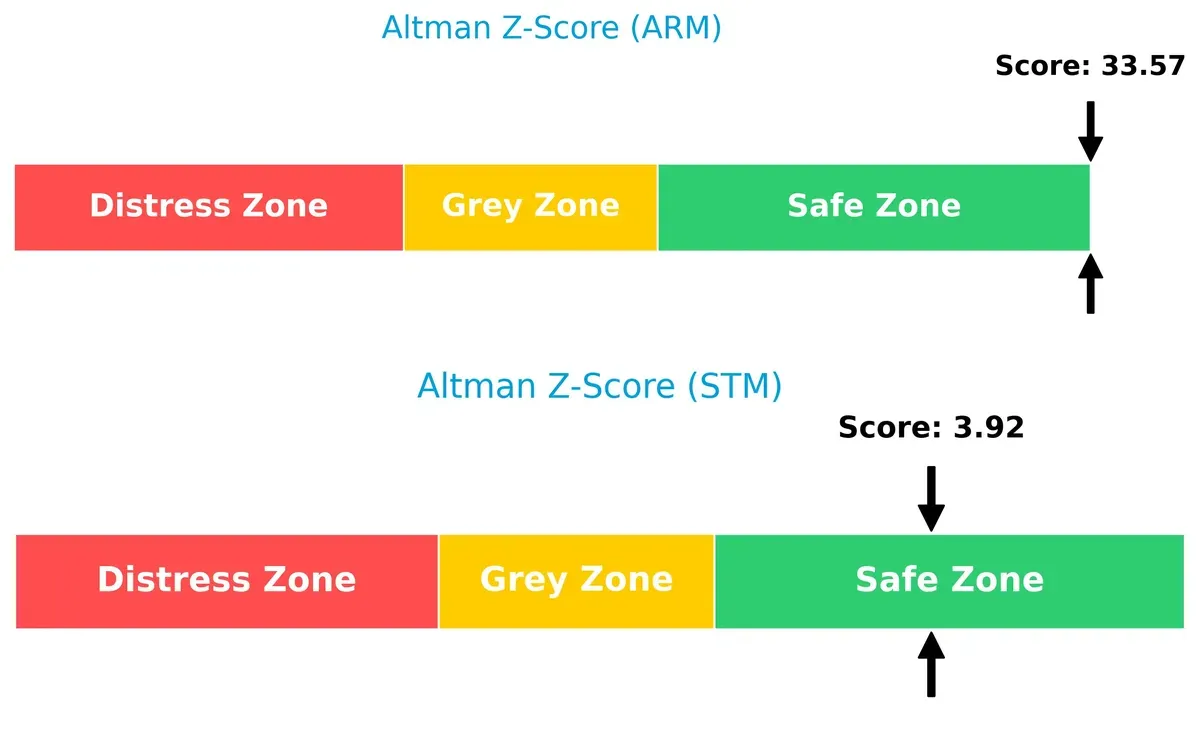
Bankruptcy Risk: Solvency Showdown
Arm’s Altman Z-Score of 33.6 vastly exceeds STMicroelectronics’ 3.9, signaling Arm’s superior long-term solvency and negligible bankruptcy risk in this cycle:
—
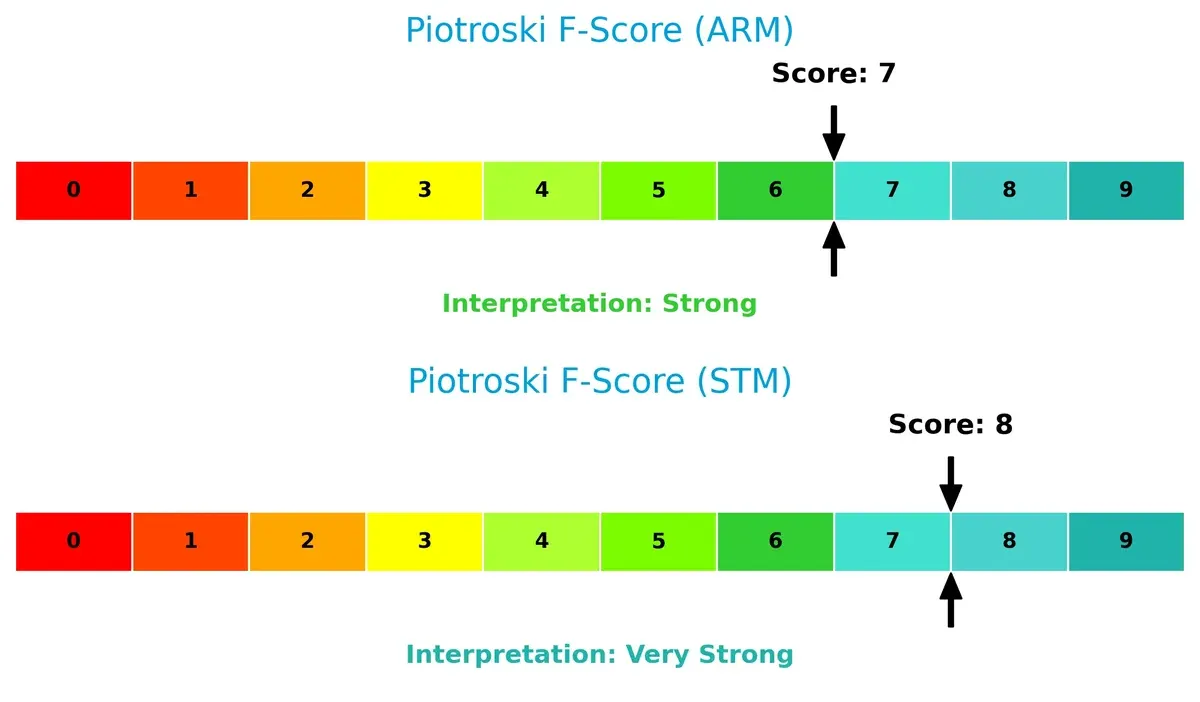
Financial Health: Quality of Operations
STMicroelectronics edges Arm with a Piotroski F-Score of 8 versus 7, indicating slightly stronger internal financial health and fewer red flags in operational quality:
How are the two companies positioned?
This section dissects the operational DNA of Arm and STM by comparing their revenue distribution and internal dynamics. The goal is to confront their economic moats and identify which model offers the most resilient competitive advantage today.
Revenue Segmentation: The Strategic Mix
This visual comparison dissects how Arm Holdings plc and STMicroelectronics diversify their income streams and where their primary sector bets lie:
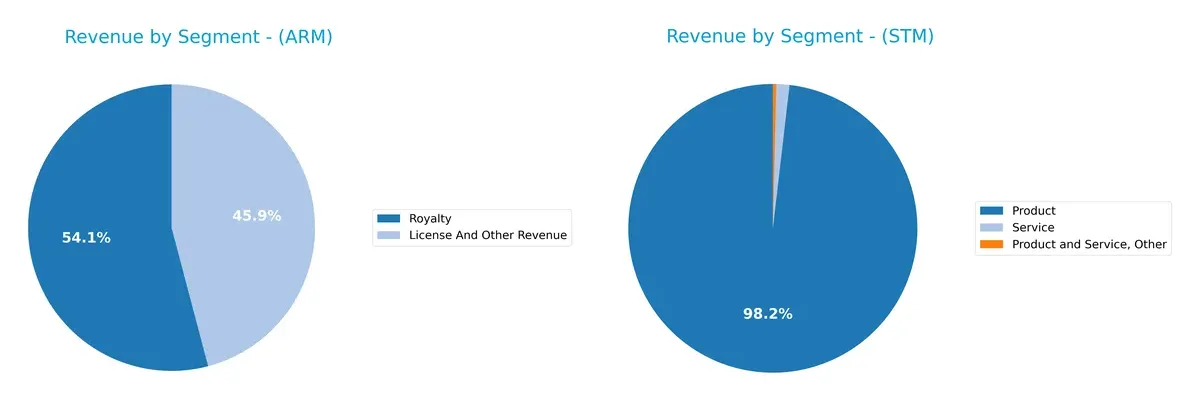
Arm relies heavily on two main segments: Royalty at $2.17B and License and Other Revenue at $1.84B, showing moderate concentration. STM, by contrast, anchors revenue in Products at $13.2B, with Services and Other segments contributing marginally. STM’s dominant product focus signals infrastructure and manufacturing strength but raises concentration risk. Arm’s dual-segment model supports ecosystem lock-in through licensing and royalties, balancing growth with recurring income.
Strengths and Weaknesses Comparison
This table compares the Strengths and Weaknesses of Arm Holdings plc American Depositary Shares (ARM) and STMicroelectronics N.V. (STM):
ARM Strengths
- High net margin at 19.77%
- Strong quick ratio at 5.2
- Low debt-to-equity at 0.05
- Favorable interest coverage with infinite value
- Robust fixed asset turnover at 5.61
- Significant revenue from licensing and royalties
STM Strengths
- Favorable P/E and P/B ratios at zero
- Strong quick ratio at 2.43
- Manageable debt-to-equity at 0.12
- Favorable interest coverage with infinite value
- Diversified product revenue exceeding 13B USD
- Wide global presence with large revenue in Singapore and the US
ARM Weaknesses
- ROIC of 10.28% below WACC at 24.32%
- Unfavorable P/E at 141.58 and P/B at 16.4
- Very high current ratio at 5.2 signaling inefficient asset use
- Low asset turnover at 0.45
- No dividend yield reported
- Slightly unfavorable overall ratio profile
STM Weaknesses
- Very low profitability with net margin at 1.41%
- ROE and ROIC below 1%
- Unfavorable current ratio at 3.36
- Marginal asset turnover at 0.48
- No dividend yield reported
- Neutral WACC at 9.36% limiting investment returns
ARM’s strengths lie in profitability and conservative leverage, while STM benefits from diversified product lines and favorable valuation metrics. Each faces challenges in asset efficiency and dividend policy, shaping their strategic priorities.
The Moat Duel: Analyzing Competitive Defensibility
A structural moat is the only thing protecting long-term profits from the erosion of competition. Let’s dissect how each company defends its turf:
Arm Holdings plc: Intangible Assets and Licensing Power
Arm’s moat stems from its industry-leading CPU architecture licenses. This drives high gross margins near 95% and stable net margins around 20%. In 2026, new product innovations and expansion into automotive chips could deepen this durable advantage.
STMicroelectronics N.V.: Diversified Product Portfolio and Scale
STM leverages broad semiconductor manufacturing capabilities across analog, microcontrollers, and sensors. Its moat contrasts Arm’s with scale-driven cost advantages but thin margins near 3%. However, declining revenue and eroding profitability threaten its competitive edge.
Verdict: Licensing Moat vs. Manufacturing Scale
Arm’s intangible asset moat yields higher returns and margin stability than STM’s scale-based model. Despite Arm’s negative ROIC vs. WACC, it maintains value better than STM, whose declining ROIC signals deeper value destruction. Arm is better positioned to defend market share long-term.
Which stock offers better returns?
Over the past 12 months, both Arm Holdings and STMicroelectronics experienced significant price declines, with contrasting recent momentum and volume trends impacting their trading dynamics.
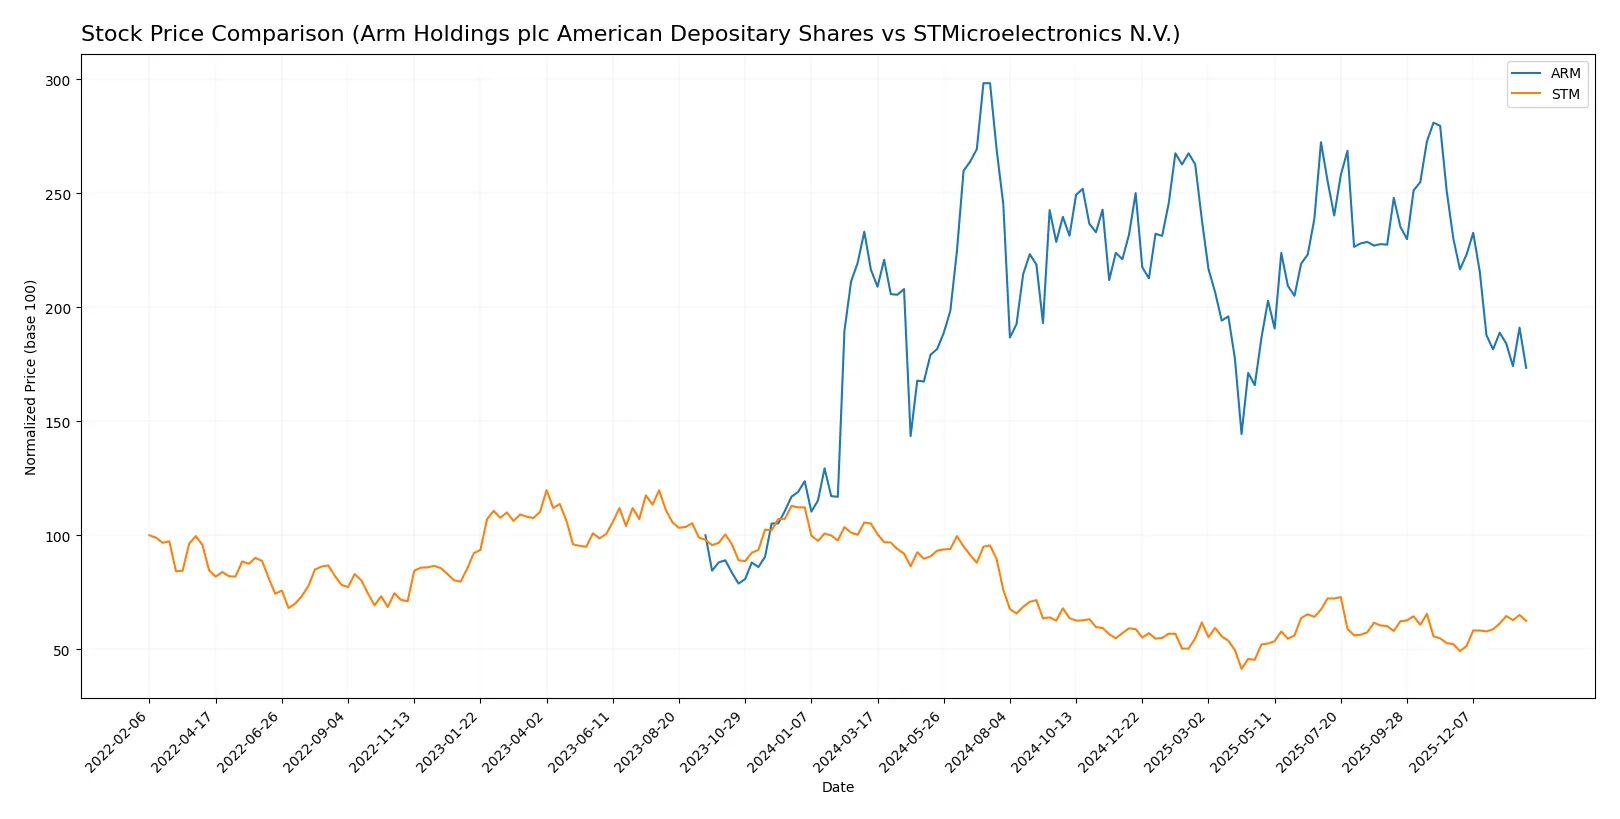
Trend Comparison
Arm Holdings’ stock fell 19.87% over the last year, showing a bearish trend with decelerating losses and high volatility, ranging from 87.19 to 181.19. Recent months worsened, dropping 24.62%.
STMicroelectronics declined 40.6% over the year, marking an accelerating bearish trend but with lower volatility. Recently, it reversed, gaining 19.49% and showing signs of recovery.
STMicroelectronics had the steepest annual decline but posted recent gains, while Arm’s losses decelerated. Overall, Arm delivered the higher market performance across the full 12 months.
Target Prices
Analysts present a bullish consensus for Arm Holdings and a moderate upside for STMicroelectronics.
| Company | Target Low | Target High | Consensus |
|---|---|---|---|
| Arm Holdings plc American Depositary Shares | 120 | 170 | 145 |
| STMicroelectronics N.V. | 28 | 45 | 37.67 |
Arm’s target consensus of 145 implies a 38% upside from the current 105.36, signaling strong growth expectations. STMicroelectronics’ 37.67 target suggests a 35% potential rise above its 27.89 price, reflecting moderate optimism.

Don’t Let Luck Decide Your Entry Point
Optimize your entry points with our advanced ProRealTime indicators. You’ll get efficient buy signals with precise price targets for maximum performance. Start outperforming now!
How do institutions grade them?
Here is a summary of recent institutional grades for Arm Holdings plc and STMicroelectronics N.V.:
Arm Holdings plc American Depositary Shares Grades
The table below shows Arm’s latest institutional ratings and actions:
| Grading Company | Action | New Grade | Date |
|---|---|---|---|
| UBS | maintain | Buy | 2026-01-26 |
| Wells Fargo | maintain | Overweight | 2026-01-26 |
| Morgan Stanley | maintain | Overweight | 2026-01-23 |
| Susquehanna | upgrade | Positive | 2026-01-21 |
| B of A Securities | downgrade | Neutral | 2026-01-13 |
STMicroelectronics N.V. Grades
The table below shows STMicroelectronics’ recent institutional ratings and changes:
| Grading Company | Action | New Grade | Date |
|---|---|---|---|
| TD Cowen | maintain | Buy | 2025-10-24 |
| Susquehanna | maintain | Positive | 2025-10-22 |
| Baird | upgrade | Outperform | 2025-07-22 |
| Jefferies | upgrade | Buy | 2025-02-19 |
| Bernstein | downgrade | Market Perform | 2025-02-05 |
Which company has the best grades?
Arm Holdings maintains a majority of Buy and Overweight ratings with recent upgrades but some downgrades to Neutral. STMicroelectronics shows a mix of Buy, Positive, and Outperform grades, balanced by downgrades to Market Perform and Underweight. Investors should note both companies receive varied outlooks, reflecting differing risk perceptions and growth expectations.
Risks specific to each company
The following risk categories identify critical pressure points and systemic threats facing both firms in the 2026 market environment:
1. Market & Competition
Arm Holdings plc American Depositary Shares
- Faces intense competition in semiconductor IP licensing, with a high beta of 4.36 indicating sensitivity to market swings.
STMicroelectronics N.V.
- Competes in diverse semiconductor segments with a lower beta of 1.29, suggesting more stable market exposure.
2. Capital Structure & Debt
Arm Holdings plc American Depositary Shares
- Exhibits a very low debt-to-equity ratio (0.05) and strong interest coverage, signaling low financial risk.
STMicroelectronics N.V.
- Higher debt-to-equity ratio (0.12) but still manageable; interest coverage remains strong, indicating solid debt service capacity.
3. Stock Volatility
Arm Holdings plc American Depositary Shares
- High beta (4.36) and share price volatility pose elevated risk for investors sensitive to market turbulence.
STMicroelectronics N.V.
- Lower beta (1.29) denotes more moderate stock volatility, appealing to risk-averse investors.
4. Regulatory & Legal
Arm Holdings plc American Depositary Shares
- Operates globally, including China and Taiwan, exposing it to complex regulatory and geopolitical scrutiny.
STMicroelectronics N.V.
- Also exposed globally but with a broader manufacturing footprint in Europe and Asia, facing regulatory challenges.
5. Supply Chain & Operations
Arm Holdings plc American Depositary Shares
- Relies heavily on licensing model, less vulnerable to supply chain disruptions but dependent on semiconductor industry health.
STMicroelectronics N.V.
- Manufacturing-intensive model faces direct supply chain risks, especially in semiconductor fabrication and component sourcing.
6. ESG & Climate Transition
Arm Holdings plc American Depositary Shares
- Limited dividend signals reinvestment focus; ESG risks tied to technology lifecycle and energy use in data centers.
STMicroelectronics N.V.
- Dividend payer with stronger operational footprint, facing pressure to reduce carbon emissions in manufacturing processes.
7. Geopolitical Exposure
Arm Holdings plc American Depositary Shares
- Significant exposure to China, Taiwan, and US tech tensions increases geopolitical risk.
STMicroelectronics N.V.
- Also exposed to geopolitical tensions but benefits from European base, providing some diversification.
Which company shows a better risk-adjusted profile?
Arm’s most impactful risk is its extreme stock volatility driven by a high beta and lofty valuation multiples (PE 141.58). STM’s primary risk lies in its thin profitability and operational exposure to supply chain disruptions. Despite Arm’s valuation risk, its very low leverage and licensing model mitigate some operational risks. STM’s stable leverage and dividend policy support resilience, but its weak margins and higher supply chain vulnerability weigh on its profile. The recent surge in Arm’s beta and valuation gap compared to sector norms justifies cautious risk management. Overall, STM displays a steadier risk-adjusted profile in the current semiconductor cycle.
Final Verdict: Which stock to choose?
Arm Holdings shines as a cash-generating powerhouse with impressive revenue and earnings growth. Its high current ratio signals strong liquidity but might also hint at underutilized assets—a point of vigilance. Arm suits investors targeting aggressive growth in tech innovation.
STMicroelectronics offers a strategic moat through diversified manufacturing and steady operational cash flow. While its profitability lags Arm’s, STM provides better balance-sheet stability, appealing to investors favoring Growth at a Reasonable Price (GARP) profiles.
If you prioritize rapid expansion and innovation, Arm outshines with superior income growth despite valuation risks. However, if you seek better financial stability and a more defensive stance, STM offers a safer harbor amid market volatility. Both present analytical scenarios shaped by distinct investor appetites.
Disclaimer: Investment carries a risk of loss of initial capital. The past performance is not a reliable indicator of future results. Be sure to understand risks before making an investment decision.
Go Further
I encourage you to read the complete analyses of Arm Holdings plc American Depositary Shares and STMicroelectronics N.V. to enhance your investment decisions: