Home > Comparison > Technology > ARM vs SLAB
The strategic rivalry between Arm Holdings plc and Silicon Laboratories Inc. shapes the semiconductor industry’s evolution. Arm operates as a global technology architect licensing microprocessor designs, leveraging a capital-light model. Silicon Labs, a fabless semiconductor firm, focuses on analog-intensive mixed-signal products serving niche IoT applications. This head-to-head pits broad-scale IP licensing against specialized product innovation. This analysis will identify which corporate strategy delivers superior risk-adjusted returns for a diversified portfolio.
Table of contents
Companies Overview
Arm Holdings and Silicon Laboratories play pivotal roles in the semiconductor sector, driving innovation across diverse IoT and computing markets.
Arm Holdings plc American Depositary Shares: Architect of Semiconductor Innovation
Arm Holdings commands a leading presence in semiconductor design, licensing its CPU architectures and intellectual property to chipmakers worldwide. Its revenue primarily stems from licensing fees and royalties tied to microprocessors and system IPs. In 2026, Arm focuses strategically on expanding its footprint in automotive and IoT sectors, leveraging its scalable technology to fuel growth across connected devices and infrastructure.
Silicon Laboratories Inc.: Specialist in Mixed-Signal Solutions
Silicon Laboratories operates as a fabless semiconductor firm delivering analog-intensive mixed-signal chips for IoT applications. Its revenue derives from wireless microcontrollers and sensor products sold across industrial automation, smart home, and medical devices. In 2026, Silicon Labs emphasizes innovation in connected security and smart metering technologies, aiming to deepen its presence in embedded systems through targeted product development.
Strategic Collision: Similarities & Divergences
Both companies thrive in the semiconductor space but diverge in business models: Arm licenses architecture broadly, building an open ecosystem, while Silicon Labs designs and sells proprietary mixed-signal chips focused on niche IoT applications. Their primary battleground lies in the expanding Internet of Things, where Arm’s scalable IP competes with Silicon Labs’ specialized solutions. Investment profiles reflect Arm’s broad market exposure versus Silicon Labs’ concentrated innovation-driven niche.
Income Statement Comparison
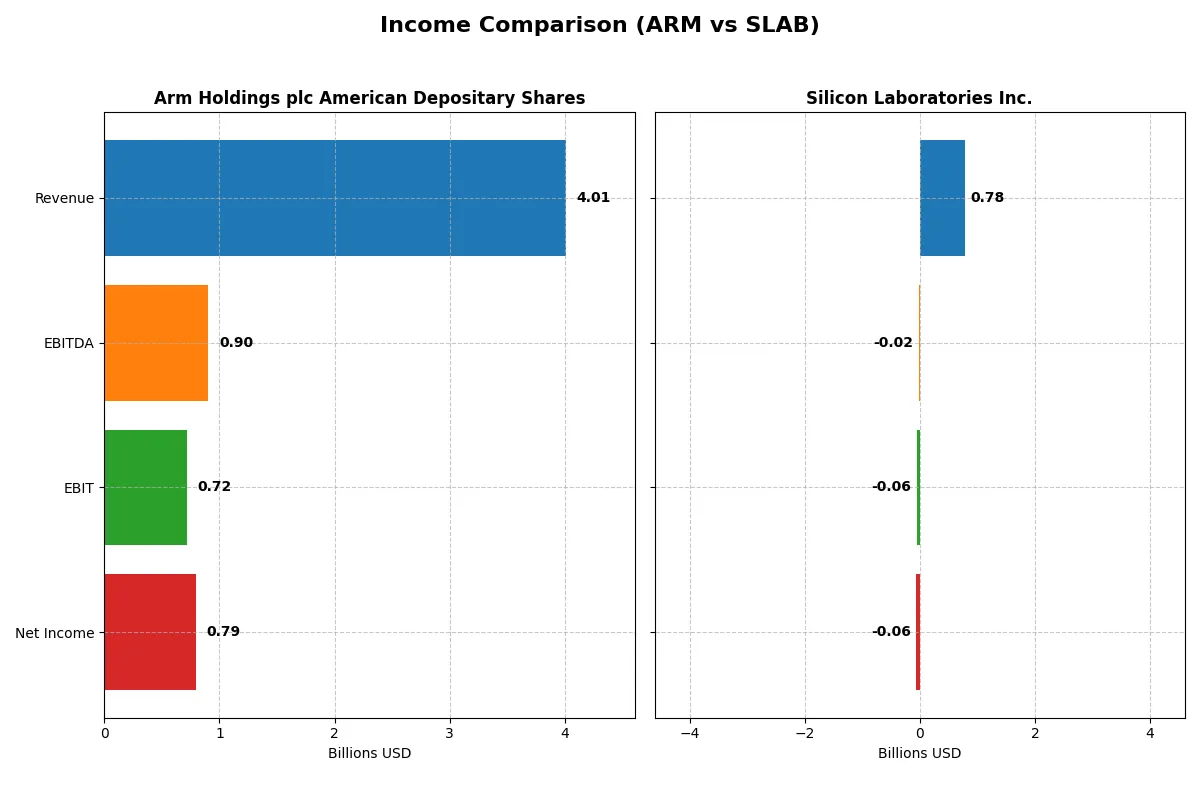
This data dissects the core profitability and scalability of both corporate engines to reveal who dominates the bottom line:
| Metric | Arm Holdings plc American Depositary Shares (ARM) | Silicon Laboratories Inc. (SLAB) |
|---|---|---|
| Revenue | 4.01B | 785M |
| Cost of Revenue | 206M | 328M |
| Operating Expenses | 2.97B | 528M |
| Gross Profit | 3.80B | 457M |
| EBITDA | 903M | -19M |
| EBIT | 720M | -57M |
| Interest Expense | 0 | 975K |
| Net Income | 792M | -65M |
| EPS | 0.75 | -1.98 |
| Fiscal Year | 2025 | 2025 |
Income Statement Analysis: The Bottom-Line Duel
This income statement comparison reveals the true efficiency and profit-generation power of Arm Holdings and Silicon Laboratories over recent years.
Arm Holdings plc American Depositary Shares Analysis
Arm’s revenue nearly doubled from 2.03B in 2021 to 4.01B in 2025, with net income rising from 388M to 792M. The company boasts a stellar gross margin near 95%, reflecting exceptional cost control. Its net margin improved to almost 20%, confirming strong operational leverage and momentum in the latest fiscal year.
Silicon Laboratories Inc. Analysis
Silicon Labs’ revenue increased moderately to 785M in 2025 from 721M in 2021, but net income remained negative, at -65M in 2025, despite some improvement from -191M in 2024. Gross margin stands at 58%, decent for the sector, but negative EBIT and net margins indicate ongoing profitability challenges and operational inefficiencies.
Margin Dominance vs. Profitability Struggles
Arm Holdings clearly leads with robust margin expansion and consistent net income growth, demonstrating superior capital allocation and operational efficiency. Silicon Labs shows revenue growth but continues to struggle with losses and weak margins. For investors, Arm’s profile signals a more reliable and profitable business engine.
Financial Ratios Comparison
These vital ratios act as a diagnostic tool to expose the underlying fiscal health, valuation premiums, and capital efficiency of the companies compared below:
| Ratios | Arm Holdings plc American Depositary Shares (ARM) | Silicon Laboratories Inc. (SLAB) |
|---|---|---|
| ROE | 11.6% | -5.9% |
| ROIC | 10.3% | -6.3% |
| P/E | 142 | -65.9 |
| P/B | 16.4 | 3.91 |
| Current Ratio | 5.20 | 4.69 |
| Quick Ratio | 5.20 | 4.02 |
| D/E | 0.052 | 0 |
| Debt-to-Assets | 3.99% | 0% |
| Interest Coverage | 0 | -72.3 |
| Asset Turnover | 0.45 | 0.62 |
| Fixed Asset Turnover | 5.61 | 6.10 |
| Payout ratio | 0% | 0% |
| Dividend yield | 0% | 0% |
| Fiscal Year | 2025 | 2025 |
Efficiency & Valuation Duel: The Vital Signs
Ratios serve as a company’s financial DNA, exposing hidden risks and revealing operational strengths crucial for investors’ decisions.
Arm Holdings plc American Depositary Shares
Arm reports a solid 19.77% net margin and a neutral 11.58% ROE, but its valuation appears stretched with a P/E of 141.58 and P/B of 16.4. The company shows no dividend yield, instead reinvesting heavily in R&D, with a notable 50.1% revenue allocation, supporting future growth despite slightly unfavorable ROIC versus WACC dynamics.
Silicon Laboratories Inc.
Silicon Labs suffers from negative profitability metrics: net margin at -8.27%, ROE at -5.93%, and ROIC at -6.27%, reflecting operational challenges. It trades at a favorable negative P/E due to losses but has an unfavorable P/B of 3.91. The firm pays no dividends, focusing on R&D reinvestment at 45% of revenue, aiming to reverse its profitability trend.
Premium Valuation vs. Operational Struggles
Arm commands a premium valuation with decent profitability and strong reinvestment, while Silicon Labs faces operational losses despite a low valuation. Arm offers a more balanced risk-reward profile, suited for investors prioritizing growth and stability. Silicon Labs fits those willing to tolerate high risk for potential turnaround gains.
Which one offers the Superior Shareholder Reward?
Arm Holdings (ARM) pays no dividends but invests heavily in growth, boasting a pristine balance sheet with a current ratio of 5.2 and low leverage. Its free cash flow per share stands at $0.17, with no share buybacks reported recently. Silicon Laboratories (SLAB) also pays no dividends but shows inconsistent profitability and negative net margins in recent years. SLAB maintains a robust cash position ($13.6/share) and executes moderate buybacks, but its negative earnings and volatile free cash flow raise sustainability concerns. I conclude ARM offers a superior total return profile in 2026 due to its stronger financial health and reinvestment capability, supporting long-term value creation better than SLAB.
Comparative Score Analysis: The Strategic Profile
The radar chart reveals the fundamental DNA and trade-offs of Arm Holdings plc and Silicon Laboratories Inc., highlighting their core financial strengths and vulnerabilities:
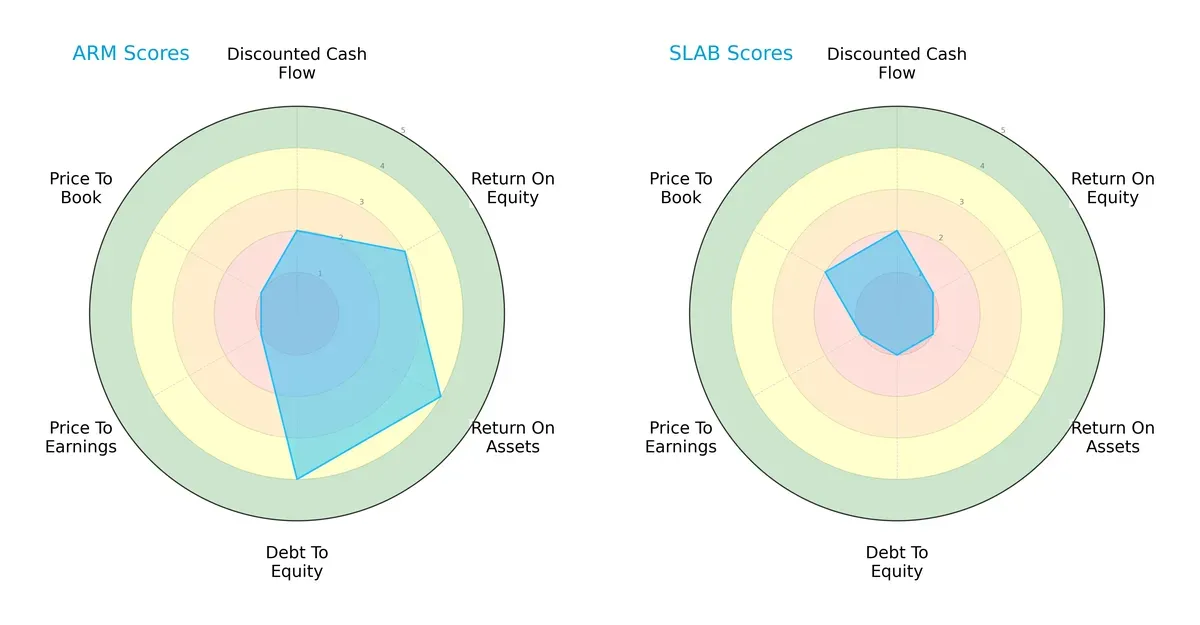
Arm Holdings shows a more balanced profile with favorable scores in return on assets (4) and debt-to-equity (4), indicating efficient asset use and prudent leverage. Silicon Laboratories struggles with low scores across ROE (1), ROA (1), and debt-to-equity (1), signaling operational and financial challenges. Both share weak valuation scores (PE and PB), but Arm’s moderate DCF and ROE scores provide it a strategic edge over Silicon Laboratories’ consistently low marks.
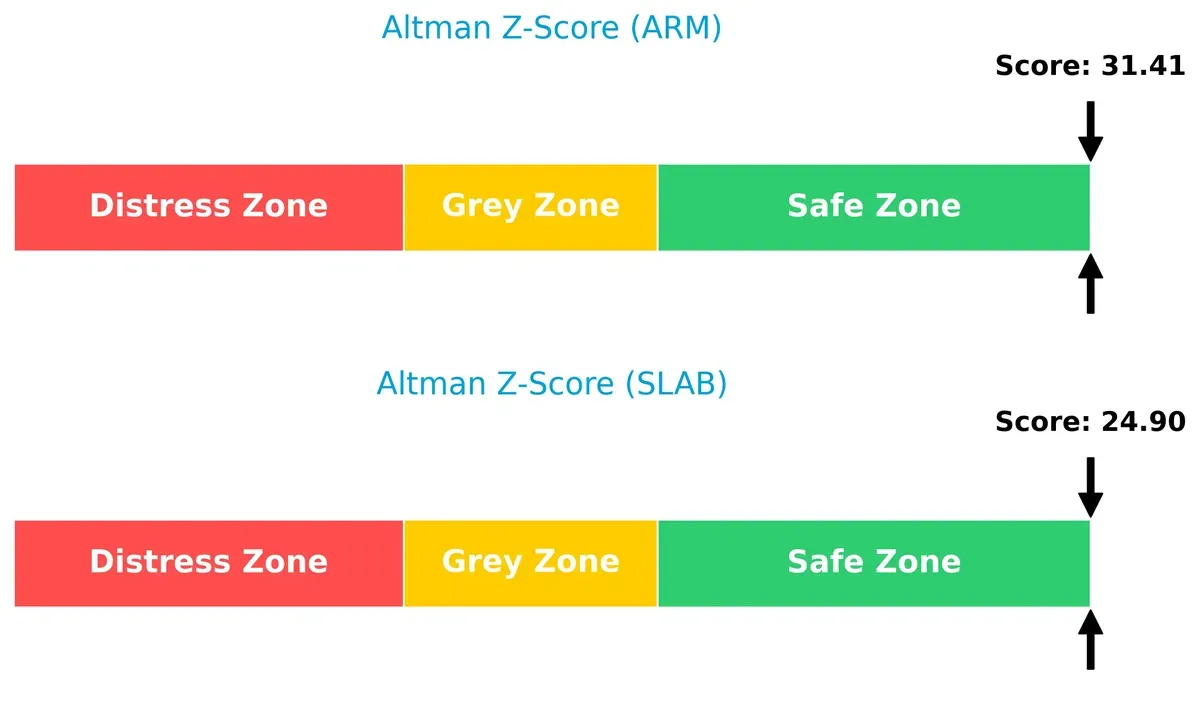
Bankruptcy Risk: Solvency Showdown
Arm Holdings’ Altman Z-Score of 31.4 versus Silicon Laboratories’ 24.9 confirms both firms are firmly in the safe zone, but Arm’s higher score signals superior long-term solvency in this cycle:
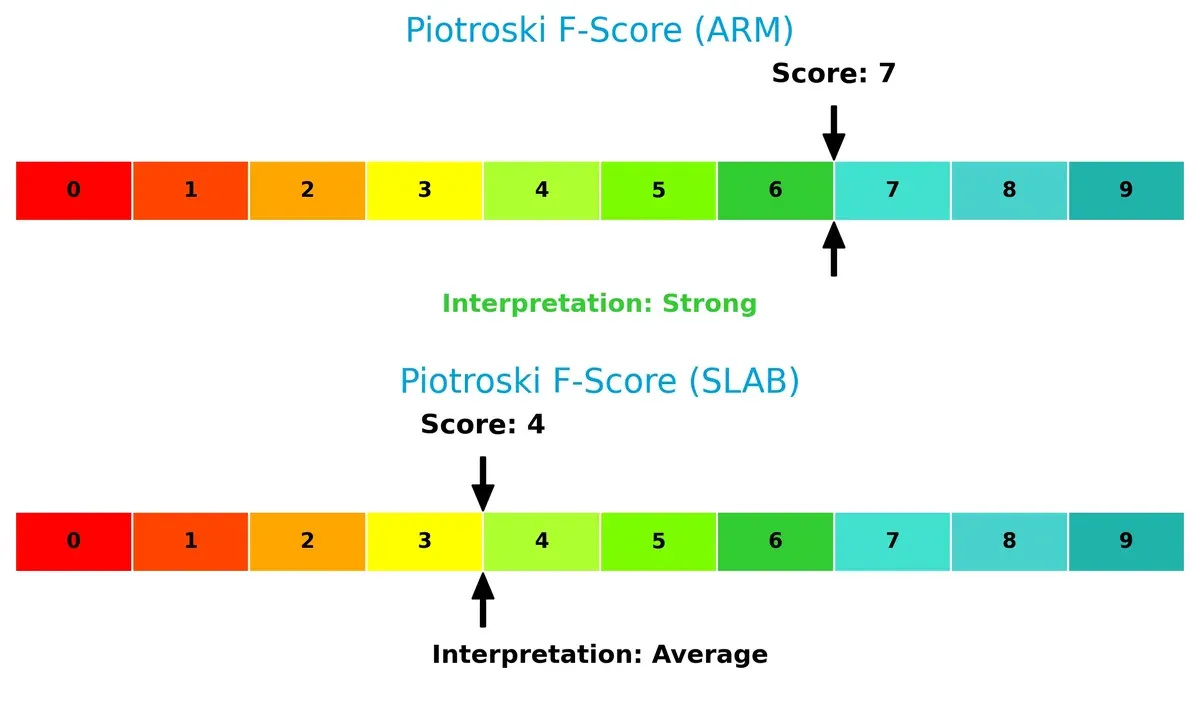
Financial Health: Quality of Operations
Arm’s Piotroski F-Score of 7 indicates strong financial health, while Silicon Laboratories’ score of 4 reveals average strength and potential red flags in operational efficiency or financial quality:
How are the two companies positioned?
This section dissects the operational DNA of Arm and Silicon Laboratories by comparing their revenue distribution by segment and internal dynamics. The goal is to confront their economic moats to identify which model offers the most resilient, sustainable advantage in today’s market.
Revenue Segmentation: The Strategic Mix
This visual comparison dissects how Arm Holdings and Silicon Laboratories diversify their income streams and reveals their primary sector bets:
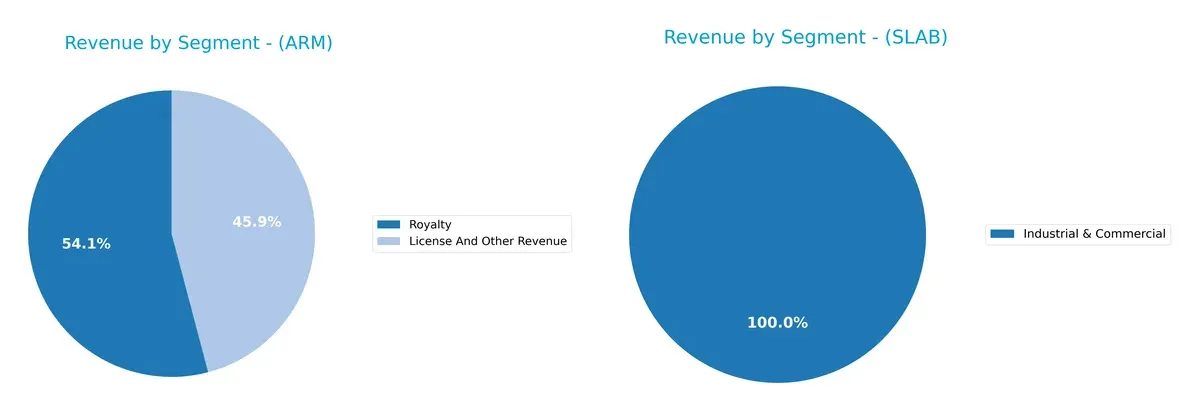
Arm Holdings pivots on two major streams: $2.17B in Royalties and $1.84B in Licenses, showing a balanced yet focused model. Silicon Laboratories relies heavily on a single $339M Industrial & Commercial segment in 2024, indicating concentration risk. Arm’s diversified revenue mix supports ecosystem lock-in, while Silicon Labs’ dependence on one segment may limit resilience amid market shifts.
Strengths and Weaknesses Comparison
This table compares the strengths and weaknesses of Arm and Silicon Laboratories across key financial and strategic metrics:
Arm Strengths
- Strong royalty revenue stream of $2.17B
- High quick ratio at 5.2 indicates liquidity
- Low debt to assets at 3.99% minimizes financial risk
- Favorable interest coverage with infinite value
- Solid fixed asset turnover at 5.61 shows efficient asset use
Silicon Laboratories Strengths
- Favorable price-to-earnings ratio of -65.89 suggests market opportunity
- Zero debt indicates a clean balance sheet
- Favorable quick ratio of 4.02 supports short-term liquidity
- Fixed asset turnover at 6.1 reflects efficient asset utilization
Arm Weaknesses
- Unfavorable ROIC at 10.28% below WACC of 24.41% signals capital inefficiency
- High P/E of 141.58 may indicate overvaluation
- Unfavorable current ratio at 5.2 suggests working capital management concerns
- Negative dividend yield limits income returns
- Moderate net margin at 19.77% and neutral ROE at 11.58%
Silicon Laboratories Weaknesses
- Negative net margin of -8.27% and ROE of -5.93% indicate unprofitability
- Negative ROIC of -6.27% points to poor capital returns
- Unfavorable interest coverage of -58.4 highlights financial distress
- Unfavorable current ratio at 4.69 may restrict operational flexibility
- Unfavorable price-to-book ratio of 3.91 suggests valuation risk
Arm exhibits strong liquidity, low leverage, and efficient asset use but faces challenges with capital returns and valuation. Silicon Laboratories shows asset efficiency and a clean balance sheet but struggles with profitability and financial stability. These contrasts impact each company’s strategic focus on growth and risk management.
The Moat Duel: Analyzing Competitive Defensibility
A structural moat is the only defense preserving long-term profits from relentless competitive pressures. Let’s dissect how Arm and Silicon Laboratories guard their turf:
Arm Holdings plc: Licensing Network Effects
Arm’s core moat stems from its licensing network effect, embedding its CPU architecture across global chipmakers. This translates to high gross margins (95%) and margin stability, despite a value-destroying ROIC vs. WACC gap. New automotive and IoT markets could deepen this moat, but capital inefficiencies cloud the outlook.
Silicon Laboratories Inc.: Niche Analog Expertise
Silicon Labs relies on specialized analog and mixed-signal IP, contrasting Arm’s broad licensing model. Despite strong revenue growth (34%) and expanding gross margins, its negative EBIT and shrinking ROIC trend reveal fragile profitability. Opportunities lie in IoT expansion, yet operational inefficiencies threaten moat durability.
Licensing Network vs. Analog Specialization: The Moat Verdict
Arm’s network-driven licensing moat is wider but currently undermined by poor capital returns. Silicon Labs’ niche expertise is narrower and weaker, with worsening profitability. Arm remains better positioned to defend market share, provided it realigns capital allocation efficiently.
Which stock offers better returns?
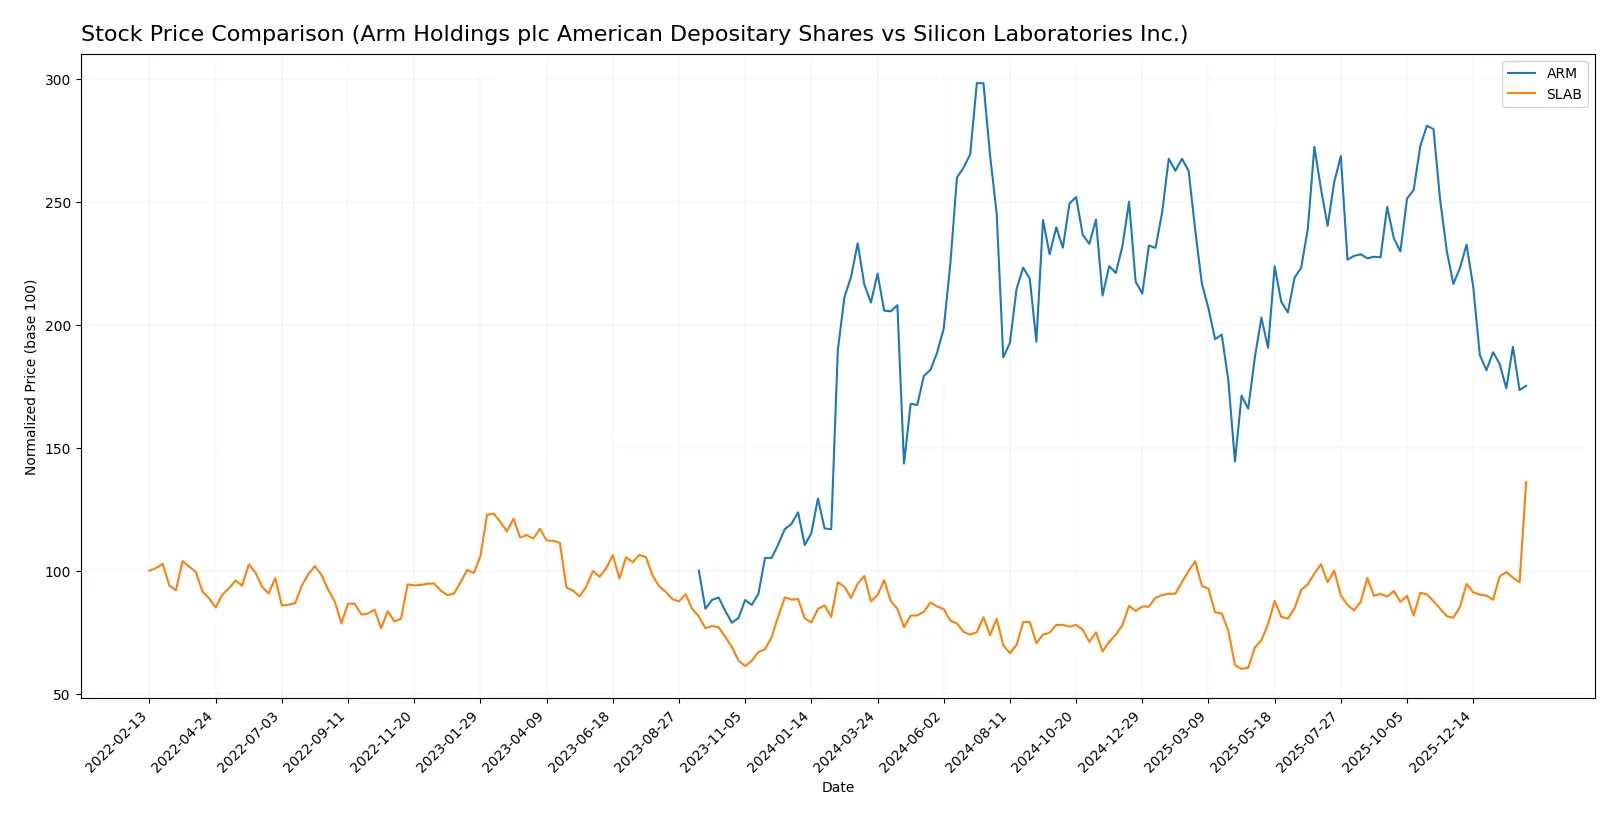
The past year revealed contrasting price dynamics between Arm Holdings and Silicon Laboratories, with Arm showing a pronounced decline while Silicon Laboratories exhibited strong gains and accelerating momentum.
Trend Comparison
Arm Holdings plc experienced a 16.19% price decline over the last 12 months, signaling a bearish trend with decelerating downward momentum. The stock fluctuated widely, ranging from 87.19 to 181.19.
Silicon Laboratories Inc. recorded a robust 55.45% price increase in the same period, indicating a bullish trend with accelerating gains. Its price moved between 89.82 and 203.48, reflecting sustained strength.
Comparing both, Silicon Laboratories clearly outperformed Arm Holdings, delivering the highest market returns and stronger positive momentum throughout the year.
Target Prices
Analysts present optimistic target price ranges for Arm Holdings plc and Silicon Laboratories Inc.
| Company | Target Low | Target High | Consensus |
|---|---|---|---|
| Arm Holdings plc American Depositary Shares | 120 | 170 | 157.5 |
| Silicon Laboratories Inc. | 160 | 231 | 207.33 |
The consensus target prices for both stocks significantly exceed their current market prices, signaling strong analyst confidence and potential upside in the semiconductor sector.

Don’t Let Luck Decide Your Entry Point
Optimize your entry points with our advanced ProRealTime indicators. You’ll get efficient buy signals with precise price targets for maximum performance. Start outperforming now!
How do institutions grade them?
The following tables summarize recent institutional grades for Arm Holdings plc and Silicon Laboratories Inc.:
Arm Holdings plc Grades
This table lists the latest grades issued by established financial institutions for Arm Holdings plc:
| Grading Company | Action | New Grade | Date |
|---|---|---|---|
| Benchmark | Maintain | Hold | 2026-02-05 |
| UBS | Maintain | Buy | 2026-01-26 |
| Wells Fargo | Maintain | Overweight | 2026-01-26 |
| Morgan Stanley | Maintain | Overweight | 2026-01-23 |
| Susquehanna | Upgrade | Positive | 2026-01-21 |
| B of A Securities | Downgrade | Neutral | 2026-01-13 |
| B of A Securities | Maintain | Buy | 2025-12-16 |
| Goldman Sachs | Downgrade | Sell | 2025-12-15 |
| Loop Capital | Maintain | Buy | 2025-11-12 |
| Keybanc | Maintain | Overweight | 2025-11-06 |
Silicon Laboratories Inc. Grades
Below are recent institutional grades for Silicon Laboratories Inc. from recognized financial firms:
| Grading Company | Action | New Grade | Date |
|---|---|---|---|
| Benchmark | Downgrade | Hold | 2026-02-04 |
| Keybanc | Downgrade | Sector Weight | 2026-02-04 |
| Needham | Downgrade | Hold | 2026-02-04 |
| Susquehanna | Maintain | Neutral | 2025-08-06 |
| Morgan Stanley | Maintain | Equal Weight | 2025-08-06 |
| Barclays | Maintain | Equal Weight | 2025-08-05 |
| Susquehanna | Maintain | Neutral | 2025-07-22 |
| Stifel | Maintain | Buy | 2025-07-18 |
| Keybanc | Maintain | Overweight | 2025-07-08 |
| Benchmark | Maintain | Buy | 2025-05-27 |
Which company has the best grades?
Arm Holdings plc generally receives stronger and more recent positive grades, including multiple Buy and Overweight ratings, with only isolated downgrades. Silicon Laboratories Inc. shows a trend of downgrades to Hold or Neutral, with fewer recent Buy ratings. This divergence may influence investors’ confidence and portfolio positioning.
Risks specific to each company
The following categories identify critical pressure points and systemic threats facing Arm Holdings plc and Silicon Laboratories Inc. in the 2026 market environment:
1. Market & Competition
Arm Holdings plc American Depositary Shares
- Operates globally with strong semiconductor IP licensing; faces intense industry innovation cycles and large competitors.
Silicon Laboratories Inc.
- Focuses on analog-intensive mixed-signal solutions with niche IoT applications, but competes with larger diversified semiconductor firms.
2. Capital Structure & Debt
Arm Holdings plc American Depositary Shares
- Very low debt-to-equity at 0.05 and 3.99% debt-to-assets. Strong interest coverage signals low financial risk.
Silicon Laboratories Inc.
- Zero debt, but negative interest coverage at -58.4 suggests operational losses impacting financial health.
3. Stock Volatility
Arm Holdings plc American Depositary Shares
- High beta of 4.37 indicates substantial stock price volatility relative to the market.
Silicon Laboratories Inc.
- Moderate beta of 1.56 reflects more stable stock movements but still some cyclicality.
4. Regulatory & Legal
Arm Holdings plc American Depositary Shares
- Operates across multiple jurisdictions including China and Taiwan, exposing it to regulatory complexity and trade tensions.
Silicon Laboratories Inc.
- Also global, with exposure to US-China relations affecting supply chain and sales, but less geographic spread than Arm.
5. Supply Chain & Operations
Arm Holdings plc American Depositary Shares
- Relies on semiconductor manufacturers worldwide; vulnerable to supply shortages and geopolitical disruptions.
Silicon Laboratories Inc.
- Fabless model reduces direct manufacturing risk but dependent on foundry capacity and raw material availability.
6. ESG & Climate Transition
Arm Holdings plc American Depositary Shares
- Increasing pressure to align IP products with energy-efficient applications amid global climate policies.
Silicon Laboratories Inc.
- Faces growing demand to embed sustainability in IoT products and reduce environmental impact of operations.
7. Geopolitical Exposure
Arm Holdings plc American Depositary Shares
- Significant exposure to UK, US, China, Taiwan, and South Korea; geopolitical tensions pose supply and market risks.
Silicon Laboratories Inc.
- Main exposure in US and China markets; trade policies and sanctions could disrupt sales and supply.
Which company shows a better risk-adjusted profile?
Arm’s most impactful risk lies in its high stock volatility driven by a beta of 4.37, reflecting sensitivity to market swings and geopolitical tensions. Silicon Laboratories faces critical weakness in capital structure and profitability, with negative margins and interest coverage signaling operational distress. Between the two, Arm demonstrates a better risk-adjusted profile supported by strong balance sheet metrics and financial scores. However, its sky-high valuation multiples remain a caution point. Silicon Labs’ deteriorating profitability and financial risk paint a less favorable picture, despite lower stock volatility. The stark contrast in Altman Z-scores and Piotroski scores confirms Arm’s superior financial resilience in 2026.
Final Verdict: Which stock to choose?
Arm Holdings commands attention with its superpower: robust income growth paired with a strong gross margin that signals operational excellence. Its key point of vigilance lies in value destruction, as ROIC consistently trails its cost of capital. Arm fits an aggressive growth portfolio willing to tolerate valuation premiums.
Silicon Laboratories offers a strategic moat through its focused R&D efforts and accelerating revenue growth, supporting a niche innovation edge. Relative to Arm, it presents a more volatile safety profile with negative profitability metrics and value erosion. It appeals to GARP investors seeking turnaround potential at a more reasonable valuation.
If you prioritize stable, high-margin growth with a proven income track record, Arm outshines due to its operational scale despite valuation risks. However, if you seek growth with a contrarian tilt and can weather financial volatility, Silicon Labs offers superior momentum and potential value creation from its innovation pipeline.
Disclaimer: Investment carries a risk of loss of initial capital. The past performance is not a reliable indicator of future results. Be sure to understand risks before making an investment decision.
Go Further
I encourage you to read the complete analyses of Arm Holdings plc American Depositary Shares and Silicon Laboratories Inc. to enhance your investment decisions: