In the rapidly evolving semiconductor industry, Arm Holdings plc and Qnity Electronics, Inc. stand out as key players shaping the future of technology. Arm is renowned for its CPU architectures and licensing model, while Qnity focuses on advanced electronic materials critical for chip manufacturing. Their market overlap and innovation strategies make them compelling choices for investors seeking exposure to tech growth. Let’s explore which company offers the most promising investment opportunity.

Table of contents
Companies Overview
I will begin the comparison between Arm Holdings plc and Qnity Electronics, Inc. by providing an overview of these two companies and their main differences.
Arm Holdings plc Overview
Arm Holdings plc architects, develops, and licenses CPU products and related technologies for semiconductor companies and original equipment manufacturers. Its offerings include microprocessors, systems IPs, GPUs, and software used across markets like automotive, computing infrastructure, consumer tech, and IoT. Founded in 1990 and headquartered in Cambridge, UK, Arm operates globally and is a subsidiary of Kronos II LLC, with a market cap of approximately 111B USD.
Qnity Electronics, Inc. Overview
Qnity Electronics, Inc. provides electronic solutions and advanced materials for semiconductor chip manufacturing. Formerly Novus SpinCo 1, Inc., it rebranded in April 2025 and is based in Wilmington, Delaware. Qnity operates in the technology sector with a market cap near 19.5B USD, focusing on materials critical to semiconductor production. It went public in late 2025 and trades on the NYSE.
Key similarities and differences
Both Arm and Qnity operate within the semiconductor industry and technology sector, serving critical roles in chip development and manufacturing. Arm specializes in designing and licensing semiconductor IP and software, serving a broad product range globally. In contrast, Qnity focuses on supplying advanced electronic materials used in chip fabrication. Their market caps differ significantly, with Arm positioned as a larger, more established global player, while Qnity is a newer, specialized supplier in the US market.
Income Statement Comparison
Below is a comparison of key income statement metrics for Arm Holdings plc American Depositary Shares and Qnity Electronics, Inc. for their most recent fiscal years.
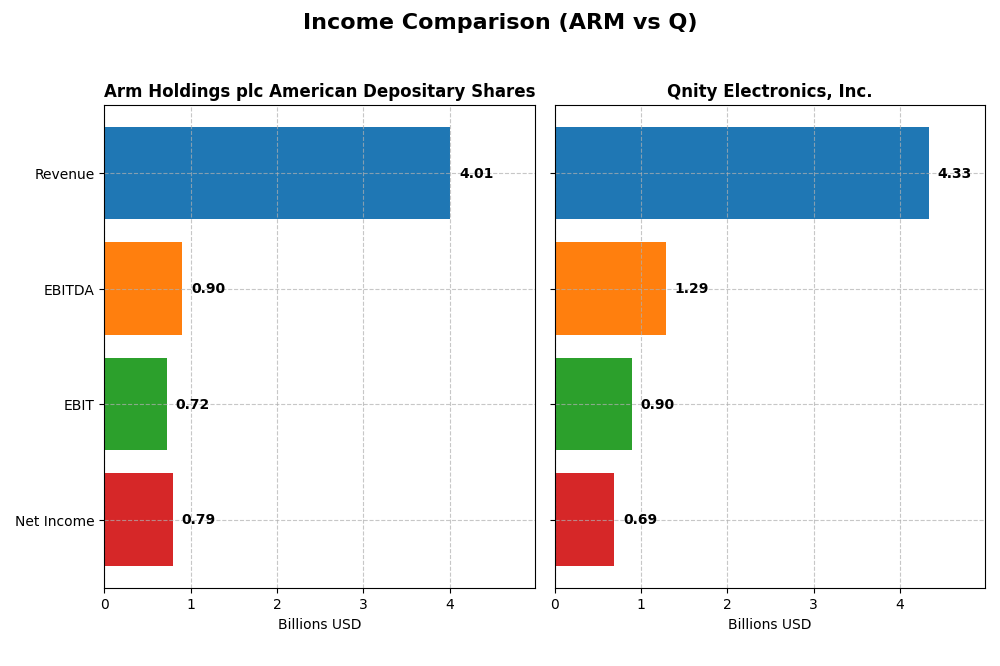
| Metric | Arm Holdings plc American Depositary Shares | Qnity Electronics, Inc. |
|---|---|---|
| Market Cap | 111B | 19.5B |
| Revenue | 4.01B | 4.34B |
| EBITDA | 903M | 1.29B |
| EBIT | 720M | 898M |
| Net Income | 792M | 693M |
| EPS | 0.75 | 3.31 |
| Fiscal Year | 2025 | 2024 |
Income Statement Interpretations
Arm Holdings plc American Depositary Shares
Arm Holdings demonstrated strong growth from 2021 to 2025, nearly doubling revenue from 2.03B to 4.01B USD and increasing net income from 388M to 792M USD. Margins remained robust with a gross margin around 95% and a net margin near 20%, both favorable. In 2025, revenue growth accelerated to 24%, with net income and EPS more than doubling, reflecting significant operational improvements.
Qnity Electronics, Inc.
Qnity Electronics showed mixed performance from 2022 to 2024. Revenue slightly declined overall, dropping from 4.76B to 4.34B USD, while net income decreased from 774M to 693M USD. Margins remained fairly stable, with gross margin around 46% and net margin near 16%, both favorable. The latest year saw moderate revenue growth of 7.4% and net income growth of 36.7%, indicating some recent improvement after prior declines.
Which one has the stronger fundamentals?
Arm Holdings displays stronger fundamentals with consistent revenue and net income growth, very high gross and net margins, and excellent margin expansion in the latest year. Qnity Electronics, while showing some recent improvement, experiences overall revenue and net income declines over the period, with lower margins and a neutral stance on interest expenses. Arm’s financials suggest more favorable income statement trends.
Financial Ratios Comparison
The table below presents a side-by-side comparison of key financial ratios for Arm Holdings plc and Qnity Electronics, Inc. based on their most recent fiscal year data.
| Ratios | Arm Holdings plc (2025) | Qnity Electronics, Inc. (2024) |
|---|---|---|
| ROE | 11.6% | 6.51% |
| ROIC | 10.3% | 5.92% |
| P/E | 142 | 28.8 |
| P/B | 16.4 | 1.88 |
| Current Ratio | 5.20 | 1.77 |
| Quick Ratio | 5.20 | 1.06 |
| D/E (Debt to Equity) | 0.052 | 0.018 |
| Debt-to-Assets | 4.0% | 1.56% |
| Interest Coverage | 0 | 3.03 |
| Asset Turnover | 0.45 | 0.35 |
| Fixed Asset Turnover | 5.61 | 2.59 |
| Payout Ratio | 0 | 0 |
| Dividend Yield | 0% | 0% |
Interpretation of the Ratios
Arm Holdings plc American Depositary Shares
Arm Holdings shows a mixed ratio profile with a favorable net margin of 19.77% but an unfavorable return on invested capital (10.28%) and high weighted average cost of capital (24.3%). Its price-to-earnings ratio at 141.58 and price-to-book at 16.4 suggest expensive valuation. The current ratio is very high at 5.2, signaling possible inefficient asset use. Arm does not pay dividends, likely focusing on reinvestment and growth instead.
Qnity Electronics, Inc.
Qnity Electronics demonstrates a favorable net margin of 15.99% and a low weighted average cost of capital at 5.8%, indicating efficient capital use. However, its return on equity is weak at 6.51%, and the price-to-earnings ratio of 28.8 is somewhat elevated. The current ratio of 1.77 and quick ratio of 1.06 are reasonable. Qnity pays a modest dividend but yields 0%, suggesting limited shareholder returns or recent dividend initiation.
Which one has the best ratios?
Qnity Electronics has a more balanced and slightly favorable ratio profile with lower valuation multiples and a manageable capital structure. Arm Holdings, despite a strong margin, suffers from high valuation multiples and less efficient capital returns, leading to a slightly unfavorable global evaluation. Overall, Qnity’s ratios appear more sustainable and aligned with prudent financial management.
Strategic Positioning
This section compares the strategic positioning of Arm Holdings plc American Depositary Shares (ARM) and Qnity Electronics, Inc. (Q) regarding Market position, Key segments, and Exposure to technological disruption:
Arm Holdings plc American Depositary Shares
- Market position and competitive pressure
- Key segments and business drivers
- Exposure to technological disruption
Qnity Electronics, Inc.
- Large market cap $111B, high beta 4.36, strong NASDAQ presence
- Licenses CPUs, IPs, GPUs for automotive, computing, IoT markets
- Operates in diverse global tech markets, IP licensing model
Arm Holdings plc American Depositary Shares vs Qnity Electronics, Inc. Positioning
ARM’s strategy centers on diversified technology licensing across multiple end markets, leveraging global reach. Q focuses on a more concentrated segment supplying materials for semiconductor manufacturing. ARM’s broad exposure contrasts with Q’s specialized business model, each with inherent strengths and vulnerabilities.
Which has the best competitive advantage?
Based on MOAT evaluation, ARM is shedding value with an unfavorable status, while Q holds a neutral position with stable profitability but no clear competitive advantage. Neither company currently demonstrates a strong economic moat.
Stock Comparison
The stock price movements over the past year reveal contrasting dynamics, with Arm Holdings showing a significant bearish decline while Qnity Electronics exhibits a relatively stable but slightly negative trend.
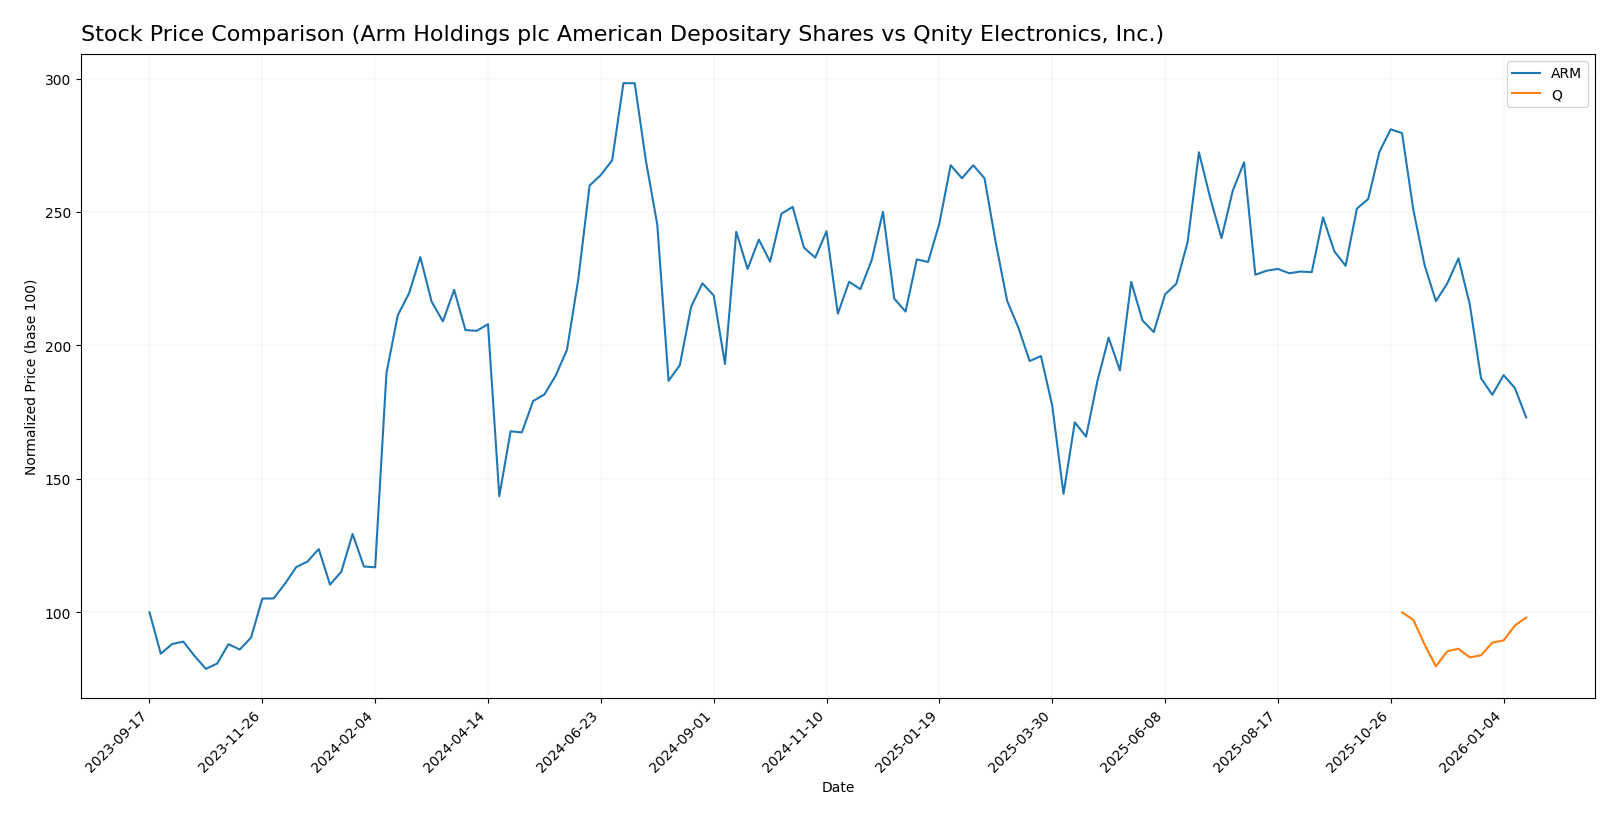
Trend Analysis
Arm Holdings plc American Depositary Shares experienced a bearish trend over the past 12 months, with a price drop of 21.17% and decelerating decline. The stock fluctuated widely, hitting a high of 181.19 and a low of 87.19, with high volatility (std deviation 19.31).
Qnity Electronics, Inc. showed a marginal bearish trend with a 1.98% price decrease over the same period and stable acceleration. The price ranged between 75.8 and 95, with lower volatility (std deviation 5.94) and a near-flat recent slope.
Comparing both, Arm Holdings delivered a more pronounced negative market performance, while Qnity Electronics maintained a near-neutral trend with less volatility and smaller losses.
Target Prices
The current analyst consensus reflects optimistic target prices for both Arm Holdings plc and Qnity Electronics, Inc.
| Company | Target High | Target Low | Consensus |
|---|---|---|---|
| Arm Holdings plc American Depositary Shares | 210 | 120 | 166 |
| Qnity Electronics, Inc. | 117 | 92 | 105.89 |
Analysts project Arm’s price to rise significantly from its current 105.11 USD, while Qnity’s consensus target of 105.89 USD suggests moderate appreciation above its current 93.12 USD price.
Analyst Opinions Comparison
This section compares analysts’ ratings and grades for Arm Holdings plc American Depositary Shares (ARM) and Qnity Electronics, Inc. (Q):
Rating Comparison
ARM Rating
- Rating: B, classified as Very Favorable.
- Discounted Cash Flow Score: 3, Moderate valuation based on future cash flows.
- ROE Score: 3, Moderate efficiency in generating profit from equity.
- ROA Score: 4, Favorable asset utilization to generate earnings.
- Debt To Equity Score: 4, Favorable financial risk profile with lower leverage.
- Overall Score: 3, Moderate overall financial standing.
Q Rating
- Rating: B+, classified as Very Favorable.
- Discounted Cash Flow Score: 4, Favorable valuation on future cash flows.
- ROE Score: 3, Moderate efficiency in generating profit from equity.
- ROA Score: 4, Favorable asset utilization to generate earnings.
- Debt To Equity Score: 3, Moderate financial risk profile with more leverage.
- Overall Score: 3, Moderate overall financial standing.
Which one is the best rated?
Q holds a slightly higher rating at B+ compared to ARM’s B, with a more favorable discounted cash flow score. ARM shows a stronger debt to equity score, but both have identical overall and profitability scores.
Scores Comparison
Here is the comparison of the Altman Z-Score and Piotroski Score for the two companies:
ARM Scores
- Altman Z-Score: 32.43, indicating safe zone with very low bankruptcy risk.
- Piotroski Score: 7, classified as strong financial health.
Q Scores
- No data available for Altman Z-Score.
- No data available for Piotroski Score.
Which company has the best scores?
Based on the available data, ARM shows a very high Altman Z-Score, placing it firmly in the safe zone, and a strong Piotroski Score of 7. Q lacks any score data, so ARM clearly has the better documented financial scores.
Grades Comparison
The following section compares the recent grades assigned to Arm Holdings plc American Depositary Shares and Qnity Electronics, Inc.:
Arm Holdings plc American Depositary Shares Grades
The table below summarizes recent grades from reputable financial institutions for Arm Holdings plc American Depositary Shares.
| Grading Company | Action | New Grade | Date |
|---|---|---|---|
| B of A Securities | Downgrade | Neutral | 2026-01-13 |
| B of A Securities | Maintain | Buy | 2025-12-16 |
| Goldman Sachs | Downgrade | Sell | 2025-12-15 |
| Loop Capital | Maintain | Buy | 2025-11-12 |
| TD Cowen | Maintain | Buy | 2025-11-06 |
| Rosenblatt | Maintain | Buy | 2025-11-06 |
| Wells Fargo | Maintain | Overweight | 2025-11-06 |
| Mizuho | Maintain | Outperform | 2025-11-06 |
| Barclays | Maintain | Overweight | 2025-11-06 |
| UBS | Maintain | Buy | 2025-11-06 |
Overall, Arm Holdings shows a predominantly positive grading trend, with several firms maintaining Buy or better ratings despite recent downgrades from B of A Securities and Goldman Sachs.
Qnity Electronics, Inc. Grades
The table below presents recent grades from recognized grading firms for Qnity Electronics, Inc.
| Grading Company | Action | New Grade | Date |
|---|---|---|---|
| RBC Capital | Maintain | Outperform | 2025-11-25 |
| Mizuho | Maintain | Outperform | 2025-11-20 |
Qnity Electronics displays consistent positive grades, with all current ratings at Outperform and no downgrades reported.
Which company has the best grades?
Both companies hold positive consensus ratings, but Qnity Electronics has a more uniformly strong grading profile with Outperform ratings exclusively, while Arm Holdings presents a broader range including some recent downgrades. Investors might interpret Qnity’s steadier grades as signaling more consistent analyst confidence, whereas Arm’s mixed signals could imply higher uncertainty or transition risk.
Strengths and Weaknesses
Below is a comparison table outlining the key strengths and weaknesses of Arm Holdings plc (ARM) and Qnity Electronics, Inc. (Q) based on the latest financial and operational data.
| Criterion | Arm Holdings plc (ARM) | Qnity Electronics, Inc. (Q) |
|---|---|---|
| Diversification | Moderate: Revenue mainly from licensing and royalties ($4.0B total in 2025) | Limited: No detailed product segmentation data available |
| Profitability | Net margin strong at 19.77%, but ROIC unfavorable (10.28% < WACC 24.3%) | Net margin solid at 15.99%, ROIC slightly favorable at 5.92% vs WACC 5.8% |
| Innovation | High: Known for semiconductor IP leadership, but high PE (141.58) reflects expensive valuation | Moderate: PE at 28.8 indicates less market premium on innovation |
| Global presence | Strong: Global licensing footprint and partnerships | Moderate: Global presence less clear due to limited data |
| Market Share | Significant in semiconductor IP licensing | Smaller niche player with stable but limited market visibility |
Key takeaways: ARM excels in profitability and global reach but struggles with value creation due to high capital costs. Q shows stable profitability and a slightly favorable moat but lacks diversification and strong innovation signals. Both require careful risk assessment before investment.
Risk Analysis
Below is a comparison of key risks for Arm Holdings plc (ARM) and Qnity Electronics, Inc. (Q) based on the most recent data.
| Metric | Arm Holdings plc (ARM) | Qnity Electronics, Inc. (Q) |
|---|---|---|
| Market Risk | High beta (4.36) indicates high volatility and sensitivity to market swings | Beta unavailable, but recent high price change suggests moderate volatility |
| Debt level | Very low debt-to-equity (0.05) and debt-to-assets (3.99%) indicate strong financial stability | Very low debt-to-equity (0.02) and debt-to-assets (1.56%), low financial risk |
| Regulatory Risk | Exposure to multiple international markets, including China, creates regulatory complexity | US-based, potentially less regulatory complexity but subject to semiconductor industry regulations |
| Operational Risk | Moderate operational risk due to extensive global operations and supply chain complexity | Moderate, as a newer company with less operational history and smaller scale |
| Environmental Risk | Industry-related environmental impacts; no specific disclosures but semiconductor manufacturing has inherent risks | Similar sector risks; limited data on environmental policies due to recent IPO |
| Geopolitical Risk | Significant exposure to geopolitical tensions in Asia-Pacific markets, especially China | Primarily US-focused, lower geopolitical risk but sensitive to US-China trade policies impacting semiconductors |
In synthesis, Arm Holdings faces higher market and geopolitical risks due to its global footprint and high beta, which can amplify market swings. Both companies maintain low debt levels, reducing financial risk. Regulatory and operational risks are moderate, with Arm having more international exposure. Environmental risks remain typical for semiconductor firms but lack detailed disclosures. Investors should weigh Arm’s growth prospects against its volatility and geopolitical exposure, while Q offers a more stable debt profile but less operational track record.
Which Stock to Choose?
Arm Holdings plc (ARM) shows strong income growth with a 23.94% revenue increase in 2025 and favorable margins, including a 19.77% net margin. Its profitability is moderate with an 11.58% ROE, low debt, and a very favorable B rating, though some financial ratios are slightly unfavorable.
Qnity Electronics, Inc. (Q) presents moderate income growth and favorable profitability metrics, including a 15.99% net margin and stable returns. It carries low debt with a slightly favorable global ratio evaluation and a very favorable B+ rating, reflecting financial stability and moderate valuation.
Investors seeking growth might find ARM appealing due to its robust income growth and strong rating, while those prioritizing financial stability and slightly favorable ratios may view Q as more suitable. The choice could depend on risk tolerance and investment strategy.
Disclaimer: Investment carries a risk of loss of initial capital. The past performance is not a reliable indicator of future results. Be sure to understand risks before making an investment decision.
Go Further
I encourage you to read the complete analyses of Arm Holdings plc American Depositary Shares and Qnity Electronics, Inc. to enhance your investment decisions: