Home > Comparison > Technology > ARM vs NXPI
The strategic rivalry between Arm Holdings plc and NXP Semiconductors defines the current trajectory of the semiconductor industry. Arm operates as a leading architect and licensor of CPU designs, emphasizing intellectual property and innovation. NXP, meanwhile, is a diversified semiconductor manufacturer with a broad product portfolio spanning automotive to IoT. This analysis will identify which company’s business model delivers the superior risk-adjusted return potential for a balanced technology portfolio.

Table of contents
Companies Overview
Arm Holdings plc and NXP Semiconductors N.V. stand as pivotal innovators in the global semiconductor industry.
Arm Holdings plc: Architect of Semiconductor Innovation
Arm Holdings dominates semiconductor IP licensing, designing CPUs and GPUs that power devices worldwide. Its revenue stems from licensing fees and royalties from semiconductor firms and OEMs. In 2026, Arm’s strategic focus sharpens on expanding its architectural footprint across automotive, IoT, and computing infrastructure markets, capitalizing on its cutting-edge system IP portfolio.
NXP Semiconductors N.V.: Diverse Semiconductor Solutions Leader
NXP Semiconductors excels in integrated semiconductor products, offering microcontrollers, wireless connectivity, and sensors. Its diversified product line generates revenue through direct sales to OEMs, contract manufacturers, and distributors. In 2026, NXP targets growth in automotive and industrial IoT sectors, leveraging its broad technology stack and scale to deepen market penetration.
Strategic Collision: Similarities & Divergences
Arm and NXP both drive innovation in semiconductors but differ fundamentally: Arm champions a licensing model emphasizing open architecture adoption, while NXP focuses on vertically integrated product sales. Their primary battleground is the expanding automotive and IoT markets, where IP licensing meets integrated hardware solutions. This divergence shapes distinct investment profiles—Arm as a high-beta growth play; NXP offering steadier, dividend-paying exposure.
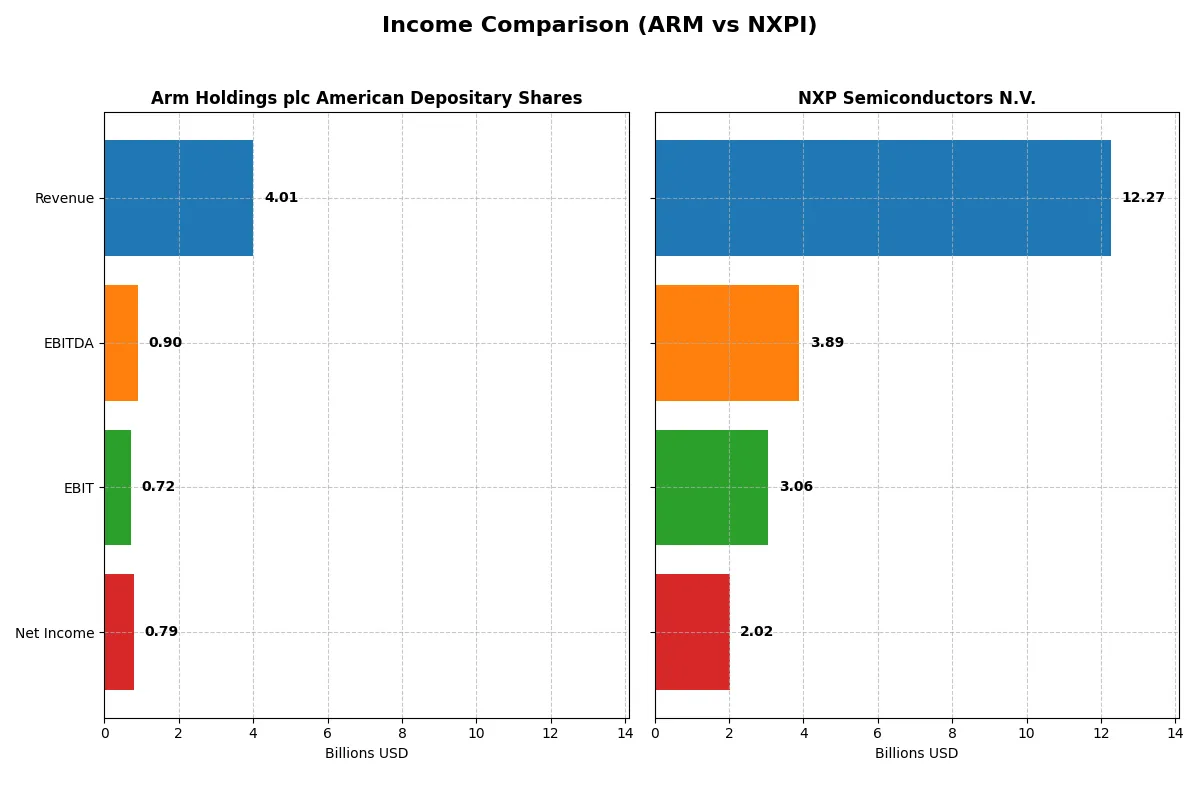
Income Statement Comparison
The following data dissects the core profitability and scalability of both corporate engines to reveal who dominates the bottom line:
| Metric | Arm Holdings plc American Depositary Shares (ARM) | NXP Semiconductors N.V. (NXPI) |
|---|---|---|
| Revenue | 4B | 12.3B |
| Cost of Revenue | 206M | 5.6B |
| Operating Expenses | 3B | 3.4B |
| Gross Profit | 3.8B | 6.7B |
| EBITDA | 903M | 3.9B |
| EBIT | 720M | 3.1B |
| Interest Expense | 0 | 384M |
| Net Income | 792M | 2B |
| EPS | 0.75 | 8 |
| Fiscal Year | 2025 | 2025 |
Income Statement Analysis: The Bottom-Line Duel
This income statement comparison uncovers the true operational efficiency and growth momentum of two semiconductor leaders over recent years.
Arm Holdings plc American Depositary Shares Analysis
Arm’s revenue surged from 2.03B in 2021 to 4.01B in 2025, nearly doubling over five years. Net income followed, climbing from 388M to 792M, reflecting strong profit growth. Its gross margin remains exceptionally high at 94.9%, while net margin improved to 19.8%, signaling robust cost control and operational leverage in 2025.
NXP Semiconductors N.V. Analysis
NXP reported revenue growth from 11.06B in 2021 to 12.27B in 2025, a more modest 11% increase. Net income reached 2.02B in 2025, up from 1.87B in 2021, but declined slightly from the prior year. Gross margin stands at 54.4%, with a net margin of 16.5%, reflecting solid profitability but signs of margin compression in the latest period.
Growth Momentum vs. Scale and Margin Efficiency
Arm demonstrates superior growth and margin expansion, nearly doubling revenue and net income with a striking gross margin advantage over NXP. Meanwhile, NXP commands larger scale and higher absolute profits but faces recent declines in revenue and earnings growth. For investors, Arm’s profile offers dynamic growth and margin strength, whereas NXP’s appeal lies in its scale and established profitability.
Financial Ratios Comparison
These vital ratios act as a diagnostic tool to expose the underlying fiscal health, valuation premiums, and capital efficiency of the companies compared below:
| Ratios | Arm Holdings plc (ARM) | NXP Semiconductors N.V. (NXPI) |
|---|---|---|
| ROE | 11.6% | 20.1% |
| ROIC | 10.3% | 11.0% |
| P/E | 142 | 27.1 |
| P/B | 16.4 | 5.45 |
| Current Ratio | 5.20 | 2.05 |
| Quick Ratio | 5.20 | 1.38 |
| D/E | 0.052 | 1.22 |
| Debt-to-Assets | 4.0% | 46.0% |
| Interest Coverage | 0 | 8.62 |
| Asset Turnover | 0.45 | 0.46 |
| Fixed Asset Turnover | 5.61 | 4.12 |
| Payout ratio | 0 | 51% |
| Dividend yield | 0% | 1.87% |
| Fiscal Year | 2025 | 2025 |
Efficiency & Valuation Duel: The Vital Signs
Ratios act as a company’s DNA, uncovering hidden risks and operational strengths that shape investment decisions.
Arm Holdings plc American Depositary Shares
Arm shows moderate profitability with an 11.58% ROE and a strong 19.77% net margin, but its valuation appears stretched with a P/E of 141.58 and P/B of 16.4. The firm avoids dividends, channeling capital aggressively into R&D, evident from 50% revenue spent there, aiming for long-term growth despite an unfavorable ROIC versus WACC spread.
NXP Semiconductors N.V.
NXP delivers robust profitability, boasting a 20.1% ROE and a solid 16.47% net margin. Its valuation is more reasonable, with a P/E of 27.14 and P/B of 5.45, though still on the higher side. NXP maintains a 1.87% dividend yield, balancing shareholder returns with investments in R&D at roughly 18% of revenue, supporting steady operational efficiency and growth.
Premium Valuation vs. Operational Safety
NXP offers a better balance of profitability and valuation, with stronger returns and a manageable dividend, while Arm’s premium multiples highlight growth ambitions offset by operational risks. Investors prioritizing stability may prefer NXP’s profile; those seeking aggressive innovation might lean toward Arm.
Which one offers the Superior Shareholder Reward?
Arm Holdings (ARM) pays no dividends but reinvests heavily in R&D and growth, reflecting its high valuation with a P/E above 140 and zero payout ratio. NXP Semiconductors (NXPI) combines a 1.9% dividend yield with a moderate 41% payout ratio and robust buybacks, supported by steady free cash flow near 9.6B. I see NXPI’s balanced yield and buyback intensity as a more sustainable shareholder reward model in 2026. ARM’s reinvestment strategy suits growth-focused investors but lacks immediate income. Overall, NXPI offers the superior total return profile with consistent cash returns and disciplined capital allocation.
Comparative Score Analysis: The Strategic Profile
The radar chart reveals the fundamental DNA and trade-offs of Arm Holdings plc and NXP Semiconductors N.V., highlighting their distinct financial strengths and vulnerabilities:
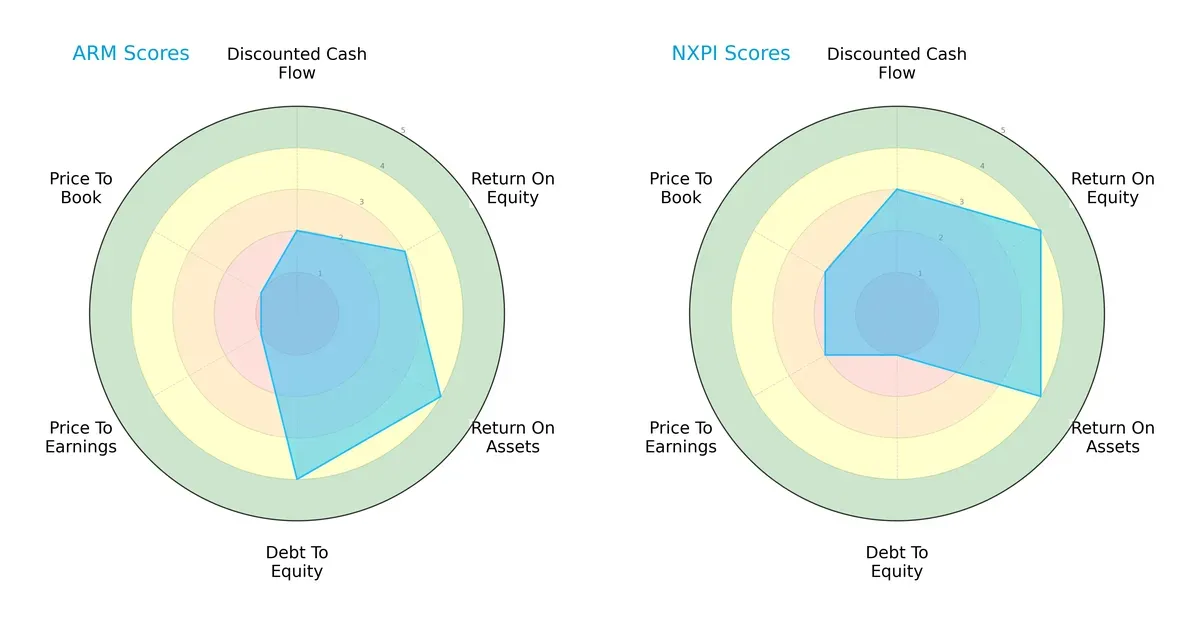
Arm shows strong asset utilization and a solid debt profile, with ROA and Debt/Equity scores at 4 each. However, it struggles on valuation metrics, scoring very low on P/E and P/B ratios. NXP shines with higher profitability scores—ROE at 4 and ROA also at 4—but carries a heavier debt burden, reflected in a weak Debt/Equity score of 1. NXP offers a more balanced valuation profile, scoring moderately on P/E and P/B. Overall, Arm relies on conservative leverage and operational efficiency, while NXP leverages profitability gains despite higher financial risk.
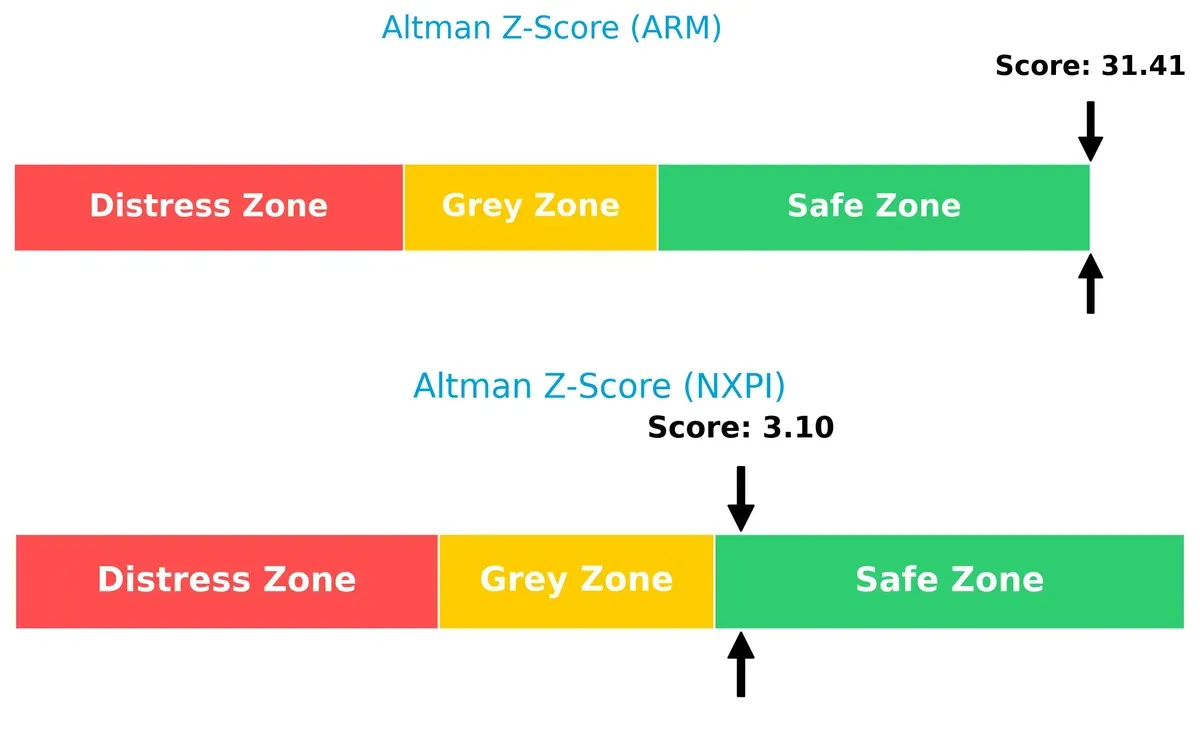
Bankruptcy Risk: Solvency Showdown
Arm’s Altman Z-Score of 31.4 versus NXP’s 3.1 places both companies safely above distress thresholds, but Arm’s extremely high score signals exceptional solvency and lower bankruptcy risk in this cycle:
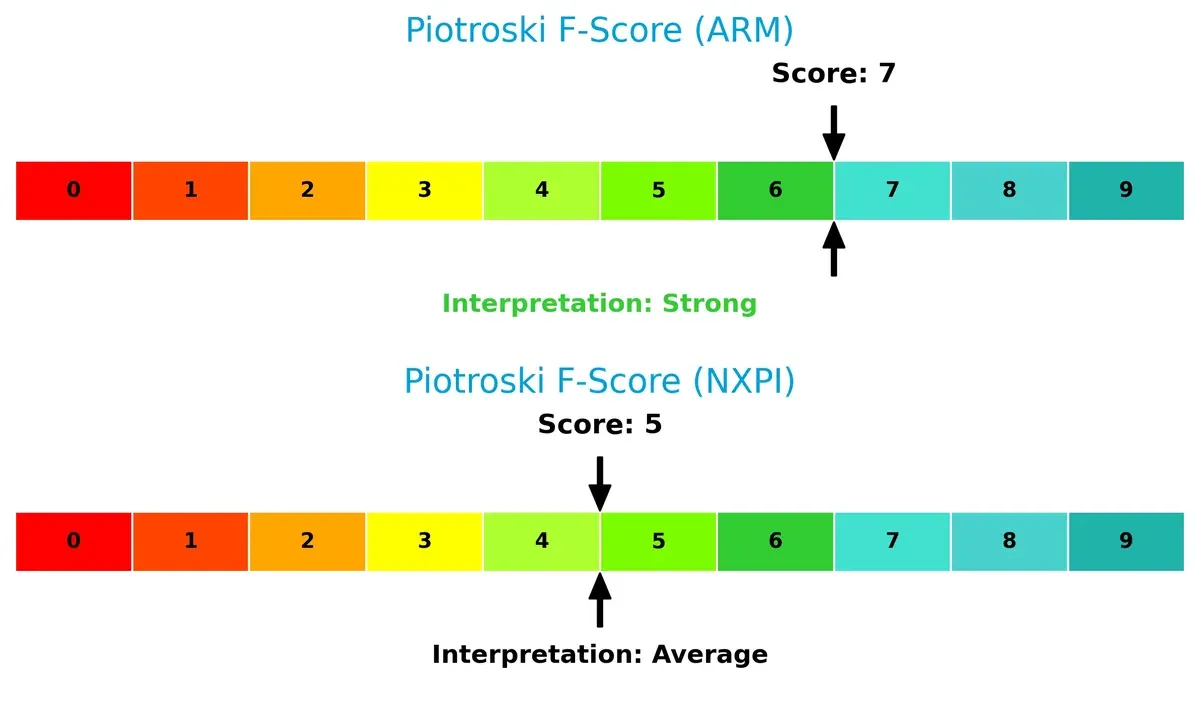
Financial Health: Quality of Operations
Arm’s Piotroski F-Score of 7 indicates strong financial health and operational robustness, surpassing NXP’s average score of 5. This suggests Arm manages profitability, leverage, and liquidity more prudently, while NXP may face moderate internal risks:
How are the two companies positioned?
This section dissects the operational DNA of Arm and NXP by comparing their revenue distribution and internal dynamics. The goal is to confront their economic moats to identify which business model offers the most resilient competitive advantage.
Revenue Segmentation: The Strategic Mix
This visual comparison dissects how Arm Holdings and NXP Semiconductors diversify their income streams and where their primary sector bets lie:
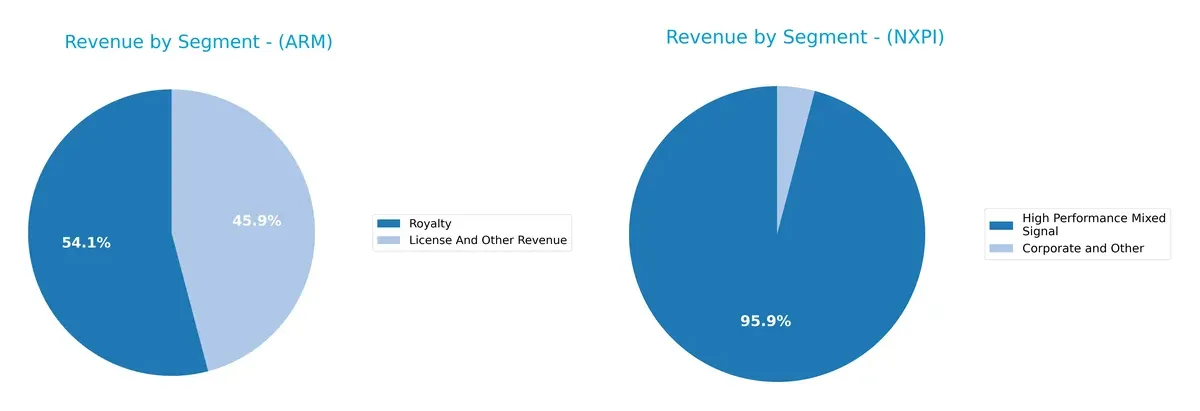
Arm Holdings anchors its revenue in two main segments: $2.17B royalties and $1.84B license fees, showing a focused model on IP monetization. NXP Semiconductors, with $9.02B in High Performance Mixed Signal and $1.28B in other segments, displays a more diversified mix rooted in hardware solutions. Arm’s reliance on licensing risks concentration, while NXP’s broader base underpins infrastructure dominance and ecosystem lock-in.
Strengths and Weaknesses Comparison
This table compares the Strengths and Weaknesses of Arm Holdings plc and NXP Semiconductors N.V.:
Arm Holdings plc Strengths
- High net margin at 19.77%
- Very low debt-to-assets ratio at 3.99%
- Strong quick ratio of 5.2
- Favorable interest coverage with infinite value
- High fixed asset turnover at 5.61 times
- Significant revenue from licensing and royalties
NXP Semiconductors N.V. Strengths
- Favorable net margin of 16.47%
- Strong ROE at 20.1% and ROIC at 11.03%
- Healthy current ratio at 2.05
- Good interest coverage at 7.97 times
- Diverse global revenue across multiple countries
- Large High Performance Mixed Signal segment generates billions
Arm Holdings plc Weaknesses
- Unfavorable ROIC below WACC, indicating poor capital returns
- High WACC at 24.41% suggests expensive capital
- Extremely high P/E ratio of 141.58 raises valuation concerns
- Elevated PB ratio at 16.4 indicates expensive equity
- Very high current ratio at 5.2 may signal inefficient asset use
- Asset turnover low at 0.45 times limits operational efficiency
NXP Semiconductors N.V. Weaknesses
- P/E ratio of 27.14 and PB ratio of 5.45 are relatively high
- Debt-to-equity ratio at 1.22 raises leverage concerns
- Asset turnover at 0.46 times remains low
- Dividend yield at 1.87% is modest, neutral for income investors
- Debt-to-assets ratio at 46.02% signals moderate leverage risk
Overall, Arm shows strong liquidity and low leverage but struggles with capital efficiency and valuation metrics. NXP demonstrates robust profitability and global diversification but carries higher leverage and valuation risks. These contrasts highlight differing strategic challenges in balancing growth, capital structure, and operational efficiency.
The Moat Duel: Analyzing Competitive Defensibility
A structural moat is the only thing protecting long-term profits from relentless competition and market disruption:
Arm Holdings plc: Intellectual Property Licensing Moat
Arm’s competitive advantage stems from its vast portfolio of processor IP licenses. This moat shows in margin stability with a 94.9% gross margin. Expansion into automotive and IoT sectors in 2026 could deepen its licensing dominance.
NXP Semiconductors N.V.: Diversified Product Integration Moat
NXP’s moat lies in its wide semiconductor mix and automotive focus, contrasting Arm’s IP model. Despite higher EBIT margin (24.95%), declining revenue signals pressure. Growth hinges on capturing emerging markets and IoT connectivity.
Licensing Dominance vs. Product Diversification: The Moat Face-off
Arm’s licensing model generates wider moat benefits through scalable margins and recurring royalties. NXP’s product moat is narrower and challenged by recent declining returns. Arm is better positioned to defend and grow its market share in 2026.
Which stock offers better returns?
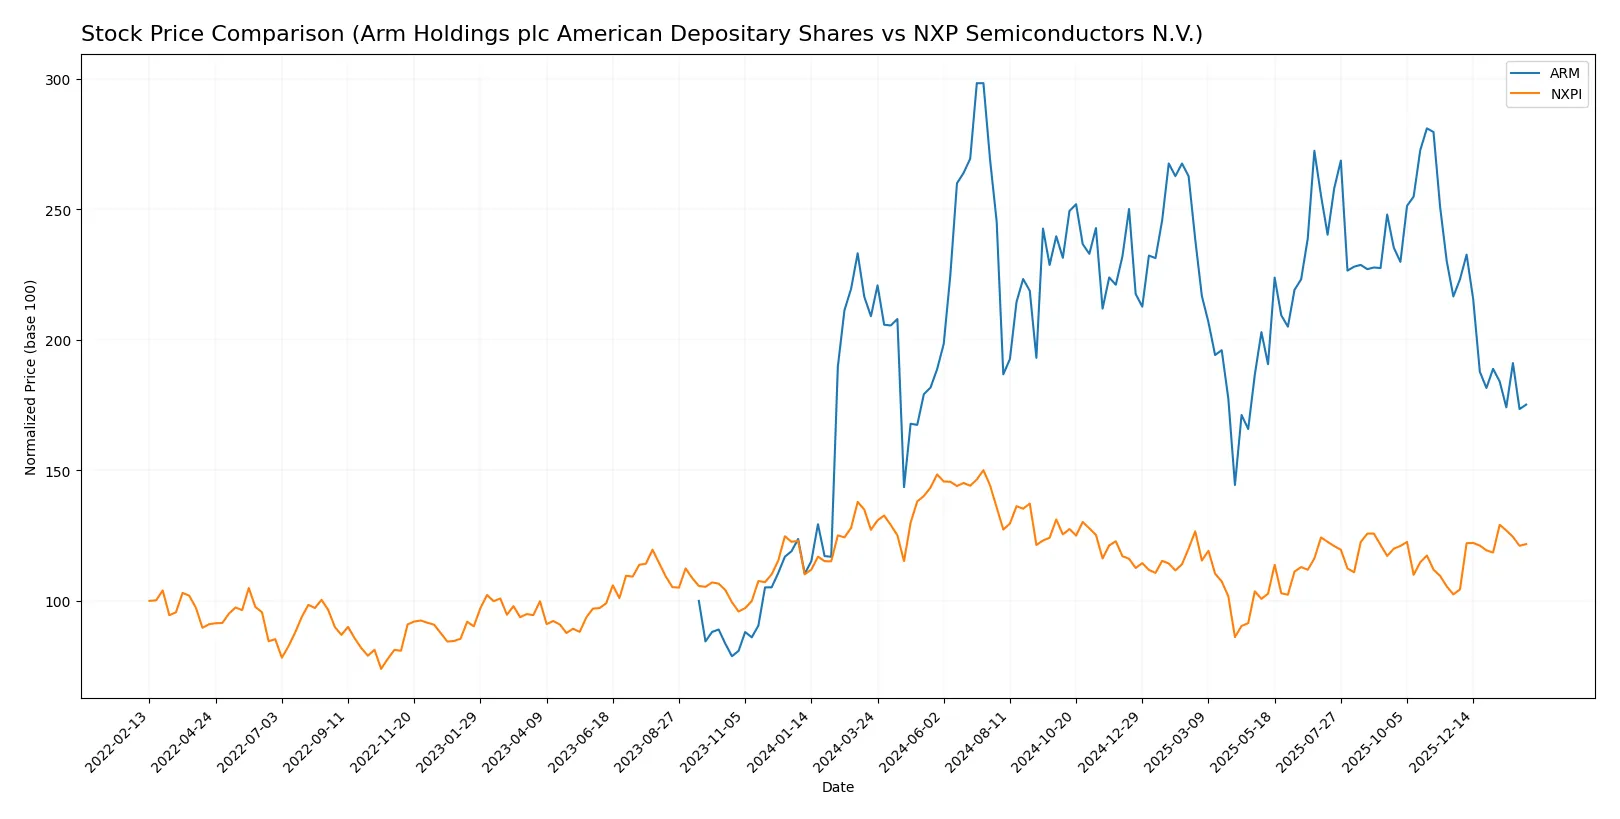
Over the past year, both Arm Holdings and NXP Semiconductors experienced notable price declines, with Arm showing a sharper fall and sustained selling pressure in recent months.
Trend Comparison
Arm Holdings’ stock fell 16.19% over the past year, marking a bearish trend with deceleration. It reached highs of 181.19 and lows of 87.19, showing strong volatility (19.83 std dev).
NXP Semiconductors declined 4.31% annually, also bearish but accelerating. Its price ranged from 160.81 to 280.19, with higher volatility (24.1 std dev) and a recent rebound of 18.79%.
NXP’s trend shows less overall loss and recent strength, outperforming Arm, which faces deeper declines and seller dominance in recent trading sessions.
Target Prices
Analysts show a bullish target consensus for both Arm Holdings plc and NXP Semiconductors N.V.
| Company | Target Low | Target High | Consensus |
|---|---|---|---|
| Arm Holdings plc American Depositary Shares | 120 | 170 | 157.5 |
| NXP Semiconductors N.V. | 215 | 280 | 250 |
The target consensus for Arm exceeds its current price of $103.73 by over 50%, signaling strong growth expectations. NXP’s consensus at $250 also suggests upside from its $228.09 market price, reflecting positive analyst sentiment.

Don’t Let Luck Decide Your Entry Point
Optimize your entry points with our advanced ProRealTime indicators. You’ll get efficient buy signals with precise price targets for maximum performance. Start outperforming now!
How do institutions grade them?
The following tables summarize recent institutional grades for Arm Holdings plc and NXP Semiconductors N.V.:
Arm Holdings plc American Depositary Shares Grades
This table shows recent grade actions from reputable grading companies for Arm Holdings plc:
| Grading Company | Action | New Grade | Date |
|---|---|---|---|
| Benchmark | Maintain | Hold | 2026-02-05 |
| UBS | Maintain | Buy | 2026-01-26 |
| Wells Fargo | Maintain | Overweight | 2026-01-26 |
| Morgan Stanley | Maintain | Overweight | 2026-01-23 |
| Susquehanna | Upgrade | Positive | 2026-01-21 |
| B of A Securities | Downgrade | Neutral | 2026-01-13 |
| B of A Securities | Maintain | Buy | 2025-12-16 |
| Goldman Sachs | Downgrade | Sell | 2025-12-15 |
| Loop Capital | Maintain | Buy | 2025-11-12 |
| Keybanc | Maintain | Overweight | 2025-11-06 |
NXP Semiconductors N.V. Grades
This table shows recent grade actions from reputable grading companies for NXP Semiconductors N.V.:
| Grading Company | Action | New Grade | Date |
|---|---|---|---|
| Truist Securities | Maintain | Buy | 2026-02-04 |
| Mizuho | Maintain | Outperform | 2026-02-04 |
| B of A Securities | Maintain | Buy | 2026-02-04 |
| JP Morgan | Maintain | Neutral | 2026-02-04 |
| Evercore ISI Group | Maintain | Outperform | 2026-02-04 |
| Citigroup | Maintain | Buy | 2026-02-04 |
| Needham | Maintain | Buy | 2026-02-03 |
| Wells Fargo | Maintain | Overweight | 2026-01-15 |
| Citigroup | Maintain | Buy | 2026-01-15 |
| Truist Securities | Maintain | Buy | 2025-12-19 |
Which company has the best grades?
NXP Semiconductors consistently receives “Buy” and “Outperform” ratings from multiple firms, reflecting stronger institutional confidence. Arm Holdings shows a wider range of ratings, including “Hold” and “Sell,” indicating mixed sentiment. Investors may interpret NXP’s steadier positive grades as a signal of more stable analyst conviction.
Risks specific to each company
The following categories identify the critical pressure points and systemic threats facing both firms in the 2026 market environment:
1. Market & Competition
Arm Holdings plc American Depositary Shares
- Faces intense competition in microprocessors and IP licensing with high valuation pressure (PE 141.58).
NXP Semiconductors N.V.
- Competes across diverse semiconductor segments with moderate valuation but lower growth premium (PE 27.14).
2. Capital Structure & Debt
Arm Holdings plc American Depositary Shares
- Maintains very low debt (D/E 0.05), a strong balance sheet with high interest coverage.
NXP Semiconductors N.V.
- Carries significantly higher leverage (D/E 1.22), increasing financial risk despite decent interest coverage.
3. Stock Volatility
Arm Holdings plc American Depositary Shares
- Exhibits very high beta (4.374), indicating extreme price swings and market sensitivity.
NXP Semiconductors N.V.
- Shows moderate beta (1.458), more stable stock performance relative to market benchmarks.
4. Regulatory & Legal
Arm Holdings plc American Depositary Shares
- Subject to licensing and export controls given global IP licensing footprint.
NXP Semiconductors N.V.
- Faces regulatory scrutiny in multiple jurisdictions due to extensive global manufacturing and sales.
5. Supply Chain & Operations
Arm Holdings plc American Depositary Shares
- Relies on semiconductor customers’ manufacturing cycles; limited direct manufacturing risk.
NXP Semiconductors N.V.
- Exposure to complex supply chains with potential disruptions due to large-scale global operations.
6. ESG & Climate Transition
Arm Holdings plc American Depositary Shares
- Limited direct emissions but must align IP licensing with sustainable tech trends.
NXP Semiconductors N.V.
- Larger operational footprint requires robust climate transition strategies and ESG compliance.
7. Geopolitical Exposure
Arm Holdings plc American Depositary Shares
- Significant exposure to China, Taiwan, and South Korea risks in tech export controls.
NXP Semiconductors N.V.
- Broad geopolitical footprint including China and Europe creates diverse but complex risk matrix.
Which company shows a better risk-adjusted profile?
Arm’s most impactful risk is its extreme stock volatility and premium valuation, increasing investor risk despite a pristine balance sheet. NXP’s primary risk is its high leverage, elevating financial vulnerability amid market cycles. I assess NXP offers a better risk-adjusted profile due to its more balanced valuation and operational scale, despite heavier debt. Arm’s sky-high beta and stretched PE ratio raise caution amid semiconductor sector cyclicality.
Final Verdict: Which stock to choose?
Arm Holdings’ superpower lies in its unmatched efficiency in innovation and revenue growth. It commands a premium due to strong income statement momentum but faces a point of vigilance in its value destruction signal from ROIC below WACC. It suits aggressive growth portfolios seeking cutting-edge exposure.
NXP Semiconductors boasts a strategic moat with solid recurring revenue and efficient capital use. Its slightly favorable moat and safer financial profile relative to Arm signal better stability. It fits well in GARP portfolios that balance growth potential with moderate risk.
If you prioritize rapid innovation and revenue expansion, Arm outshines with its growth trajectory despite valuation risks. However, if you seek steadier capital efficiency and financial stability, NXP offers better resilience and a more balanced risk-reward profile. Both present analytical scenarios worth aligning with distinct investor strategies.
Disclaimer: Investment carries a risk of loss of initial capital. The past performance is not a reliable indicator of future results. Be sure to understand risks before making an investment decision.
Go Further
I encourage you to read the complete analyses of Arm Holdings plc American Depositary Shares and NXP Semiconductors N.V. to enhance your investment decisions: