Home > Comparison > Technology > ARM vs NVEC
The strategic rivalry between Arm Holdings plc and NVE Corporation shapes innovation in the semiconductor sector. Arm operates as a global technology powerhouse, licensing CPU architectures to diverse markets. In contrast, NVE specializes in niche spintronic sensors, focusing on industrial and medical applications. This analysis pits scale and broad IP dominance against specialized nanotech innovation to determine which trajectory offers the superior risk-adjusted return for a diversified portfolio in 2026.
Table of contents
Companies Overview
Arm Holdings and NVE Corporation stand as significant players within the semiconductor industry, each carving distinct niches.
Arm Holdings plc American Depositary Shares: Leading Semiconductor Architect
Arm primarily licenses CPU designs and system IP to semiconductor firms and OEMs. Its revenue stems from royalties and licensing fees tied to widespread adoption in automotive, computing, and IoT markets. In 2026, it emphasizes expanding its ecosystem reach and technology licensing globally, leveraging its strong architecture footprint.
NVE Corporation: Spintronics Innovator
NVE focuses on spintronic sensors and couplers, enabling advanced data acquisition and transmission primarily for factory automation and medical devices. Its revenue derives from product sales and R&D contracts. The company’s 2026 strategy centers on developing custom sensors for industrial IoT and medical applications, highlighting its niche technological edge.
Strategic Collision: Similarities & Divergences
Arm and NVE both operate in semiconductors but contrast sharply: Arm pursues a broad licensing model, while NVE builds specialized proprietary devices. Their battleground lies in embedded technology for IoT and automation markets. Investors face divergent profiles—Arm’s scale and ecosystem vs. NVE’s focused innovation and smaller footprint.
Income Statement Comparison
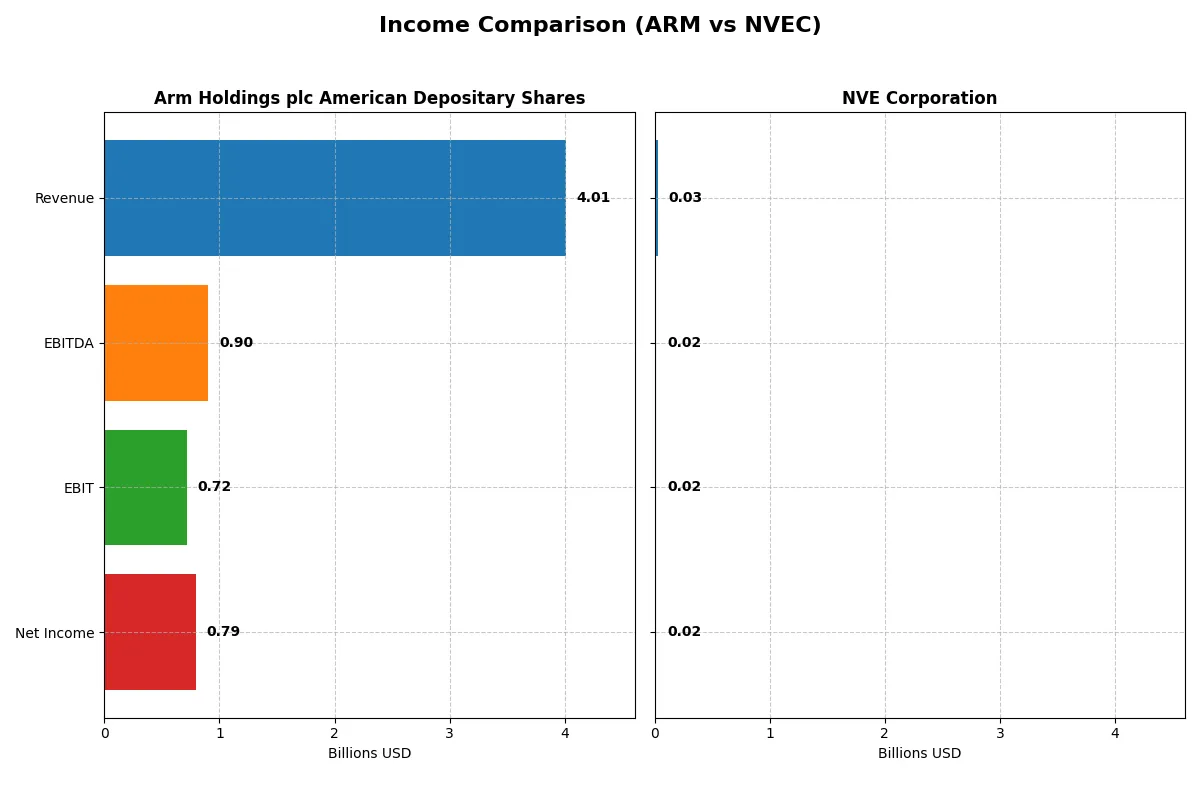
This data dissects the core profitability and scalability of both corporate engines to reveal who dominates the bottom line:
| Metric | Arm Holdings plc (ARM) | NVE Corporation (NVEC) |
|---|---|---|
| Revenue | 4B | 26M |
| Cost of Revenue | 206M | 4.2M |
| Operating Expenses | 3B | 5.6M |
| Gross Profit | 3.8B | 22M |
| EBITDA | 903M | 16M |
| EBIT | 720M | 16M |
| Interest Expense | 0 | 0 |
| Net Income | 792M | 15M |
| EPS | 0.75 | 3.12 |
| Fiscal Year | 2025 | 2025 |
Income Statement Analysis: The Bottom-Line Duel
This income statement comparison exposes which company converts revenue into profit most efficiently over recent years.
Arm Holdings plc American Depositary Shares Analysis
Arm’s revenue nearly doubled from 2.03B in 2021 to 4.01B in 2025, showing robust growth. Net income surged from 388M to 792M, reflecting expanding profitability. Its gross margin stays exceptionally high near 95%, while net margin improved to almost 20%, signaling strong cost control and operational leverage in 2025.
NVE Corporation Analysis
NVE’s revenue rose modestly from 21.4M in 2021 to 25.9M in 2025 but dipped in the latest year by 13%. Net income increased overall from 11.7M to 15.1M, maintaining a stellar net margin above 58%. However, the 2025 decline in revenue and EBIT signals pressure on top-line growth and operational momentum.
Margin Mastery vs. Growth Momentum
Arm dominates growth with near 24% revenue expansion and more than doubling EBIT in 2025, reflecting accelerating scale and margin stability. NVE excels in profitability ratios but faces recent revenue setbacks. For investors, Arm’s profile appeals with strong growth and improving margins, whereas NVE offers steady, high-margin earnings but with growth headwinds.
Financial Ratios Comparison
These vital ratios act as a diagnostic tool to expose the underlying fiscal health, valuation premiums, and capital efficiency of the companies compared below:
| Ratios | Arm Holdings plc (ARM) | NVE Corporation (NVEC) |
|---|---|---|
| ROE | 11.6% | 24.2% |
| ROIC | 10.3% | 21.1% |
| P/E | 142 | 20.5 |
| P/B | 16.4 | 4.95 |
| Current Ratio | 5.20 | 28.4 |
| Quick Ratio | 5.20 | 22.0 |
| D/E | 0.052 | 0.015 |
| Debt-to-Assets | 4.0% | 1.4% |
| Interest Coverage | 0 | 0 |
| Asset Turnover | 0.45 | 0.40 |
| Fixed Asset Turnover | 5.61 | 8.91 |
| Payout ratio | 0 | 1.28 |
| Dividend yield | 0% | 6.28% |
| Fiscal Year | 2025 | 2025 |
Efficiency & Valuation Duel: The Vital Signs
Financial ratios act as a company’s DNA, unveiling hidden risks and operational strengths that shape investment decisions.
Arm Holdings plc American Depositary Shares
Arm shows moderate profitability with an 11.6% ROE but struggles with a high WACC at 24.3%, signaling capital cost concerns. Its valuation looks stretched, sporting a steep P/E of 141.6 and a P/B of 16.4. Arm returns no dividend, instead investing heavily in R&D (50% of revenue), aiming for long-term growth.
NVE Corporation
NVE excels with strong profitability, boasting a 24.2% ROE and a robust 58.2% net margin. The valuation appears reasonable at a P/E of 20.5, though P/B is somewhat elevated at 4.95. NVE balances growth with shareholder returns, offering a 6.3% dividend yield while maintaining a favorable ROIC of 21.1%.
Premium Valuation vs. Operational Safety
NVE strikes a better balance of risk and reward, combining high profitability with a reasonable valuation and steady dividends. Arm’s premium valuation and heavy reinvestment suit growth-focused investors willing to accept elevated risk for potential future gains.
Which one offers the Superior Shareholder Reward?
Arm Holdings (ARM) does not pay dividends but reinvests heavily in innovation and growth, while NVE Corporation (NVEC) delivers a strong 4.5–6.3% dividend yield supported by robust free cash flow. ARM’s payout ratio is zero, reflecting a growth-focused strategy, whereas NVEC maintains a payout ratio around 1.1–1.6, signaling a sustainable distribution. NVEC also aggressively repurchases shares, complementing dividends for total shareholder return. ARM’s sky-high P/E (141x) and price-to-FCF (630x) suggest rich growth expectations but limited current yield. NVEC’s moderate P/E (~20x) and healthy cash flow coverage of dividends indicate a more balanced, reliable shareholder reward. I favor NVEC for superior total return and distribution sustainability in 2026.
Comparative Score Analysis: The Strategic Profile
The radar chart reveals the fundamental DNA and trade-offs between Arm Holdings plc and NVE Corporation, highlighting their core financial strengths and weaknesses:
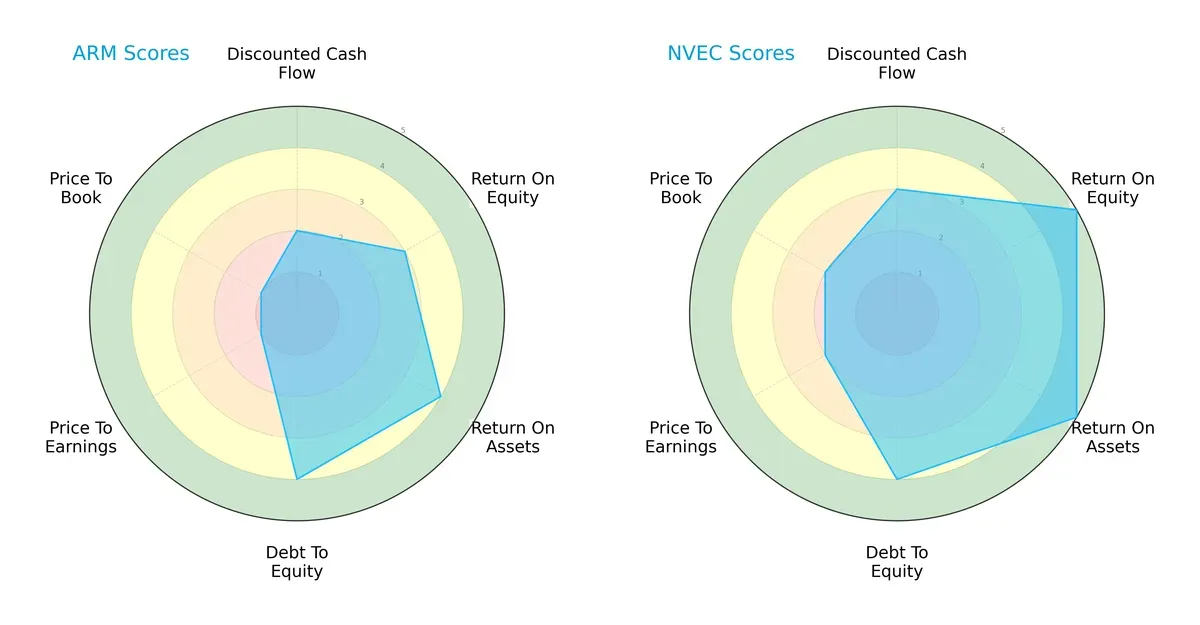
NVE leads with a more balanced and robust profile, scoring higher in ROE (5 vs. 3) and ROA (5 vs. 4), indicating superior profitability and asset efficiency. Both firms share strong debt-to-equity scores (4 each), suggesting comparable financial stability. Arm’s strength lies in asset utilization, but it lags in valuation metrics (PE and PB scores at 1 vs. NVEC’s 2), signaling potential overvaluation risks. Overall, NVE offers a more favorable investment case with balanced operational and valuation metrics, while Arm depends heavily on operational efficiency but faces valuation headwinds.
Bankruptcy Risk: Solvency Showdown
The Altman Z-Score differential signals a clear edge for NVE’s long-term survival in this cycle:
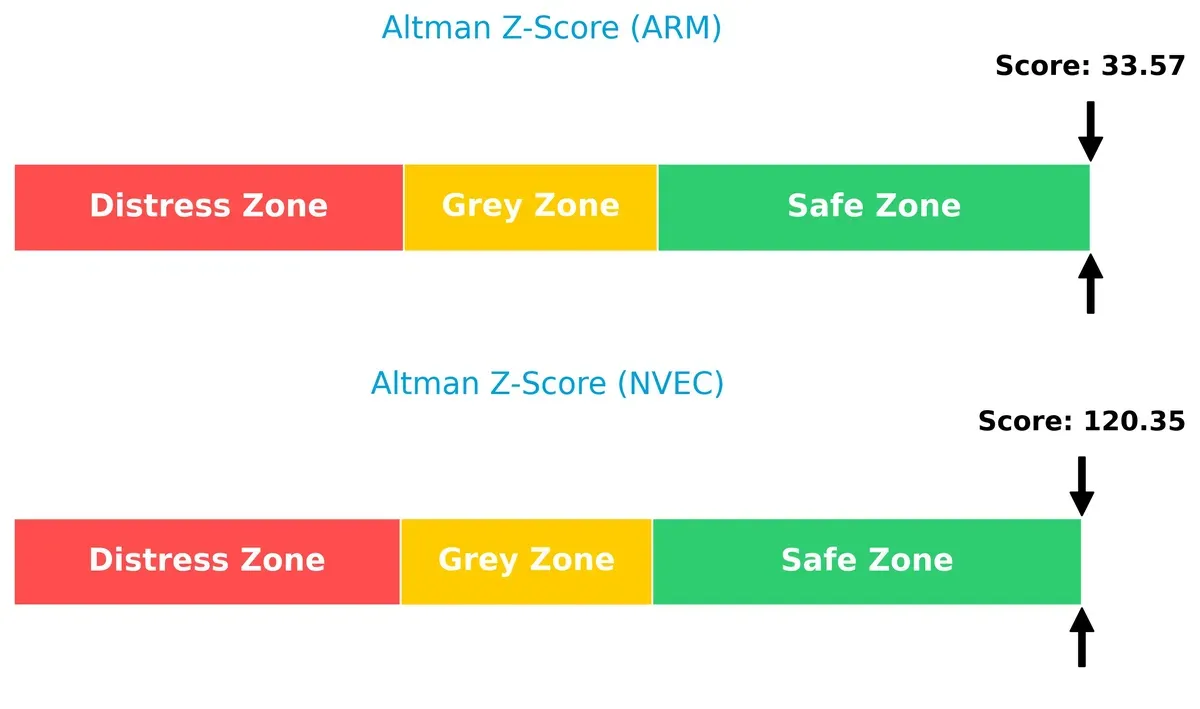
NVE’s extremely high Z-Score (120.35) places it deep in the safe zone, reflecting rock-solid financial health and negligible bankruptcy risk. Arm’s score (33.57) also sits comfortably in the safe zone but is significantly lower, suggesting higher relative risk. Historically, in capital-intensive sectors, such a spread underscores NVE’s superior resilience through economic cycles.
Financial Health: Quality of Operations
Arm’s stronger Piotroski F-Score points to healthier internal operations compared to NVE:
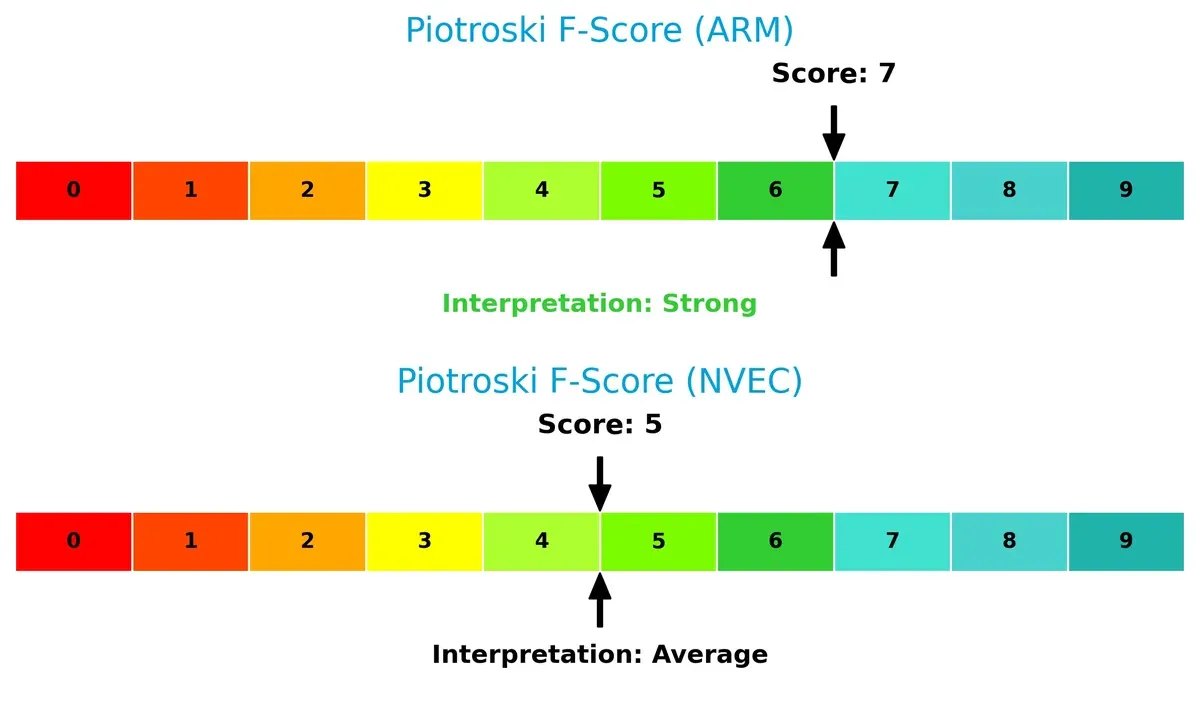
Arm scores a robust 7 out of 9, indicating strong profitability, liquidity, and operational efficiency. NVE’s 5 signals average financial health with some red flags in internal metrics. I interpret this as Arm having tighter internal controls and operational quality, which could support a turnaround or growth phase. Investors should weigh this operational strength against NVE’s broader financial stability when allocating capital.
How are the two companies positioned?
This section dissects the operational DNA of Arm and NVE by comparing their revenue distribution and internal strengths and weaknesses. The goal is to confront their economic moats and identify which business model offers the most resilient competitive advantage today.
Revenue Segmentation: The Strategic Mix
This visual comparison dissects how Arm Holdings plc and NVE Corporation diversify their income streams and where their primary sector bets lie:
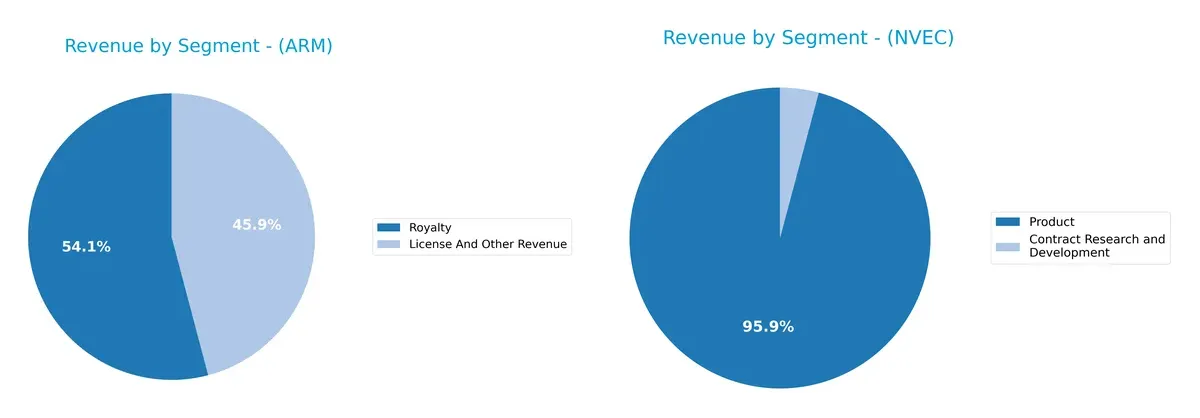
Arm Holdings anchors its revenue in two strong segments: $2.17B royalties and $1.84B licensing, reflecting a balanced semiconductor IP model. NVE Corporation pivots heavily on its $25.9M product sales, overshadowing its $1.1M contract research. Arm’s diversification across licensing and royalties reduces concentration risk, while NVE’s reliance on product sales signals exposure to market cycles and manufacturing risks.
Strengths and Weaknesses Comparison
This table compares the strengths and weaknesses of Arm and NVEC across key financial and strategic metrics:
Arm Strengths
- Diverse revenue from licenses and royalties
- Strong presence in US and Asia markets
- Favorable quick ratio and low debt levels
- Infinite interest coverage
- High fixed asset turnover
NVEC Strengths
- High net margin and ROE indicate strong profitability
- Favorable ROIC above WACC
- Low debt and strong interest coverage
- Significant product revenue base
- Favorable quick ratio and fixed asset turnover
Arm Weaknesses
- Unfavorable ROIC below WACC
- High WACC relative to returns
- Extremely high P/E and P/B multiples
- Unfavorable current ratio despite strong quick ratio
- Moderate asset turnover
- No dividend yield
NVEC Weaknesses
- Unfavorable very high current ratio suggests inefficient asset use
- Unfavorable P/B ratio
- Moderate asset turnover
- Neutral dividend yield and P/E ratios
Both companies maintain financial strengths in liquidity and leverage, but Arm faces valuation and return challenges, while NVEC shows signs of inefficient working capital use. These factors influence their capital allocation and growth strategies going forward.
The Moat Duel: Analyzing Competitive Defensibility
A strong structural moat protects long-term profits from competitive erosion. Without it, market share and margins quickly deteriorate:
Arm Holdings plc: Intangible Assets Moat
Arm’s moat stems from its industry-standard CPU architectures and licensing model. This drives stable, high gross margins near 95%, but its ROIC underperforms WACC, signaling value destruction. New AI and automotive markets could widen its moat if capital efficiency improves in 2026.
NVE Corporation: Cost Advantage and Innovation Moat
NVE leverages proprietary spintronics technology, delivering exceptional EBIT margins above 60% and a ROIC well above WACC. Despite recent revenue dips, its rising ROIC trend shows efficient capital use. Expanding industrial IoT and medical sensor markets offer growth catalysts in 2026.
Market Dominance vs. Technological Efficiency: The Moat Showdown
NVE holds the deeper, more durable moat with strong capital returns and margin expansion. Arm’s intangible asset moat is wider but currently less efficient. NVE is better positioned to defend and grow market share amid evolving semiconductor demands.
Which stock offers better returns?
The past year saw both Arm Holdings and NVE Corporation stocks decline sharply, with Arm showing greater volatility and a decelerating downward trend, while NVE’s decline accelerated despite recent gains.
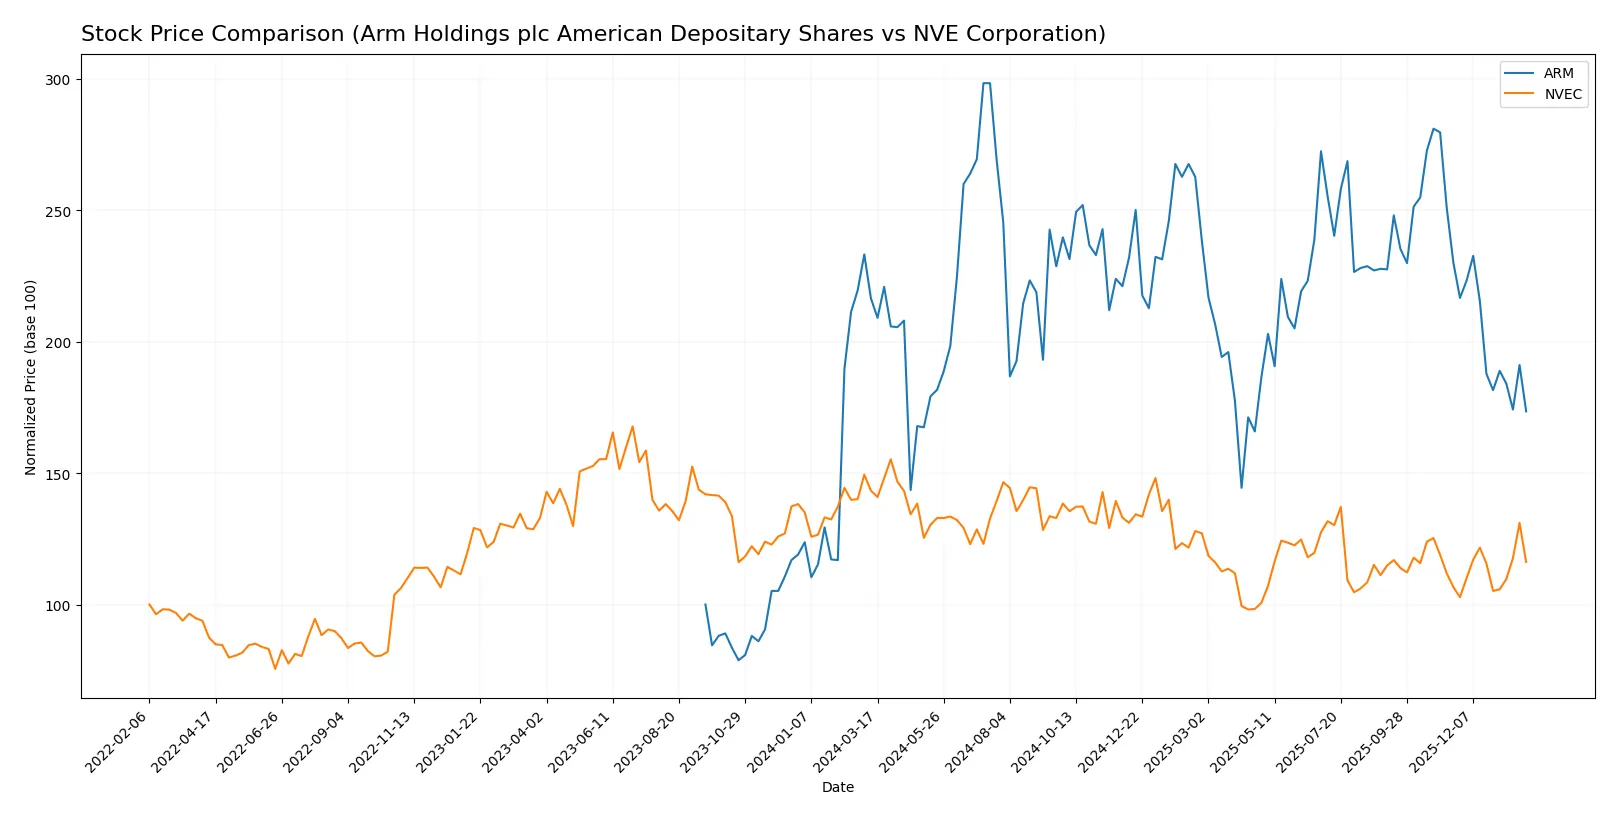
Trend Comparison
Arm Holdings’ stock fell 19.87% over the past 12 months, marking a bearish trend with decelerating losses and high volatility, hitting a high of 181.19 and a low of 87.19.
NVE Corporation’s stock dropped 18.93% over the same period, also bearish but with accelerating declines and lower volatility. Notably, NVE gained 8.94% recently, showing a slight upward slope.
Comparing trends, both stocks are bearish overall, but NVE’s recent positive momentum contrasts with Arm’s accelerating losses, making NVE the stronger performer in the latest period.
Target Prices
Arm Holdings plc American Depositary Shares shows a clear analyst target consensus, suggesting robust upside potential.
| Company | Target Low | Target High | Consensus |
|---|---|---|---|
| Arm Holdings plc American Depositary Shares | 120 | 170 | 145 |
Analysts expect Arm’s shares to rise from the current 105.36 to a consensus target of 145, implying significant growth potential. No verified target price data is available for NVE Corporation.

Don’t Let Luck Decide Your Entry Point
Optimize your entry points with our advanced ProRealTime indicators. You’ll get efficient buy signals with precise price targets for maximum performance. Start outperforming now!
How do institutions grade them?
Here is a summary of recent institutional grades for Arm Holdings plc American Depositary Shares:
Arm Holdings plc American Depositary Shares Grades
The table below shows the latest grades from reputable financial institutions for Arm Holdings:
| Grading Company | Action | New Grade | Date |
|---|---|---|---|
| UBS | Maintain | Buy | 2026-01-26 |
| Wells Fargo | Maintain | Overweight | 2026-01-26 |
| Morgan Stanley | Maintain | Overweight | 2026-01-23 |
| Susquehanna | Upgrade | Positive | 2026-01-21 |
| B of A Securities | Downgrade | Neutral | 2026-01-13 |
| B of A Securities | Maintain | Buy | 2025-12-16 |
| Goldman Sachs | Downgrade | Sell | 2025-12-15 |
| Loop Capital | Maintain | Buy | 2025-11-12 |
| Benchmark | Maintain | Hold | 2025-11-06 |
| Needham | Maintain | Hold | 2025-11-06 |
Which company has the best grades?
Arm Holdings has multiple recent grades from recognized firms, ranging from Sell to Buy, with a bias toward positive ratings. NVE Corporation has no available institutional grades. This disparity may influence investor confidence due to Arm’s broader analyst coverage.
Risks specific to each company
The following categories identify the critical pressure points and systemic threats facing both firms in the 2026 market environment:
1. Market & Competition
Arm Holdings plc American Depositary Shares
- Faces intense competition from global semiconductor giants and must continuously innovate to maintain licensing dominance.
NVE Corporation
- Operates in a niche spintronics market with fewer direct competitors but limited scale and market diversification.
2. Capital Structure & Debt
Arm Holdings plc American Depositary Shares
- Maintains a very low debt-to-equity ratio (0.05), signaling strong balance sheet stability and low financial risk.
NVE Corporation
- Also holds minimal debt (0.01 debt-to-equity), suggesting a conservative capital structure and solid financial footing.
3. Stock Volatility
Arm Holdings plc American Depositary Shares
- Exhibits high beta (4.36), indicating significant stock price volatility and sensitivity to market swings.
NVE Corporation
- Shows moderate beta (1.20), implying lower volatility and more stable price behavior.
4. Regulatory & Legal
Arm Holdings plc American Depositary Shares
- Faces regulatory scrutiny across multiple jurisdictions, including China and the US, heightening compliance complexity.
NVE Corporation
- Operates primarily in the US with less diverse regulatory exposure but must navigate evolving nanotech patent laws.
5. Supply Chain & Operations
Arm Holdings plc American Depositary Shares
- Relies on global semiconductor supply chains vulnerable to geopolitical tensions and chip shortages.
NVE Corporation
- Smaller scale reduces supply chain complexity but limits bargaining power with suppliers.
6. ESG & Climate Transition
Arm Holdings plc American Depositary Shares
- Under pressure to meet ESG standards across global operations, particularly in energy-intensive manufacturing sectors.
NVE Corporation
- Faces less ESG pressure due to niche, low-volume production but must address sustainability in medical device markets.
7. Geopolitical Exposure
Arm Holdings plc American Depositary Shares
- Significant exposure to US-China tensions impacting licensing revenues and market access.
NVE Corporation
- Concentrated US operations limit geopolitical risk but reduce growth opportunities abroad.
Which company shows a better risk-adjusted profile?
NVE Corporation’s key risk lies in its limited scale and market niche, which may constrain growth despite strong financial health. Arm Holdings faces substantial market volatility and geopolitical risks, amplified by its global footprint and high beta. NVE’s lower volatility and stronger profitability metrics yield a superior risk-adjusted profile. Notably, Arm’s sky-high beta of 4.36 signals heightened investor risk amid volatile semiconductor cycles, justifying caution despite its market leadership.
Final Verdict: Which stock to choose?
Arm Holdings’ superpower lies in its commanding market position and impressive revenue momentum, fueled by relentless R&D investment. However, its value destruction indicated by ROIC below WACC is a point of vigilance. Arm fits well within aggressive growth portfolios willing to tolerate valuation risk for future innovation payoff.
NVE Corporation benefits from a durable competitive moat, delivering strong returns well above its cost of capital. Its robust profitability and conservative financial profile offer greater stability compared to Arm. NVE suits investors seeking growth at a reasonable price with a focus on capital efficiency and margin strength.
If you prioritize breakthrough innovation and market dominance, Arm offers compelling upside despite its valuation and efficiency challenges. However, if you seek durable value creation with superior profitability and financial resilience, NVE outshines as a safer growth candidate. Each presents a distinct analytical scenario aligned with different risk tolerances and investment horizons.
Disclaimer: Investment carries a risk of loss of initial capital. The past performance is not a reliable indicator of future results. Be sure to understand risks before making an investment decision.
Go Further
I encourage you to read the complete analyses of Arm Holdings plc American Depositary Shares and NVE Corporation to enhance your investment decisions: