In the fast-evolving semiconductor industry, Arm Holdings plc and Nova Ltd. stand out as key players driving innovation and technological progress. Arm specializes in CPU architecture and system IP licensing, while Nova excels in advanced process control systems for chip manufacturing. Given their overlapping roles in semiconductor development, comparing these companies reveals unique investment opportunities. Join me as we analyze which company offers the most compelling potential for your portfolio.
Table of contents
Companies Overview
I will begin the comparison between Arm Holdings plc and Nova Ltd. by providing an overview of these two companies and their main differences.
Arm Holdings plc Overview
Arm Holdings plc architects, develops, and licenses central processing unit products and related technologies for semiconductor companies and original equipment manufacturers. Its offerings include microprocessors, systems intellectual property, graphics processing units, software, and tools. Operating globally, Arm serves markets such as automotive, computing infrastructure, consumer technologies, and the Internet of Things. Founded in 1990, it is headquartered in Cambridge, UK, and operates as a subsidiary of Kronos II LLC.
Nova Ltd. Overview
Nova Ltd. designs, develops, produces, and sells process control systems used in semiconductor manufacturing. It offers metrology platforms for dimensional, films, materials, and chemical metrology measurements supporting various fabrication steps in integrated circuit production. Serving logic, foundries, memory manufacturers, and equipment producers, Nova operates internationally with headquarters in Rehovot, Israel. The company was incorporated in 1993 and rebranded from Nova Measuring Instruments Ltd. in 2021.
Key similarities and differences
Both companies operate within the semiconductor industry and serve international markets with advanced technology solutions. Arm focuses on designing and licensing semiconductor IP cores and processors, while Nova produces process control and metrology systems for manufacturing. Arm has a significantly larger workforce and market capitalization, reflecting its broader product range and market reach compared to Nova’s more specialized manufacturing equipment niche.
Income Statement Comparison
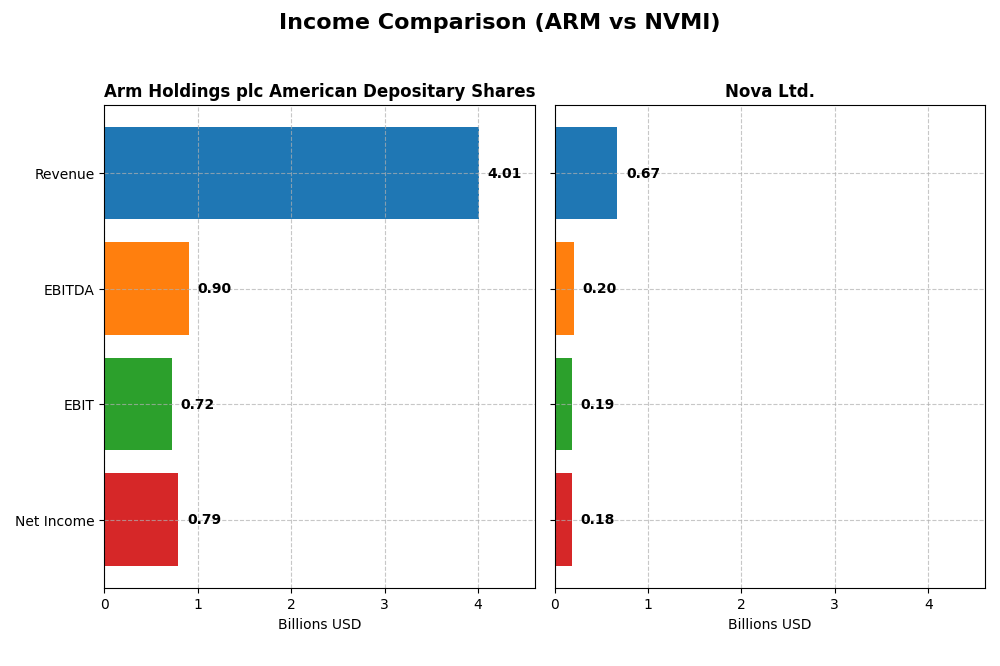
This table presents a side-by-side comparison of key income statement metrics for Arm Holdings plc and Nova Ltd. based on their most recent fiscal year results.
| Metric | Arm Holdings plc American Depositary Shares | Nova Ltd. |
|---|---|---|
| Market Cap | 111B | 12.9B |
| Revenue | 4.01B | 672M |
| EBITDA | 903M | 205M |
| EBIT | 720M | 188M |
| Net Income | 792M | 185M |
| EPS | 0.75 | 6.31 |
| Fiscal Year | 2025 | 2024 |
Income Statement Interpretations
Arm Holdings plc American Depositary Shares
Arm Holdings showed strong revenue growth from $2.03B in 2021 to $4.01B in 2025, nearly doubling over five years. Net income followed a similar upward trend, reaching $792M in 2025. Margins remained robust, with a gross margin near 95% and net margin improving slightly. The latest year saw a significant surge in EBIT and EPS, indicating accelerating profitability.
Nova Ltd.
Nova Ltd. demonstrated a consistent revenue increase from $269M in 2020 to $672M in 2024, with net income rising even more sharply to $184.9M. Margins were favorable, with an EBIT margin around 28% and a net margin above 27%. In the most recent year, revenue and gross profit grew by nearly 30%, while net margin showed slight improvement, reflecting steady operational efficiency.
Which one has the stronger fundamentals?
Both companies present favorable income statement fundamentals, with Arm exhibiting higher absolute revenue and net income growth and exceptional gross margins. Nova, although smaller, delivers stronger EBIT and net margins and remarkable net income growth overall. Arm’s financial leverage is negligible, while Nova maintains low interest expenses. Each shows solid growth, but with differing margin profiles and scale.
Financial Ratios Comparison
The table below presents a side-by-side comparison of key financial ratios for Arm Holdings plc (ARM) and Nova Ltd. (NVMI) based on their most recent fiscal year data.
| Ratios | Arm Holdings plc (ARM) (2025) | Nova Ltd. (NVMI) (2024) |
|---|---|---|
| ROE | 11.6% | 19.8% |
| ROIC | 10.3% | 13.4% |
| P/E | 141.6 | 31.2 |
| P/B | 16.4 | 6.18 |
| Current Ratio | 5.20 | 2.32 |
| Quick Ratio | 5.20 | 1.92 |
| D/E (Debt-to-Equity) | 0.052 | 0.254 |
| Debt-to-Assets | 4.0% | 17.0% |
| Interest Coverage | 0 (not reported) | 116.2 |
| Asset Turnover | 0.45 | 0.48 |
| Fixed Asset Turnover | 5.61 | 5.06 |
| Payout ratio | 0% | 0% |
| Dividend yield | 0% | 0% |
Interpretation of the Ratios
Arm Holdings plc American Depositary Shares
Arm Holdings exhibits a mixed ratio profile with strong net margin at 19.77% but unfavorable returns on invested capital (10.28%) and a high weighted average cost of capital (24.3%). Its valuation metrics like PE (141.58) and PB (16.4) are notably high, indicating expensive stock pricing. The company does not pay dividends, likely reflecting reinvestment in R&D and growth, supported by a favorable low debt-to-equity ratio (0.05) and strong interest coverage.
Nova Ltd.
Nova Ltd. shows generally favorable profitability ratios including a net margin of 27.33%, return on equity of 19.81%, and return on invested capital of 13.39%, though the weighted average cost of capital is relatively high at 12.26%. Liquidity ratios such as the current ratio (2.32) and quick ratio (1.92) are solid. Like Arm, Nova does not distribute dividends, possibly prioritizing reinvestment and innovation, supported by a moderate debt-to-equity ratio (0.25) and strong interest coverage.
Which one has the best ratios?
Comparing the two, Nova Ltd. holds a more favorable overall ratio profile with 64.29% favorable ratios versus Arm’s 42.86%, including stronger returns and better liquidity measures. Arm’s valuation and capital costs appear less attractive, contributing to a slightly unfavorable global opinion. Nova’s consistent profitability and balanced leverage provide a comparatively stronger financial outlook.
Strategic Positioning
This section compares the strategic positioning of Arm Holdings plc and Nova Ltd., focusing on market position, key segments, and exposure to technological disruption:
Arm Holdings plc American Depositary Shares
- Leading semiconductor IP licensor with high market cap and significant competitive pressure in global markets.
- Key segments include microprocessors, systems IPs, software tools; business driven by licensing and royalties.
- Exposure to semiconductor technology shifts through licensing of CPU and GPU architectures; IP model moderates disruption risks.
Nova Ltd.
- Smaller market cap focused on semiconductor process control systems, facing moderate competitive pressure.
- Focused on metrology platforms for semiconductor manufacturing process control; product sales drive revenue.
- Exposure tied to semiconductor manufacturing innovation; metrology tools must adapt to evolving process technologies.
Arm Holdings plc American Depositary Shares vs Nova Ltd. Positioning
Arm operates with a diversified product portfolio and licensing model serving multiple semiconductor sectors, while Nova concentrates on specialized process control systems. Arm’s broader reach offers scale advantages, whereas Nova’s focus may enable deeper technological expertise in niche markets.
Which has the best competitive advantage?
Neither company shows a strong economic moat; Arm’s value is being destroyed despite stable profitability, while Nova’s profitability is improving but not yet reflecting a clear competitive advantage.
Stock Comparison
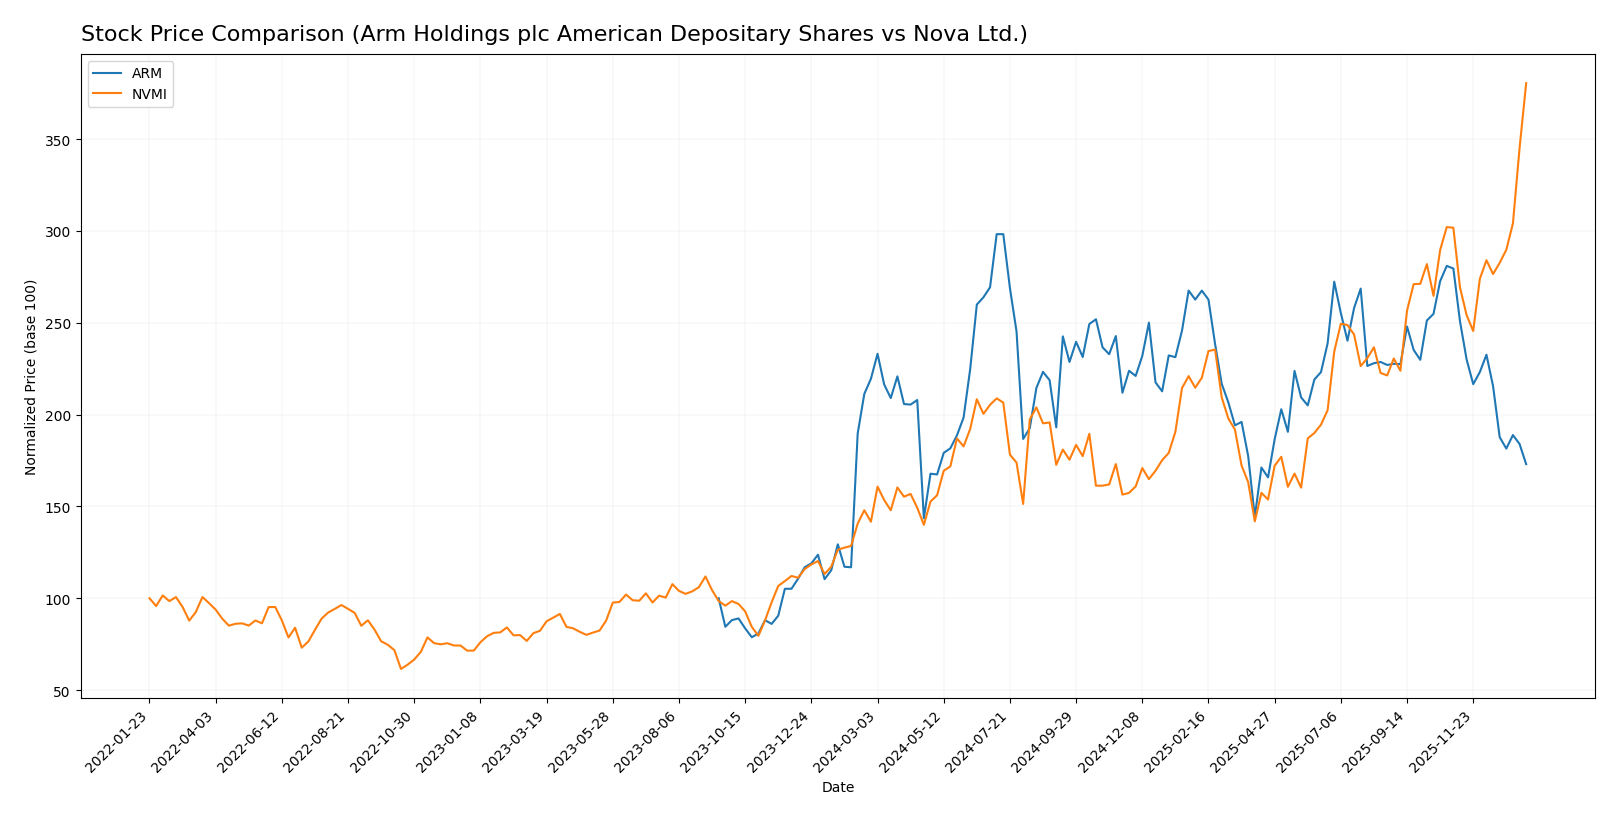
The stock price movements over the past year reveal contrasting dynamics, with Arm Holdings showing a marked decline while Nova Ltd. experienced strong gains and accelerating momentum.
Trend Analysis
Arm Holdings plc American Depositary Shares (ARM) exhibited a bearish trend over the past 12 months, with a price decline of 21.17% and deceleration in its downward momentum. The stock ranged between 87.19 and 181.19, showing high volatility with an 19.31 standard deviation.
Nova Ltd. (NVMI) displayed a bullish trend over the same period, surging 168.54% in price with accelerating gains. Its price fluctuated between 159.92 and 434.55, reflecting elevated volatility at a 55.86 standard deviation.
Comparing both stocks, Nova Ltd. outperformed Arm Holdings significantly, delivering the highest market performance with a strong bullish trend versus Arm’s bearish pattern.
Target Prices
The target price consensus for Arm Holdings plc and Nova Ltd. reflects optimistic analyst expectations.
| Company | Target High | Target Low | Consensus |
|---|---|---|---|
| Arm Holdings plc American Depositary Shares | 210 | 120 | 166 |
| Nova Ltd. | 390 | 335 | 362.5 |
Analysts see significant upside for both Arm and Nova compared to their current prices of $105.11 and $434.55, respectively, suggesting potential growth opportunities.
Analyst Opinions Comparison
This section compares analysts’ ratings and grades for Arm and Nova Ltd. based on key financial metrics:
Rating Comparison
Arm Rating
- Rating: B, considered very favorable by analysts.
- Discounted Cash Flow Score: Moderate at 3, indicating balanced valuation.
- ROE Score: Moderate at 3, showing average efficiency in profit generation.
- ROA Score: Favorable at 4, reflecting good asset utilization.
- Debt To Equity Score: Favorable at 4, implying relatively low financial risk.
- Overall Score: Moderate at 3, reflecting a balanced overall financial health.
Nova Ltd. Rating
- Rating: B-, also seen as very favorable by analysts.
- Discounted Cash Flow Score: Moderate at 3, suggesting similar valuation balance.
- ROE Score: Favorable at 4, indicating better efficiency in using shareholder equity.
- ROA Score: Very favorable at 5, indicating excellent asset utilization.
- Debt To Equity Score: Very unfavorable at 1, signaling higher financial risk.
- Overall Score: Moderate at 3, indicating comparable overall financial health.
Which one is the best rated?
Based on the data, Arm holds a higher debt-to-equity score, indicating lower financial risk, while Nova Ltd. excels in ROE and ROA scores. Both have the same overall score, but Arm’s stronger balance sheet contrasts with Nova’s superior operational efficiency.
Scores Comparison
Here is a comparison of the financial scores for Arm Holdings plc and Nova Ltd.:
Arm Holdings plc Scores
- Altman Z-Score: 32.43, indicating a safe zone with very low bankruptcy risk.
- Piotroski Score: 7, categorized as strong financial health.
Nova Ltd. Scores
- Altman Z-Score: 7.76, indicating a safe zone with low bankruptcy risk.
- Piotroski Score: 7, categorized as strong financial health.
Which company has the best scores?
Arm Holdings plc has a significantly higher Altman Z-Score than Nova Ltd., both in the safe zone, while both share the same Piotroski Score of 7. Arm shows stronger financial stability based on provided data.
Grades Comparison
Here is a comparison of the recent grades assigned to Arm Holdings plc American Depositary Shares and Nova Ltd.:
Arm Holdings plc American Depositary Shares Grades
The following table summarizes recent grades from recognized grading companies for Arm Holdings:
| Grading Company | Action | New Grade | Date |
|---|---|---|---|
| B of A Securities | Downgrade | Neutral | 2026-01-13 |
| B of A Securities | Maintain | Buy | 2025-12-16 |
| Goldman Sachs | Downgrade | Sell | 2025-12-15 |
| Loop Capital | Maintain | Buy | 2025-11-12 |
| TD Cowen | Maintain | Buy | 2025-11-06 |
| Rosenblatt | Maintain | Buy | 2025-11-06 |
| Wells Fargo | Maintain | Overweight | 2025-11-06 |
| Mizuho | Maintain | Outperform | 2025-11-06 |
| Barclays | Maintain | Overweight | 2025-11-06 |
| UBS | Maintain | Buy | 2025-11-06 |
Arm Holdings shows a mixed trend with multiple “Buy” and “Overweight” ratings maintained, but recent downgrades to “Neutral” and “Sell” reflect some caution from major firms.
Nova Ltd. Grades
The following table summarizes recent grades from recognized grading companies for Nova Ltd.:
| Grading Company | Action | New Grade | Date |
|---|---|---|---|
| B of A Securities | Maintain | Buy | 2026-01-13 |
| Jefferies | Maintain | Buy | 2025-12-15 |
| Evercore ISI Group | Maintain | Outperform | 2025-11-07 |
| Benchmark | Maintain | Buy | 2025-11-07 |
| Cantor Fitzgerald | Maintain | Overweight | 2025-06-24 |
| B of A Securities | Maintain | Buy | 2025-06-24 |
| Benchmark | Maintain | Buy | 2025-05-09 |
| Citigroup | Maintain | Buy | 2025-05-09 |
| B of A Securities | Maintain | Buy | 2025-04-16 |
| Cantor Fitzgerald | Maintain | Overweight | 2025-03-14 |
Nova Ltd. maintains consistent positive grades with no downgrades, predominantly “Buy,” “Outperform,” and “Overweight” ratings.
Which company has the best grades?
Nova Ltd. has consistently received higher and more stable grades compared to Arm Holdings, which has seen several recent downgrades. Investors might interpret Nova’s steady positive ratings as a sign of greater analyst confidence, whereas Arm’s mixed grades could signal increased caution or risk.
Strengths and Weaknesses
Below is a comparative overview of key strengths and weaknesses for Arm Holdings plc (ARM) and Nova Ltd. (NVMI) based on the most recent financial and strategic data available.
| Criterion | Arm Holdings plc (ARM) | Nova Ltd. (NVMI) |
|---|---|---|
| Diversification | Moderate; revenue mainly from licensing and royalties (approx. $4.0B total in 2025) | Low; focused product revenue (~$538M in 2024) |
| Profitability | Mixed; net margin strong at 19.77%, but ROIC (10.28%) below WACC (24.3%), indicating value destruction | Strong; net margin 27.33%, ROIC 13.39% above WACC (12.26%), showing value creation |
| Innovation | Strong brand in semiconductor IP but struggles to convert into economic moat | Growing innovation reflected in 70% ROIC growth trend and improving profitability |
| Global presence | Significant global licensing footprint | More limited geographic reach but expanding |
| Market Share | Leading in semiconductor IP licensing | Smaller market share with niche focus |
Key takeaways: Arm’s strong licensing model and profitability are offset by value destruction due to high capital costs, while Nova shows improving profitability and a growing economic moat, albeit from a smaller revenue base. Investors should weigh ARM’s global scale against NVMI’s favorable profitability trends.
Risk Analysis
Below is a comparative table outlining key risk factors for Arm Holdings plc (ARM) and Nova Ltd. (NVMI) based on the most recent data from 2025 and 2024 respectively:
| Metric | Arm Holdings plc (ARM) | Nova Ltd. (NVMI) |
|---|---|---|
| Market Risk | High beta 4.36, volatile stock range (80-183.16 USD) | Moderate beta 1.83, less volatile (154-448.61 USD) |
| Debt Level | Very low debt-to-equity 0.05, debt to assets 3.99% | Moderate debt-to-equity 0.25, debt to assets 16.98% |
| Regulatory Risk | Exposure to global tech regulations including China and US | Exposure to semiconductor export controls and geopolitical tensions |
| Operational Risk | Dependence on licensing model and innovation pace | Reliance on semiconductor manufacturing clients and technological upgrades |
| Environmental Risk | Moderate, industry-wide energy and material usage concerns | Moderate, similar semiconductor industry environmental impact |
| Geopolitical Risk | Significant, operates in US, China, Taiwan, South Korea | Considerable, based in Israel, exposed to Middle East tensions and global supply chain disruptions |
In summary, ARM faces higher market volatility and geopolitical risks due to its wide international footprint and tech sector exposure. NVMI shows higher financial leverage and geopolitical sensitivity related to its Israel base and semiconductor supply chain dependencies. Both companies have favorable financial health scores but must navigate regulatory and geopolitical uncertainties carefully.
Which Stock to Choose?
Arm Holdings plc (ARM) shows a favorable income evolution with strong revenue and earnings growth, supported by a solid net margin of 19.77%. Its financial ratios are mixed, with favorable debt levels and interest coverage but unfavorable valuation multiples and asset turnover. The company’s profitability is stable, yet it is shedding value as ROIC underperforms WACC. ARM holds a very favorable rating but a slightly unfavorable overall ratio evaluation.
Nova Ltd. (NVMI) demonstrates robust income growth and higher profitability metrics, including a net margin of 27.33% and strong returns on equity and assets. Its financial ratios are mostly favorable, particularly liquidity and capital structure, despite some unfavorable valuation multiples. The firm shows a slightly favorable moat with improving ROIC and holds a very favorable rating with a generally favorable ratio profile.
For investors, NVMI might appear more attractive for those seeking growth and improving profitability, given its favorable income and ratio evaluations plus a growing economic moat. Conversely, ARM could be seen as potentially suitable for investors valuing stable income growth and lower debt risk, though its value erosion signals caution. The choice could depend on the investor’s risk tolerance and focus on growth versus stability.
Disclaimer: Investment carries a risk of loss of initial capital. The past performance is not a reliable indicator of future results. Be sure to understand risks before making an investment decision.
Go Further
I encourage you to read the complete analyses of Arm Holdings plc American Depositary Shares and Nova Ltd. to enhance your investment decisions: