Home > Comparison > Technology > ARM vs MPWR
The strategic rivalry between Arm Holdings plc and Monolithic Power Systems defines the current trajectory of the semiconductor industry. Arm operates as a global technology licensor specializing in CPU architecture, while Monolithic Power focuses on semiconductor-based power electronics solutions. This head-to-head highlights a contest between intellectual property-driven scale and integrated circuit innovation. This analysis aims to identify which company offers a superior risk-adjusted return for a diversified technology portfolio.
Table of contents
Companies Overview
Arm Holdings and Monolithic Power Systems stand as pivotal innovators within the semiconductor industry.
Arm Holdings plc American Depositary Shares: Architect of Semiconductor IP
Arm Holdings dominates semiconductor intellectual property licensing, providing microprocessors, GPUs, and systems IP widely used in automotive, IoT, and computing infrastructure. Its 2026 strategy centers on expanding global licensing and fostering innovation to maintain its competitive moat in design architecture, underpinning diverse OEM partnerships worldwide.
Monolithic Power Systems, Inc.: Power Electronics Specialist
Monolithic Power Systems excels in designing and marketing semiconductor-based power electronics solutions, focusing on DC-DC integrated circuits and lighting control ICs for automotive, industrial, and consumer markets. In 2026, its strategic emphasis lies on broadening direct customer engagement and enhancing product integration to strengthen its market position across global distribution channels.
Strategic Collision: Similarities & Divergences
Both companies innovate in semiconductors but diverge sharply—Arm pursues a licensing model emphasizing intellectual property, while Monolithic Power prioritizes product manufacturing and direct sales. Their battleground is the expanding electronics ecosystem, with Arm influencing chip design and Monolithic Power controlling power management. These contrasting models yield distinct investment profiles: Arm offers scalability through licensing, Monolithic Power through product diversification.
Income Statement Comparison
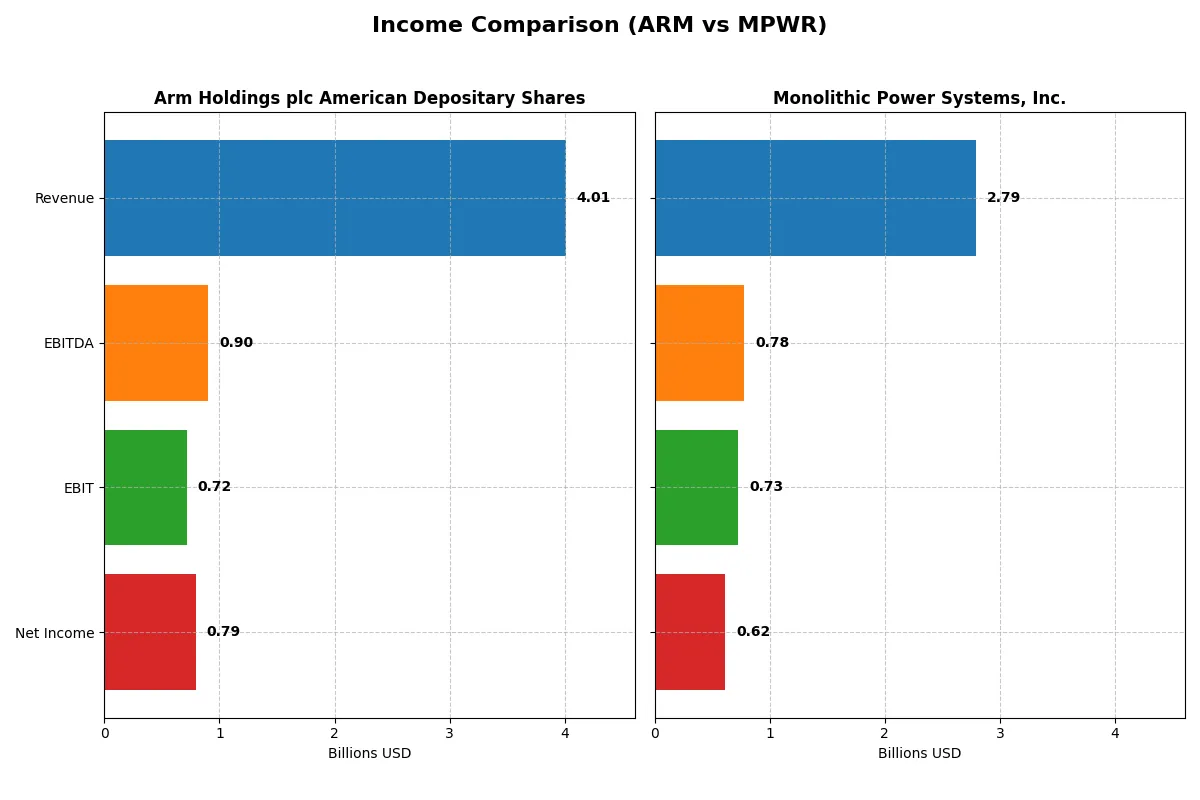
The following data dissects the core profitability and scalability of both corporate engines to reveal who dominates the bottom line:
| Metric | Arm Holdings plc American Depositary Shares (ARM) | Monolithic Power Systems, Inc. (MPWR) |
|---|---|---|
| Revenue | 4.01B | 2.79B |
| Cost of Revenue | 206M | 1.25B |
| Operating Expenses | 2.97B | 811M |
| Gross Profit | 3.80B | 1.54B |
| EBITDA | 903M | 780M |
| EBIT | 720M | 729M |
| Interest Expense | 0 | 0 |
| Net Income | 792M | 616M |
| EPS | 0.75 | 12.82 |
| Fiscal Year | 2025 | 2025 |
Income Statement Analysis: The Bottom-Line Duel
This income statement comparison reveals which company drives superior profitability and operational efficiency in their respective markets.
Arm Holdings plc American Depositary Shares Analysis
Arm’s revenue surged nearly 24% from 2024 to 2025, reaching 4.0B USD. Net income more than doubled to 792M USD, reflecting strong momentum. The company maintains an exceptional gross margin near 95%, illustrating dominant cost control. Its net margin of almost 20% confirms robust bottom-line health and operational leverage.
Monolithic Power Systems, Inc. Analysis
Monolithic Power’s revenue climbed 26% to 2.79B USD in 2025, with net income at 616M USD. Its gross margin stands at a solid 55%, lower than Arm’s but still favorable. The net margin of 22% beats Arm’s slightly, though recent net margin growth turned negative, signaling some pressure on profitability despite top-line strength.
Margin Dominance vs. Net Income Growth
Arm outshines with higher revenue and gross margins, reflecting superior operational efficiency. Monolithic Power posts a stronger net margin but faces recent net margin contraction. Arm’s consistent margin expansion and net income growth present a more stable profit engine. Investors seeking sustained earnings momentum may favor Arm’s profile, while Monolithic Power’s margin resilience offers a different appeal.
Financial Ratios Comparison
These vital ratios act as a diagnostic tool to expose the underlying fiscal health, valuation premiums, and capital efficiency of the companies compared below:
| Ratios | Arm Holdings plc (ARM) | Monolithic Power Systems, Inc. (MPWR) |
|---|---|---|
| ROE | 11.58% | 16.55% |
| ROIC | 10.28% | 14.93% |
| P/E | 142 | 71 |
| P/B | 16.40 | 11.70 |
| Current Ratio | 5.20 | 5.91 |
| Quick Ratio | 5.20 | 4.38 |
| D/E | 0.05 | 0 |
| Debt-to-Assets | 4.0% | 0% |
| Interest Coverage | 0 | 0 |
| Asset Turnover | 0.45 | 0.65 |
| Fixed Asset Turnover | 5.61 | 4.45 |
| Payout ratio | 0 | 46.2% |
| Dividend yield | 0 | 0.65% |
| Fiscal Year | 2025 | 2025 |
Efficiency & Valuation Duel: The Vital Signs
Financial ratios serve as a company’s DNA, uncovering operational strengths and hidden risks essential for investment decisions.
Arm Holdings plc American Depositary Shares
Arm shows a moderate ROE of 11.58% with a strong net margin of 19.77%, signaling decent profitability. However, its valuation appears stretched, with a P/E of 141.58 and P/B of 16.4, both unfavorable. The firm pays no dividends, instead reinvesting heavily in R&D, reflecting a growth-focused capital allocation.
Monolithic Power Systems, Inc.
Monolithic Power posts a robust ROE of 16.55% and a higher net margin of 22.07%, highlighting operational efficiency. Its valuation, though still elevated, is less stretched with a P/E of 70.69 and P/B of 11.7. It offers a modest 0.65% dividend yield, balancing shareholder returns with ongoing growth investments.
Premium Valuation vs. Operational Efficiency
Monolithic Power presents a stronger profitability profile with more favorable ratios and a balanced shareholder return strategy. Arm’s valuation is significantly stretched, amplifying risk despite solid margins. Investors prioritizing growth with moderate risk may favor Monolithic Power’s profile over Arm’s premium valuation.
Which one offers the Superior Shareholder Reward?
I compare Arm Holdings plc (ARM) and Monolithic Power Systems, Inc. (MPWR) on distribution strategies. ARM pays no dividends, focusing on reinvesting free cash flow (0.17/share in 2025) into growth, while MPWR maintains a modest dividend yield (~0.65% in 2025) with a 46% payout ratio. MPWR’s consistent dividend and share buybacks, evidenced by steady dividend per share growth (from $2.39 in 2021 to $5.93 in 2025), indicate a shareholder-friendly capital allocation. ARM lacks buybacks but enjoys strong free cash flow generation and margin expansion, betting on long-term value via reinvestment. MPWR’s balanced approach delivers a sustainable total return combining yield and capital appreciation. I conclude MPWR offers a superior shareholder reward in 2026 due to its reliable distributions and prudent buyback intensity, aligning income with growth.
Comparative Score Analysis: The Strategic Profile
The radar chart reveals the fundamental DNA and trade-offs of Arm Holdings plc and Monolithic Power Systems, highlighting their strengths and vulnerabilities in key financial metrics:
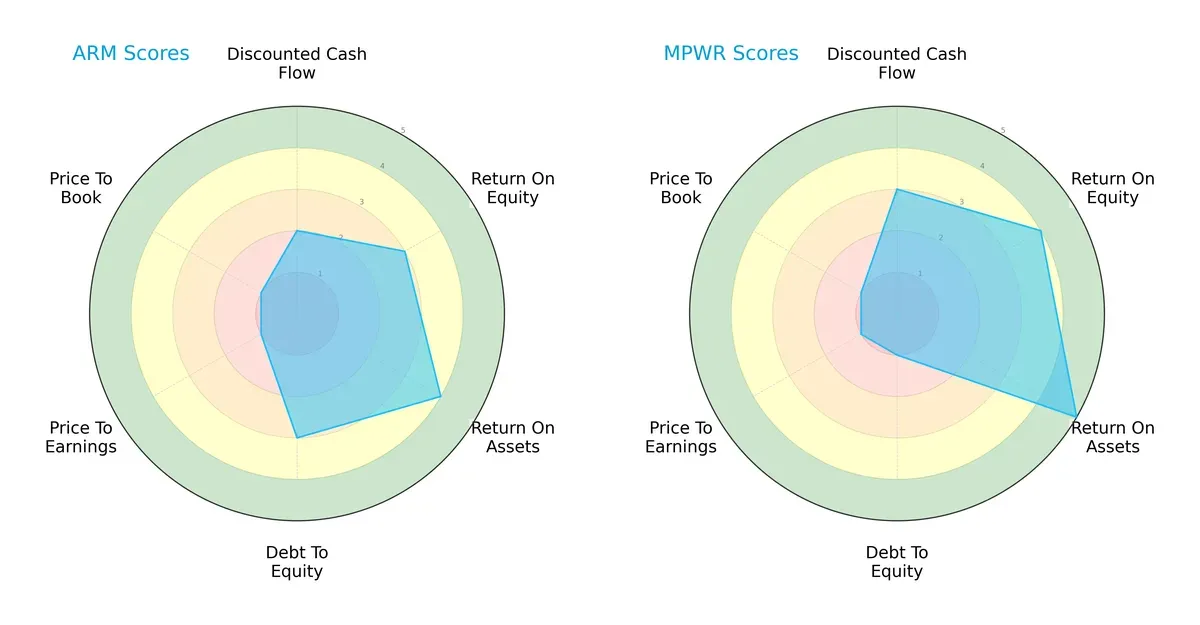
Arm shows a balanced profile with moderate ROE (3) and favorable ROA (4), paired with moderate debt levels (3). Monolithic excels in profitability (ROE 4, ROA 5) but carries heavier debt risk (1). Both share weak valuation scores (PE and PB at 1), signaling market skepticism. I see Monolithic’s edge in operational efficiency, while Arm holds steadier leverage control.
Bankruptcy Risk: Solvency Showdown
The Altman Z-Scores place both firms well within the safe zone:
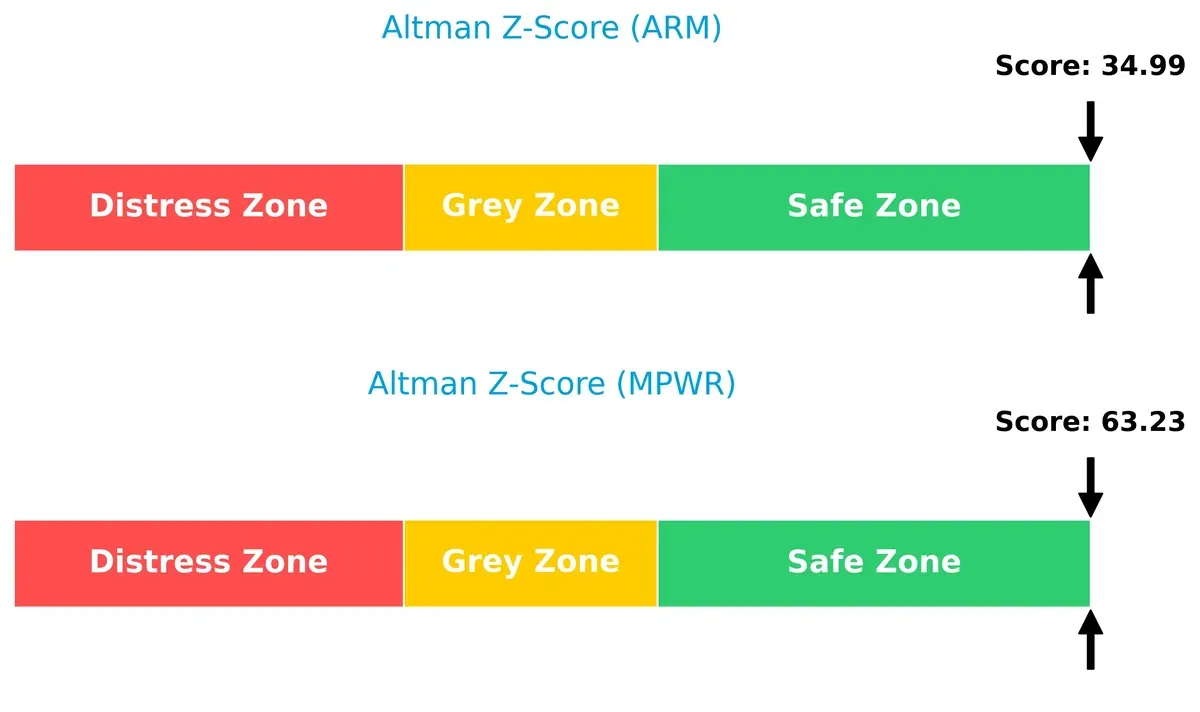
Arm’s Z-score of 35 contrasts with Monolithic’s higher 63, suggesting Monolithic has an even more robust buffer against bankruptcy risk. Both companies demonstrate resilient financial health in this cycle, although Arm’s lower score warrants close monitoring in volatile markets.
Financial Health: Quality of Operations
Piotroski F-Scores reflect similar operational quality for both companies:
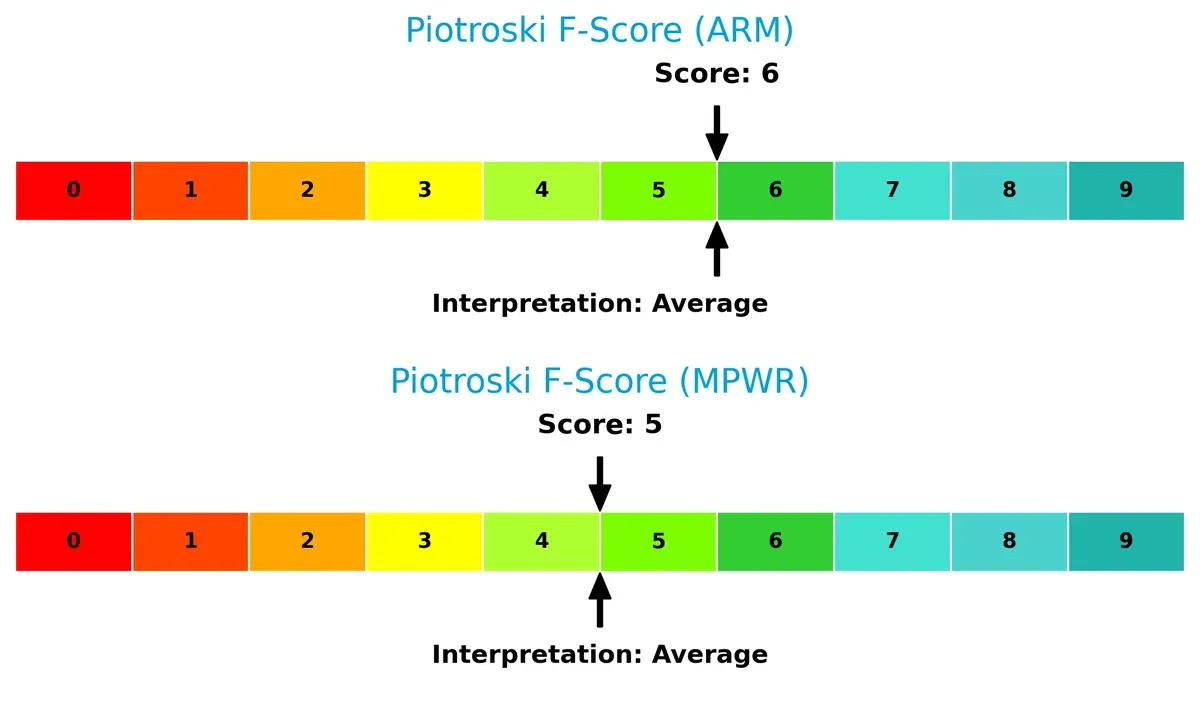
Arm’s score of 6 and Monolithic’s 5 both indicate average financial health. Neither shows red flags, but neither reaches peak strength either. This parity suggests both firms maintain sound internal metrics but should focus on improving efficiency and profitability to solidify investor confidence.
How are the two companies positioned?
This section dissects Arm and MPWR’s operational DNA by comparing their revenue distribution and internal dynamics. The goal is to confront their economic moats and identify which model offers the most resilient, sustainable advantage today.
Revenue Segmentation: The Strategic Mix
The following visual comparison dissects how Arm Holdings and Monolithic Power Systems diversify their income streams and where their primary sector bets lie:
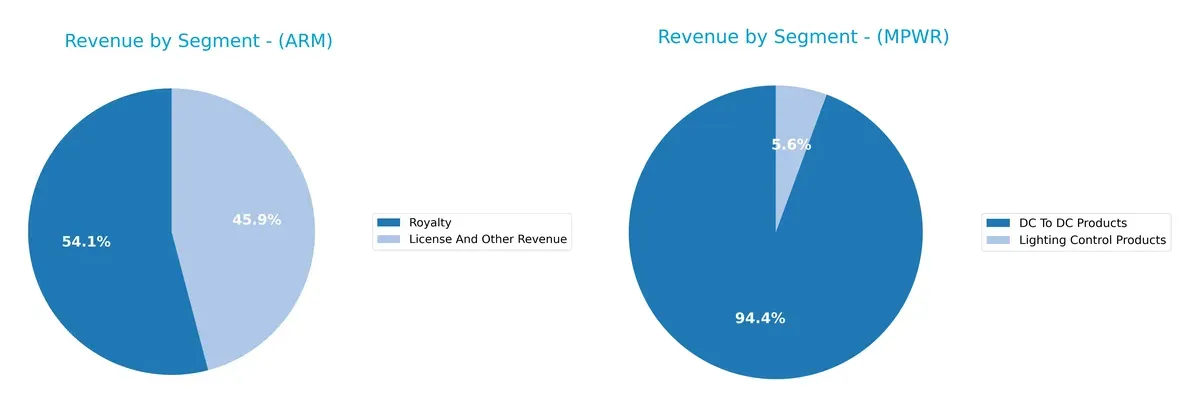
Arm Holdings balances revenue between License and Other Revenue at $1.8B and Royalties at $2.2B in 2025, showing a dual-stream model. In contrast, Monolithic Power Systems pivots heavily on DC To DC Products, generating $1.7B in 2023, while Lighting Control Products lag at $100M. Arm’s mix suggests ecosystem lock-in via licensing and royalties, while Monolithic Power Systems faces concentration risk anchored in one dominant segment.
Strengths and Weaknesses Comparison
This table compares the Strengths and Weaknesses of Arm and MPWR:
Arm Strengths
- Strong net margin at 19.77%
- Very low debt to equity of 0.05
- High quick ratio at 5.2
- Favorable fixed asset turnover of 5.61
- Diverse revenue from licenses and royalties
- Significant US market presence at 1.72B
MPWR Strengths
- Higher net margin at 22.07%
- Strong ROE and ROIC above 14%
- Zero debt enhances financial stability
- Favorable quick ratio at 4.38
- Consistent product revenue growth in DC to DC products
- Wide geographic reach including China and Taiwan
Arm Weaknesses
- ROIC below WACC at 10.28% vs 24.35% WACC
- Very high P/E of 141.58 and P/B of 16.4
- Current ratio unusually high at 5.2 suggests inefficient capital use
- Asset turnover low at 0.45
- No dividend yield
- Slightly unfavorable overall financial ratios
MPWR Weaknesses
- WACC high at 10.63%, slightly above ROIC
- Elevated P/E of 70.69 and P/B of 11.7
- Current ratio at 5.91 also signals capital inefficiency
- Neutral asset turnover at 0.65
- Low dividend yield at 0.65%
- Some unfavorable financial ratios remain
Arm shows strengths in profitability and low leverage but suffers from capital inefficiency and valuation concerns. MPWR offers superior profitability and balance sheet strength, yet also faces inefficiencies and high valuation multiples. Both must address capital deployment to optimize shareholder value.
The Moat Duel: Analyzing Competitive Defensibility
A structural moat is the only true shield protecting long-term profits from relentless competition erosion. Here’s how two semiconductor leaders defend their turf:
Arm Holdings plc: Intangible Assets Moat
Arm’s competitive edge lies in its vast intellectual property portfolio, licensing CPU architectures globally. This moat drives high gross margins near 95%, but a negative ROIC spread signals value destruction. Expansion into automotive and IoT markets in 2026 could deepen licensing opportunities or intensify margin pressures.
Monolithic Power Systems, Inc.: Cost Advantage Moat
Monolithic leverages integrated power electronics to deliver cost-efficient solutions, evidenced by a solid EBIT margin above 26%. Unlike Arm, MPWR creates value with a positive ROIC spread despite a recent decline. Growing industrial and automotive demand in 2026 offers avenues to reinforce its cost leadership.
Licensing IP vs. Cost Efficiency: The Moat Showdown
Arm’s intangible asset moat is wide but currently fails to convert into value creation, while MPWR’s cost advantage yields consistent value despite shrinking margins. I see Monolithic better positioned to protect and grow its market share through efficient capital use.
Which stock offers better returns?
The past year shows contrasting stock price dynamics: Arm Holdings declines steadily with decelerating losses, while Monolithic Power Systems rallies sharply with accelerating gains.
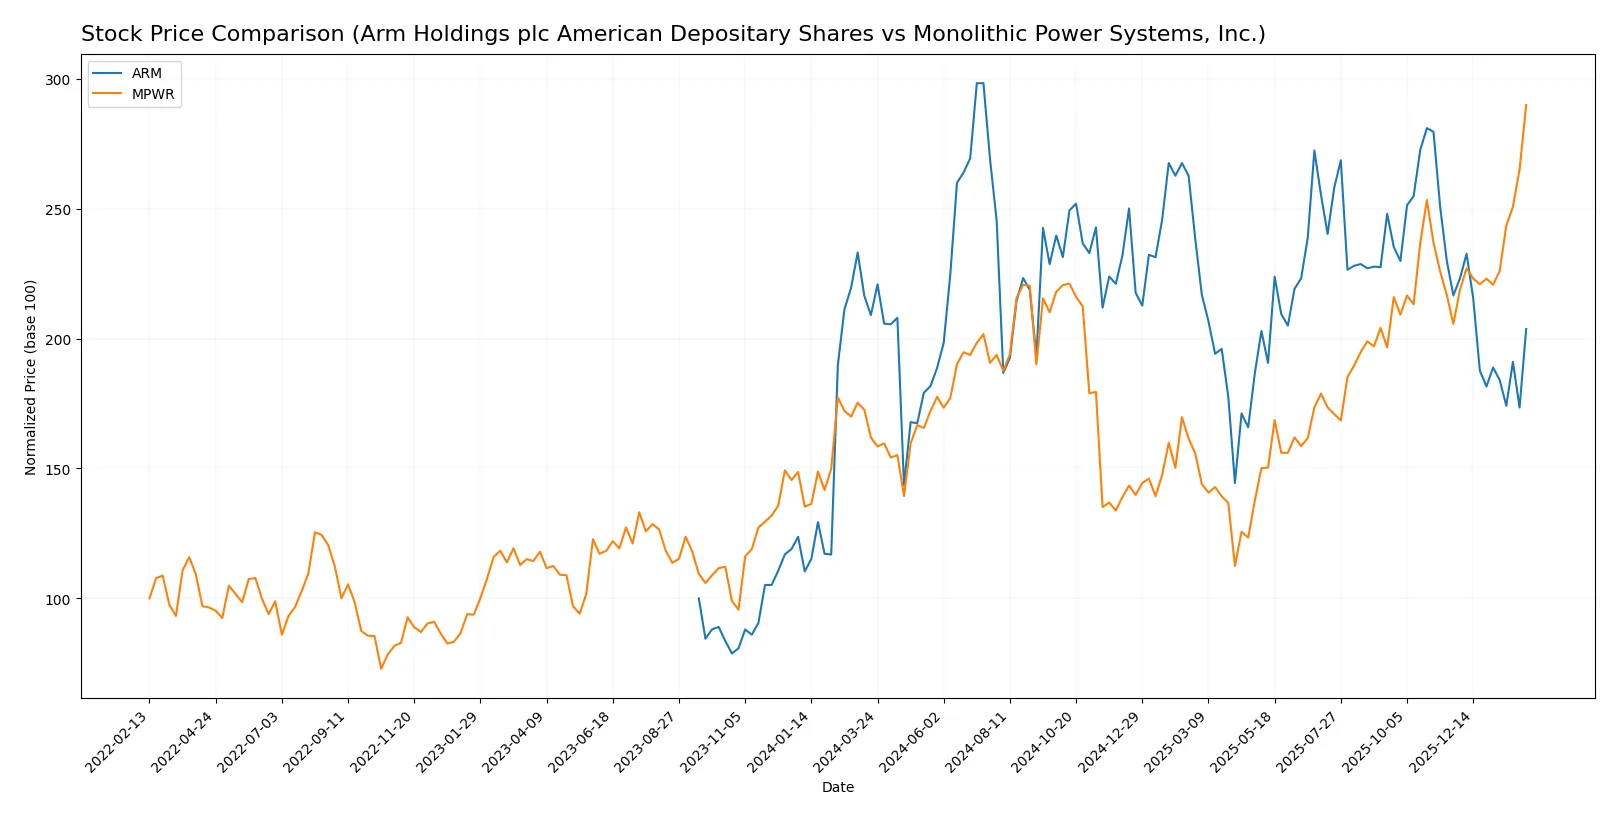
Trend Comparison
Arm Holdings’ stock fell 2.58% over the past 12 months, signaling a bearish trend marked by deceleration and a high volatility of 19.66. It peaked at 181.19 and troughed at 87.19.
Monolithic Power Systems surged 79.02% in the last year, confirming a strong bullish trend with accelerating momentum and extreme volatility at 150.74. The stock hit a high of 1229.82 and a low of 477.39.
Comparing both, Monolithic Power Systems delivered significantly higher market performance, outperforming Arm Holdings by a wide margin in price appreciation.
Target Prices
Analysts show strong confidence in Arm Holdings and Monolithic Power Systems with bullish target ranges.
| Company | Target Low | Target High | Consensus |
|---|---|---|---|
| Arm Holdings plc American Depositary Shares | 120 | 170 | 156.25 |
| Monolithic Power Systems, Inc. | 1200 | 1500 | 1313.71 |
The target consensus for Arm at $156.25 implies a 26% upside from the $123.7 price, signaling robust growth expectations. Monolithic Power’s $1313.71 consensus suggests a modest 7% premium to its current $1229.82 price, reflecting steady confidence.

Don’t Let Luck Decide Your Entry Point
Optimize your entry points with our advanced ProRealTime indicators. You’ll get efficient buy signals with precise price targets for maximum performance. Start outperforming now!
How do institutions grade them?
Arm Holdings plc American Depositary Shares Grades
The table below summarizes recent grades assigned by leading financial institutions for Arm Holdings plc:
| Grading Company | Action | New Grade | Date |
|---|---|---|---|
| Wells Fargo | Maintain | Overweight | 2026-02-05 |
| Benchmark | Maintain | Hold | 2026-02-05 |
| JP Morgan | Maintain | Overweight | 2026-02-05 |
| TD Cowen | Maintain | Buy | 2026-02-05 |
| Rosenblatt | Maintain | Buy | 2026-02-05 |
| Evercore ISI Group | Maintain | Outperform | 2026-02-05 |
| Mizuho | Maintain | Outperform | 2026-02-05 |
| UBS | Maintain | Buy | 2026-02-05 |
| RBC Capital | Maintain | Outperform | 2026-02-05 |
| Wells Fargo | Maintain | Overweight | 2026-01-26 |
Monolithic Power Systems, Inc. Grades
Below is a summary of recent grades from respected grading firms for Monolithic Power Systems, Inc.:
| Grading Company | Action | New Grade | Date |
|---|---|---|---|
| Truist Securities | Maintain | Buy | 2026-02-06 |
| Keybanc | Maintain | Overweight | 2026-02-06 |
| Rosenblatt | Maintain | Neutral | 2026-02-06 |
| Needham | Maintain | Buy | 2026-02-06 |
| Wells Fargo | Maintain | Overweight | 2026-02-06 |
| Stifel | Maintain | Buy | 2026-02-04 |
| Wells Fargo | Maintain | Overweight | 2026-01-26 |
| Wells Fargo | Upgrade | Overweight | 2026-01-15 |
| Truist Securities | Maintain | Buy | 2025-12-19 |
| Citigroup | Maintain | Buy | 2025-11-03 |
Which company has the best grades?
Arm Holdings holds a stronger consensus with multiple “Outperform” and “Buy” ratings from top-tier firms. Monolithic Power’s grades are generally positive but include a “Neutral.” The stronger grades for Arm may signal greater institutional confidence, potentially affecting investor sentiment.
Risks specific to each company
The following categories identify the critical pressure points and systemic threats facing both firms in the 2026 market environment:
1. Market & Competition
Arm Holdings plc American Depositary Shares
- Faces intense competition from global semiconductor IP licensors and chip designers, demanding constant innovation to maintain edge.
Monolithic Power Systems, Inc.
- Competes in power electronics with niche specialization, but faces pressure from diversified semiconductor companies expanding product lines.
2. Capital Structure & Debt
Arm Holdings plc American Depositary Shares
- Maintains very low debt (D/E 0.05), signaling conservative leverage and strong balance sheet discipline.
Monolithic Power Systems, Inc.
- No reported debt, indicating minimal financial risk from leverage but possibly less capital flexibility.
3. Stock Volatility
Arm Holdings plc American Depositary Shares
- Exhibits high beta (4.37), reflecting extreme sensitivity to market swings and potential investor nervousness.
Monolithic Power Systems, Inc.
- Shows moderate beta (1.46), suggesting relative stability and less vulnerability to market volatility.
4. Regulatory & Legal
Arm Holdings plc American Depositary Shares
- Operating globally, including China and US, faces complex IP-related and export control regulations, increasing compliance costs.
Monolithic Power Systems, Inc.
- Also global, with exposure to semiconductor export restrictions and environmental compliance, but less IP licensing risk.
5. Supply Chain & Operations
Arm Holdings plc American Depositary Shares
- Relies on chip manufacturers and OEMs globally; supply disruptions or geopolitical tensions could impair product delivery.
Monolithic Power Systems, Inc.
- Sources components internationally; supply chain risk mitigated by diversified customer base but still exposed to raw material shortages.
6. ESG & Climate Transition
Arm Holdings plc American Depositary Shares
- Faces pressure to reduce carbon footprint in design and licensing operations; ESG compliance critical for investor confidence.
Monolithic Power Systems, Inc.
- Power electronics focus aligns with energy efficiency trends; ESG initiatives could be a competitive advantage.
7. Geopolitical Exposure
Arm Holdings plc American Depositary Shares
- Significant exposure to UK, US, China, and Asia-Pacific markets introduces geopolitical risk, especially amid US-China tech tensions.
Monolithic Power Systems, Inc.
- US-based but globally diversified, with risks from trade policies and regional instability affecting production and sales.
Which company shows a better risk-adjusted profile?
Arm’s most impactful risk is its extreme stock volatility and high cost of capital, reflecting market skepticism despite strong IP moat. Monolithic Power Systems faces leverage concerns despite better profitability metrics. MPWR’s lower beta and stronger financial ratios suggest a more balanced risk-return profile in 2026. The stark difference in beta—4.37 vs. 1.46—justifies caution toward Arm’s stock price swings and cost of equity burden.
Final Verdict: Which stock to choose?
Arm Holdings excels as a technological innovator with a potent cash-generating model, bolstered by strong revenue growth and high margins. Its point of vigilance lies in its capital efficiency, where returns lag its cost of capital, pointing to potential value erosion. It fits portfolios targeting aggressive growth fueled by innovation.
Monolithic Power Systems offers a robust strategic moat through superior capital returns and operational efficiency, signaling disciplined capital allocation. It provides a safer profile relative to Arm, with solid profitability and a favorable financial stability score. It suits investors seeking growth at a reasonable price with a tilt toward stability.
If you prioritize disruptive growth and market-leading innovation, Arm Holdings is the compelling choice due to its rapid top-line expansion and margin strength. However, if you seek a blend of growth and financial discipline with better stability, Monolithic Power Systems outshines as a value creator with a proven moat and stronger capital efficiency.
Disclaimer: Investment carries a risk of loss of initial capital. The past performance is not a reliable indicator of future results. Be sure to understand risks before making an investment decision.
Go Further
I encourage you to read the complete analyses of Arm Holdings plc American Depositary Shares and Monolithic Power Systems, Inc. to enhance your investment decisions: