In the fast-evolving semiconductor industry, Micron Technology, Inc. (MU) and Arm Holdings plc (ARM) stand out as pivotal players driving innovation. Micron excels in memory and storage solutions, while Arm focuses on designing advanced microprocessor architectures. Both companies influence a diverse range of markets, from mobile devices to automotive technologies. This article will explore their strengths to help you decide which stock best fits your investment portfolio.
Table of contents
Companies Overview
I will begin the comparison between Micron Technology, Inc. and Arm Holdings plc American Depositary Shares by providing an overview of these two companies and their main differences.
Micron Technology, Inc. Overview
Micron Technology, Inc. designs, manufactures, and sells memory and storage products globally. Operating across four segments—Compute and Networking, Mobile, Storage, and Embedded—it provides DRAM, NAND, and NOR memory products for markets including cloud servers, enterprise, mobile devices, and automotive. Founded in 1978 and headquartered in Boise, Idaho, Micron is a major player in the semiconductors industry with a market cap of $373B.
Arm Holdings plc American Depositary Shares Overview
Arm Holdings plc develops and licenses CPU products and related technologies for semiconductor companies and OEMs. Its portfolio includes microprocessors, system IPs, GPUs, and software for automotive, computing infrastructure, consumer tech, and IoT markets. Founded in 1990 and based in Cambridge, UK, Arm is a subsidiary of Kronos II LLC with a market cap of $111B and operates internationally, including the US and Asia.
Key similarities and differences
Both Micron and Arm operate in the semiconductor industry, serving a diverse range of technology markets. Micron focuses on manufacturing memory and storage hardware, while Arm specializes in designing and licensing CPU architectures and related IP. Micron has a significantly larger workforce and market cap, reflecting its manufacturing scale, whereas Arm’s business model centers on licensing and intellectual property development, positioning it differently within the semiconductor ecosystem.
Income Statement Comparison
This table presents a side-by-side comparison of the latest fiscal year income statement metrics for Micron Technology, Inc. and Arm Holdings plc American Depositary Shares.

| Metric | Micron Technology, Inc. | Arm Holdings plc American Depositary Shares |
|---|---|---|
| Market Cap | 373B | 111B |
| Revenue | 37.4B | 4.01B |
| EBITDA | 18.5B | 903M |
| EBIT | 10.1B | 720M |
| Net Income | 8.54B | 792M |
| EPS | 7.65 | 0.75 |
| Fiscal Year | 2025 | 2025 |
Income Statement Interpretations
Micron Technology, Inc.
Micron Technology exhibited strong growth from 2021 to 2025, with revenue rising from $27.7B to $37.4B and net income surging from $5.9B to $8.5B. Margins improved significantly, with the gross margin at 39.8% and net margin reaching 22.8% in 2025. The latest fiscal year showed robust revenue growth of 48.9%, alongside a remarkable net margin expansion, indicating enhanced profitability.
Arm Holdings plc American Depositary Shares
Arm Holdings saw revenue nearly double from $2.0B in 2021 to $4.0B in 2025, with net income increasing from $388M to $792M. Gross margins are exceptionally high at 94.9%, while net margins stood at 19.8% in 2025. The most recent year delivered solid revenue growth of 23.9% and substantial improvements in EBIT and net margin, reflecting steady operational efficiency gains.
Which one has the stronger fundamentals?
Both companies show favorable income statement trends and margin improvements, but Micron Technology leads with higher net income and stronger margin growth overall. Arm Holdings boasts superior gross margins and significant revenue expansion. Micron’s broader margin improvements and larger absolute profit levels suggest more robust fundamentals, while Arm’s high margins highlight operational excellence.
Financial Ratios Comparison
The table below compares key financial ratios for Micron Technology, Inc. and Arm Holdings plc based on their most recent fiscal year data, allowing investors to evaluate performance metrics side by side.
| Ratios | Micron Technology, Inc. (MU) | Arm Holdings plc (ARM) |
|---|---|---|
| ROE | 15.8% | 11.6% |
| ROIC | 12.1% | 10.3% |
| P/E | 15.9 | 141.6 |
| P/B | 2.51 | 16.40 |
| Current Ratio | 2.52 | 5.20 |
| Quick Ratio | 1.79 | 5.20 |
| D/E (Debt-to-Equity) | 0.28 | 0.05 |
| Debt-to-Assets | 18.5% | 4.0% |
| Interest Coverage | 20.7 | 0 (not reported) |
| Asset Turnover | 0.45 | 0.45 |
| Fixed Asset Turnover | 0.79 | 5.61 |
| Payout ratio | 6.1% | 0% |
| Dividend yield | 0.38% | 0% |
Interpretation of the Ratios
Micron Technology, Inc.
Micron shows strong profitability with a 22.84% net margin and a 15.76% return on equity, supported by favorable leverage and liquidity ratios. However, its asset turnover and dividend yield are less impressive, suggesting operational efficiency and shareholder returns could improve. The company pays dividends, but the low yield of 0.38% and payout coverage should be closely monitored for sustainability.
Arm Holdings plc American Depositary Shares
Arm’s ratios reveal mixed strength with a solid 19.77% net margin but weaker returns on equity and invested capital. The very high P/E and price-to-book ratios signal market premium, while the low debt levels and high quick ratio indicate financial stability. Arm does not pay dividends, likely focusing on reinvestment and growth, which aligns with its technology and R&D intensity.
Which one has the best ratios?
Micron’s financial ratios present a more balanced profile with favorable profitability, leverage, and liquidity metrics despite some operational concerns. Arm exhibits higher valuation multiples and fewer favorable ratios overall, reflecting growth ambitions but greater risk. Therefore, Micron’s ratios are generally more favorable compared to Arm’s slightly unfavorable profile.
Strategic Positioning
This section compares the strategic positioning of Micron Technology, Inc. and Arm Holdings plc across Market position, Key segments, and Exposure to technological disruption:
Micron Technology, Inc.
- Large market cap of 373B in semiconductors; faces typical industry competitive pressure.
- Focuses on memory and storage products: DRAM, NAND, NOR, serving cloud, enterprise, mobile, automotive markets.
- Operates in manufacturing and direct product sales with exposure to hardware technology evolution.
Arm Holdings plc American Depositary Shares
- Market cap of 111B; operates in semiconductor IP licensing with distinct competitive dynamics.
- Specializes in CPU architecture, licensing microprocessors and IPs for automotive, computing, IoT markets.
- Exposure to IP and software tools innovation; disruption impacts licensing and royalty revenue streams.
Micron Technology, Inc. vs Arm Holdings plc Positioning
Micron holds a diversified product portfolio across memory and storage hardware segments, offering broad market exposure. Arm focuses on specialized semiconductor IP licensing, concentrating on CPU and related technologies. Micron’s approach spans manufacturing and sales, while Arm’s relies on licensing model with geographic diversity.
Which has the best competitive advantage?
Micron shows a slightly favorable moat with growing ROIC, indicating improving profitability and efficient capital use. Arm’s moat is unfavorable with stable but negative value creation, reflecting challenges in sustaining competitive advantage despite stable profitability.
Stock Comparison
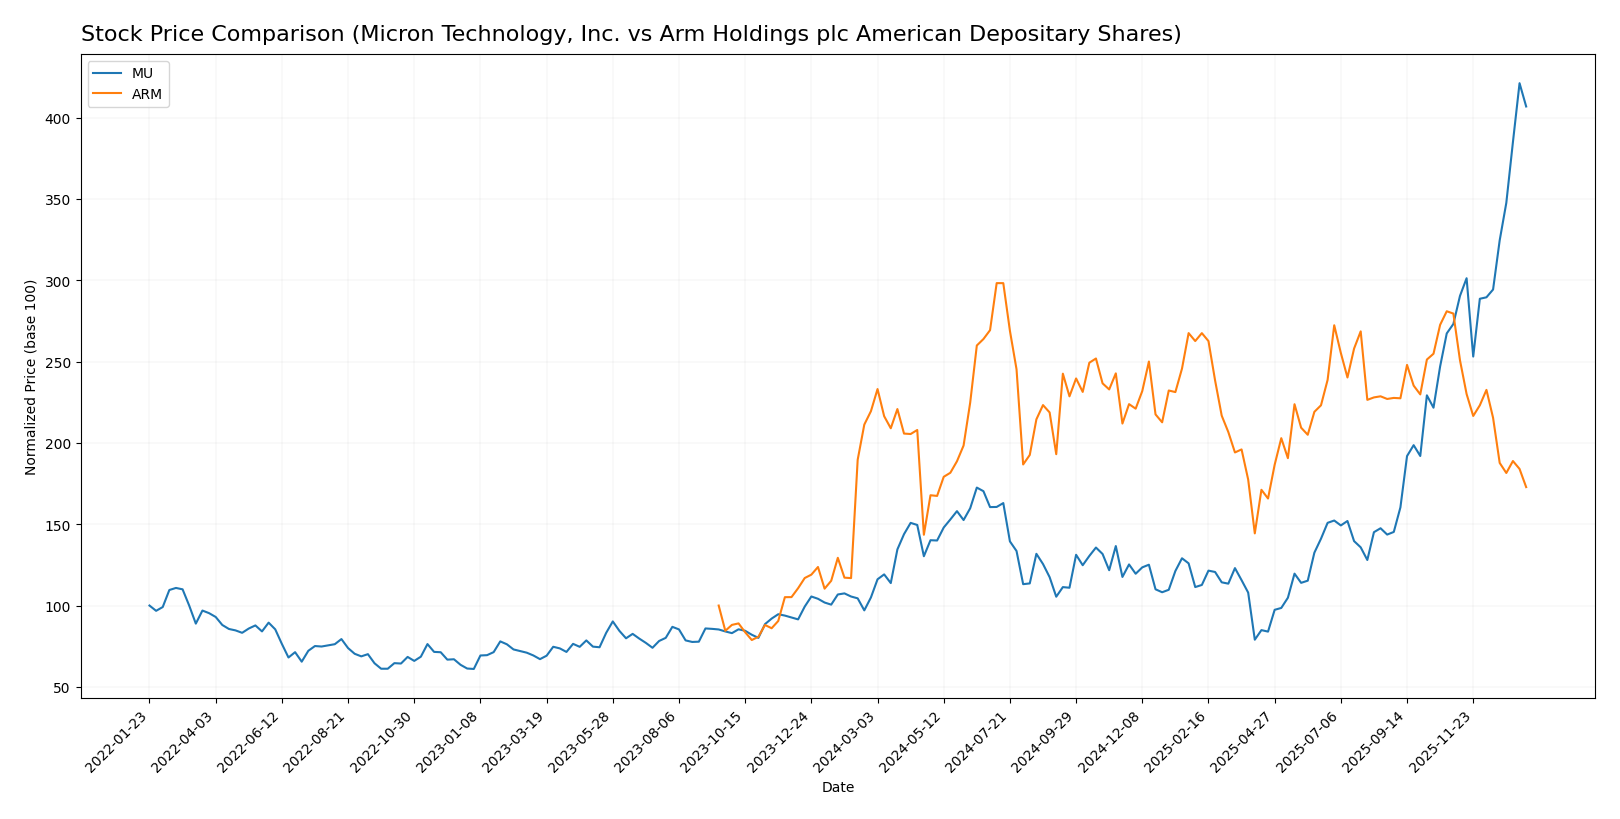
The past year has seen Micron Technology, Inc. (MU) exhibit a strong bullish trend with significant price appreciation and accelerating momentum, while Arm Holdings plc (ARM) faced a bearish trajectory marked by deceleration and declining prices.
Trend Analysis
Micron Technology, Inc. experienced a 287.62% price increase over the past 12 months, indicating a bullish trend with acceleration and a high volatility level reflected by a 57.56 standard deviation. The stock reached a high of 345.09 and a low of 64.72 during this period.
Arm Holdings plc recorded a -21.26% price change over the last year, confirming a bearish trend with deceleration. The stock showed less volatility with a standard deviation of 19.31, trading between 87.19 and 181.19.
Comparing both stocks, Micron Technology delivered the highest market performance with a substantial positive return, contrasting sharply with Arm Holdings’ negative trend and lower volatility.
Target Prices
The current analyst consensus for target prices shows a varied but optimistic outlook for both companies.
| Company | Target High | Target Low | Consensus |
|---|---|---|---|
| Micron Technology, Inc. | 450 | 190 | 328.22 |
| Arm Holdings plc American Depositary Shares | 210 | 120 | 166 |
Analysts expect Micron’s price to remain near its current level of 333.35 USD, with a consensus target slightly below, suggesting moderate upside potential. Arm Holdings’ consensus target of 166 USD is significantly above its current 104.99 USD price, indicating strong expected growth.
Analyst Opinions Comparison
This section compares analysts’ ratings and grades for Micron Technology, Inc. (MU) and Arm Holdings plc American Depositary Shares (ARM):
Rating Comparison
MU Rating
- Rating: B, classified as Very Favorable overall.
- Discounted Cash Flow Score: 1, indicating a Very Unfavorable valuation based on future cash flow.
- ROE Score: 4, showing Favorable efficiency in generating profit from shareholders’ equity.
- ROA Score: 5, Very Favorable in asset utilization to generate earnings.
- Debt To Equity Score: 3, reflecting Moderate financial risk with a balanced debt profile.
- Overall Score: 3, a Moderate summary assessment of financial standing.
ARM Rating
- Rating: B, classified as Very Favorable overall.
- Discounted Cash Flow Score: 3, indicating a Moderate valuation based on future cash flow.
- ROE Score: 3, showing Moderate efficiency in generating profit from shareholders’ equity.
- ROA Score: 4, Favorable in asset utilization to generate earnings.
- Debt To Equity Score: 4, Favorable with lower financial risk and stronger balance sheet.
- Overall Score: 3, a Moderate summary assessment of financial standing.
Which one is the best rated?
Both MU and ARM share the same overall rating of B and a Moderate overall score of 3. MU scores higher in ROE and ROA, while ARM has better discounted cash flow and debt to equity scores, indicating balanced strengths but no clear superiority in rating.
Scores Comparison
Here is a comparison of the Altman Z-Score and Piotroski Score for both companies:
MU Scores
- Altman Z-Score of 10.5 indicates a safe financial zone and low bankruptcy risk.
- Piotroski Score of 7 reflects strong financial health and investment potential.
ARM Scores
- Altman Z-Score of 32.4 indicates a safe financial zone and very low bankruptcy risk.
- Piotroski Score of 7 also reflects strong financial health and investment potential.
Which company has the best scores?
Both MU and ARM are in the safe zone for Altman Z-Score, but ARM’s score is significantly higher. Both have identical Piotroski Scores, showing equally strong financial health. ARM shows a stronger position on the bankruptcy risk scale.
Grades Comparison
The following analysis compares the recent grades assigned to Micron Technology, Inc. and Arm Holdings plc American Depositary Shares by recognized grading companies:
Micron Technology, Inc. Grades
This table presents recent grades from reputable firms for Micron Technology, Inc.:
| Grading Company | Action | New Grade | Date |
|---|---|---|---|
| Keybanc | Maintain | Overweight | 2026-01-13 |
| B of A Securities | Maintain | Buy | 2026-01-13 |
| Lynx Global | Maintain | Buy | 2026-01-12 |
| Mizuho | Maintain | Outperform | 2026-01-09 |
| UBS | Maintain | Buy | 2026-01-07 |
| Piper Sandler | Maintain | Overweight | 2026-01-07 |
| Piper Sandler | Maintain | Overweight | 2025-12-18 |
| Barclays | Maintain | Overweight | 2025-12-18 |
| Keybanc | Maintain | Overweight | 2025-12-18 |
| Wolfe Research | Maintain | Outperform | 2025-12-18 |
Micron Technology has consistently received positive grades, mostly “Buy,” “Overweight,” and “Outperform,” with stable ratings maintained over recent months.
Arm Holdings plc American Depositary Shares Grades
This table presents recent grades from reputable firms for Arm Holdings plc:
| Grading Company | Action | New Grade | Date |
|---|---|---|---|
| B of A Securities | Downgrade | Neutral | 2026-01-13 |
| B of A Securities | Maintain | Buy | 2025-12-16 |
| Goldman Sachs | Downgrade | Sell | 2025-12-15 |
| Loop Capital | Maintain | Buy | 2025-11-12 |
| TD Cowen | Maintain | Buy | 2025-11-06 |
| Rosenblatt | Maintain | Buy | 2025-11-06 |
| Wells Fargo | Maintain | Overweight | 2025-11-06 |
| Mizuho | Maintain | Outperform | 2025-11-06 |
| Barclays | Maintain | Overweight | 2025-11-06 |
| UBS | Maintain | Buy | 2025-11-06 |
Arm Holdings shows a mixed trend, with several “Buy” and “Overweight” ratings but also recent downgrades to “Neutral” and “Sell” from significant analysts.
Which company has the best grades?
Micron Technology has received a stronger and more consistent set of positive grades compared to Arm Holdings, which faces some recent downgrades. This difference may influence investor perceptions of relative stability and growth prospects in their portfolios.
Strengths and Weaknesses
Below is a comparative overview of key strengths and weaknesses for Micron Technology, Inc. (MU) and Arm Holdings plc (ARM) based on the most recent financial and operational data.
| Criterion | Micron Technology, Inc. (MU) | Arm Holdings plc (ARM) |
|---|---|---|
| Diversification | Moderate diversification across DRAM and NAND products, plus multiple business units (CNBU, EBU, MBU, SBU). | Revenue mainly from licensing and royalties, less diversified product base. |
| Profitability | Strong profitability with 22.8% net margin and favorable ROIC (12.1%), ROE 15.8%. | Moderate profitability: 19.8% net margin but unfavorable ROIC (10.3%) and high WACC (24.3%). |
| Innovation | Steady growth in ROIC (+8.2% trend) indicates improving operational efficiency. | Neutral ROIC trend, with high P/E (141.6) suggesting market expectations for future innovation. |
| Global presence | Established global footprint through semiconductor memory products; strong balance sheet. | Global IP licensing model with broad reach but high valuation risk and unstable profitability. |
| Market Share | Significant presence in DRAM and NAND markets; revenues of $28.6B (DRAM) and $8.5B (NAND) in 2025. | Leading position in semiconductor IP licensing; 2025 revenues $1.8B (licenses) and $2.2B (royalties). |
In summary, Micron Technology shows a slightly favorable moat with growing profitability and diversified semiconductor products, making it a relatively stable investment choice. Arm Holdings, while a market leader in IP licensing, faces challenges with value destruction and high valuation, warranting cautious consideration.
Risk Analysis
The table below summarizes key risk factors for Micron Technology, Inc. (MU) and Arm Holdings plc (ARM) based on their most recent financial and market data from 2025.
| Metric | Micron Technology, Inc. (MU) | Arm Holdings plc (ARM) |
|---|---|---|
| Market Risk | Beta 1.5 indicates moderate volatility with some sensitivity to market swings. | Beta 4.36 signals very high volatility and greater risk exposure to market fluctuations. |
| Debt Level | Debt-to-equity 0.28, low leverage with favorable interest coverage (21.26x). | Very low debt-to-equity 0.05, strong balance sheet, virtually no interest burden. |
| Regulatory Risk | US-based, subject to US semiconductor export controls and trade policies. | UK-based but operates globally including China, exposed to complex international regulations. |
| Operational Risk | Large scale manufacturing with 48K employees, risks in supply chain and production disruptions. | Smaller workforce (8.3K), reliance on IP licensing model reduces manufacturing operational risks. |
| Environmental Risk | Moderate, with industry pressure for sustainable semiconductor fabrication. | Moderate, with focus on product design rather than manufacturing, lower direct environmental impact. |
| Geopolitical Risk | High exposure to US-China tensions affecting semiconductor supply and sales. | Significant geopolitical risk due to operations across US, China, Taiwan, and South Korea. |
Micron’s most impactful risks are geopolitical tensions and operational complexities in manufacturing, while Arm faces very high market volatility and geopolitical risks due to its global footprint. Both have strong balance sheets, but Arm’s valuation metrics suggest higher market risk. Investors should weigh these factors carefully in portfolio allocation.
Which Stock to Choose?
Micron Technology, Inc. (MU) shows a strong income evolution with a 48.85% revenue growth in 2025 and favorable profitability metrics, including a 22.84% net margin and 15.76% ROE. Its debt ratios are solid and rating is very favorable.
Arm Holdings plc (ARM) exhibits favorable income growth, with 23.94% revenue growth and a high gross margin of 94.86%. However, its financial ratios are less favorable overall, with a high WACC and elevated valuation multiples, despite low debt and a very favorable rating.
Considering ratings and comprehensive financials, MU might appeal more to investors seeking improving profitability and a favorable ratio profile, while ARM may suit those prioritizing growth potential but tolerant of higher valuation and risk.
Disclaimer: Investment carries a risk of loss of initial capital. The past performance is not a reliable indicator of future results. Be sure to understand risks before making an investment decision.
Go Further
I encourage you to read the complete analyses of Micron Technology, Inc. and Arm Holdings plc American Depositary Shares to enhance your investment decisions: