Home > Comparison > Technology > ARM vs MXL
The strategic rivalry between Arm Holdings plc and MaxLinear, Inc. shapes the semiconductor industry’s evolution. Arm commands the market with its intellectual property licensing model, enabling broad ecosystem integration. MaxLinear operates as a focused semiconductor manufacturer specializing in high-performance analog and RF SoCs. This analysis will evaluate which company’s operational model and innovation trajectory offer superior risk-adjusted returns for a diversified portfolio amid sector-wide technological shifts.
Table of contents
Companies Overview
Arm Holdings and MaxLinear stand as pivotal players in the semiconductor industry, shaping future technology landscapes.
Arm Holdings plc American Depositary Shares: Architect of Microprocessor Innovation
Arm Holdings dominates the semiconductor market by licensing CPU architectures and related IPs to chipmakers globally. Its core revenue stems from royalties and licensing fees on microprocessors, GPUs, and system IP. In 2026, the company emphasizes expanding its footprint in automotive and IoT sectors, leveraging its scalable and energy-efficient designs to capture emerging markets.
MaxLinear, Inc.: Integrated Communications SoC Specialist
MaxLinear crafts high-performance analog and mixed-signal SoCs that power broadband, wireless infrastructure, and industrial applications. Its revenue primarily comes from selling integrated communication platforms, including RF front ends and data converters. The firm focuses on enhancing 5G infrastructure and home networking solutions, aiming to serve OEMs and ODMs with cutting-edge, end-to-end communication technologies.
Strategic Collision: Similarities & Divergences
Both firms operate in semiconductors but diverge sharply: Arm drives an IP licensing model, fostering broad ecosystem adoption, while MaxLinear pursues a product-driven, integrated hardware approach. Their competition centers on connectivity and infrastructure markets, but Arm’s scalable architecture contrasts with MaxLinear’s system integration focus. These differences shape distinct investment profiles—Arm as a high-beta growth licensor, MaxLinear as a specialized hardware supplier with steadier dynamics.
Income Statement Comparison
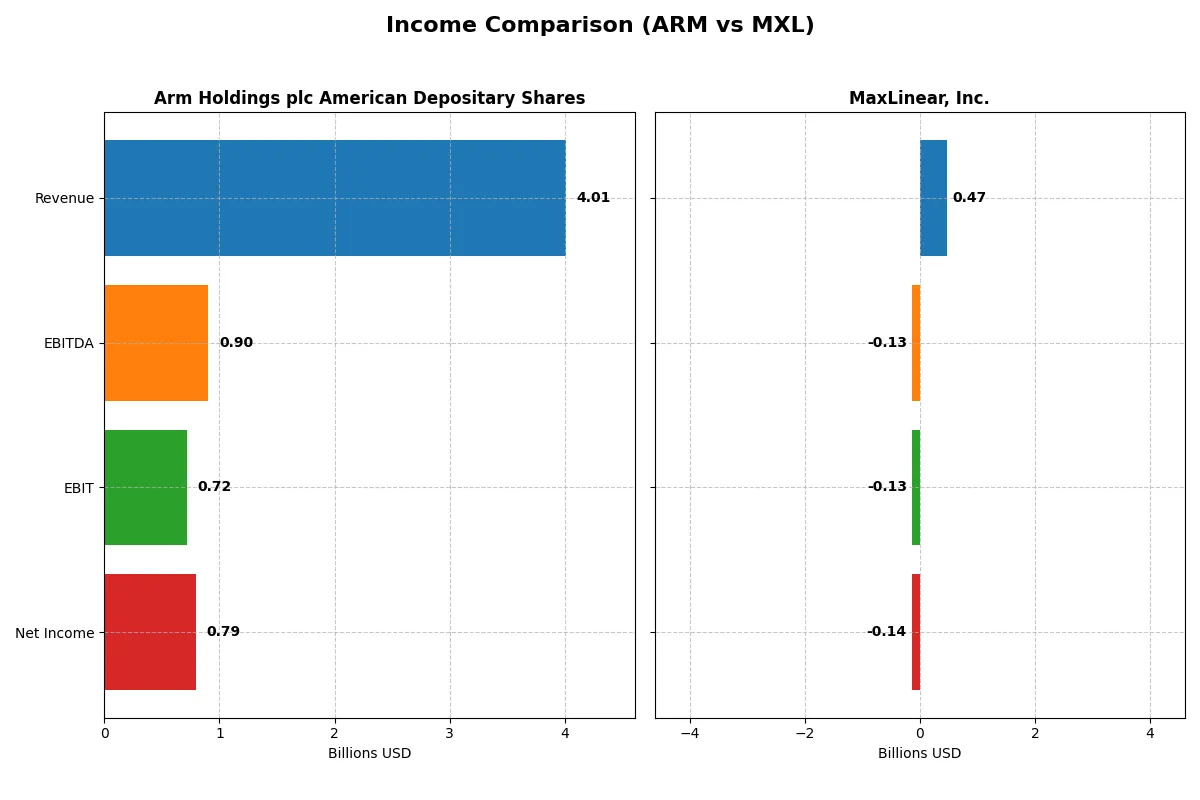
This data dissects the core profitability and scalability of both corporate engines to reveal who dominates the bottom line:
| Metric | Arm Holdings plc (ARM) | MaxLinear, Inc. (MXL) |
|---|---|---|
| Revenue | 4B | 468M |
| Cost of Revenue | 206M | 202M |
| Operating Expenses | 2.97B | 393M |
| Gross Profit | 3.8B | 266M |
| EBITDA | 903M | -131M |
| EBIT | 720M | -131M |
| Interest Expense | 0 | 10M |
| Net Income | 792M | -137M |
| EPS | 0.75 | -1.58 |
| Fiscal Year | 2025 | 2025 |
Income Statement Analysis: The Bottom-Line Duel
This income statement comparison reveals the true efficiency and profitability of Arm Holdings and MaxLinear’s corporate engines over recent years.
Arm Holdings plc American Depositary Shares Analysis
Arm Holdings doubles its revenue from $2.0B in 2021 to $4.0B in 2025, with net income surging from $388M to $792M. Its gross margin remains an exceptional 94.9%, while net margin improves to nearly 20%. In 2025, Arm’s operating efficiency accelerates sharply, with EBIT growing 240% year-over-year, showcasing strong momentum and operational mastery.
MaxLinear, Inc. Analysis
MaxLinear’s revenue declines nearly 48% over five years, falling to $468M in 2025 despite a recent 30% rebound. Net losses deepen, reaching -$137M in 2025, reflecting persistent profitability challenges. Gross margin holds at a modest 57%, but a negative EBIT margin near -28% signals ongoing operational inefficiency. Recent margin improvements show progress, yet losses persist.
Margin Power vs. Revenue Scale
Arm Holdings clearly outperforms MaxLinear with robust revenue growth, high margins, and positive net income. MaxLinear struggles with shrinking top-line and sustained losses despite some recent recovery. Arm’s profile suits investors seeking scalable profitability, while MaxLinear remains a riskier turnaround play with uncertain earnings prospects.
Financial Ratios Comparison
These vital ratios act as a diagnostic tool to expose the underlying fiscal health, valuation premiums, and capital efficiency of the companies compared below:
| Ratios | Arm Holdings plc (ARM) | MaxLinear, Inc. (MXL) |
|---|---|---|
| ROE | 11.6% | -47.5% |
| ROIC | 10.3% | -24.3% |
| P/E | 142 | -6.7 |
| P/B | 16.4 | 3.20 |
| Current Ratio | 5.20 | 1.77 |
| Quick Ratio | 5.20 | 1.28 |
| D/E | 0.05 | 0.29 |
| Debt-to-Assets | 4.0% | 17.2% |
| Interest Coverage | 0 | -15.5 |
| Asset Turnover | 0.45 | 0.42 |
| Fixed Asset Turnover | 5.61 | 4.65 |
| Payout ratio | 0 | 0 |
| Dividend yield | 0 | 0 |
| Fiscal Year | 2025 | 2024 |
Efficiency & Valuation Duel: The Vital Signs
Financial ratios act as a company’s DNA, exposing hidden risks and operational strengths crucial for investors’ strategic decisions.
Arm Holdings plc American Depositary Shares
Arm reports a solid net margin of 19.77% and a neutral ROE at 11.58%, but its ROIC of 10.28% falls below a high WACC of 24.32%, signaling capital inefficiency. Valuation looks stretched with a P/E of 141.58 and P/B at 16.4. Though it pays no dividends, Arm reinvests heavily in R&D, supporting growth.
MaxLinear, Inc.
MaxLinear suffers from a steep net margin loss of -68.01% and a sharply negative ROE at -47.49%, reflecting operational distress. Despite a favorable P/E of -6.74, its P/B at 3.2 and poor interest coverage highlight financial strain. It offers no dividend, directing resources toward R&D amid ongoing losses.
Premium Valuation vs. Operational Struggles
Arm’s premium valuation reflects growth ambitions but also capital inefficiency and valuation risk. MaxLinear’s unfavorable profitability and cash flow metrics pose high risk despite lower valuation multiples. Investors seeking growth with risk tolerance may prefer Arm, while those cautious of operational losses might avoid both.
Which one offers the Superior Shareholder Reward?
Arm Holdings (ARM) pays no dividends but generates robust free cash flow (0.17/share in 2025) with a strong balance sheet and negligible debt. Its buyback program is modest but sustainable given high cash ratios and operating margins near 20%. MaxLinear (MXL) also pays no dividend and suffers negative net margins (-68% in 2024) with free cash flow deeply negative (-0.75/share in 2024). MXL’s buybacks are limited by weak cash flow and high leverage. I conclude ARM offers a far superior total return profile in 2026, driven by sustainable cash flow reinvested into growth rather than risky buybacks or dividends.
Comparative Score Analysis: The Strategic Profile
The radar chart reveals the fundamental DNA and trade-offs of Arm Holdings plc and MaxLinear, Inc.:
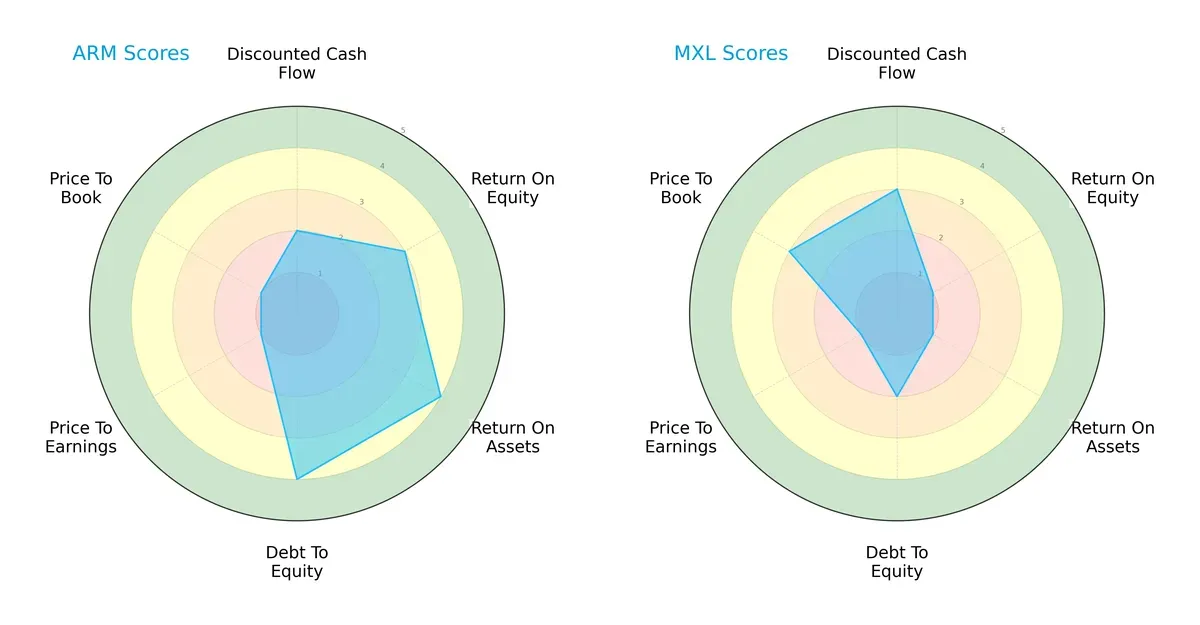
Arm Holdings shows strength in asset utilization and financial leverage with high scores in ROA (4) and Debt/Equity (4). MaxLinear holds a slight edge in discounted cash flow (3) and price-to-book valuation (3), yet it struggles with profitability metrics, scoring only 1 in ROE and ROA. Arm presents a more balanced profile, while MaxLinear relies heavily on valuation metrics, exposing vulnerabilities in operational efficiency.
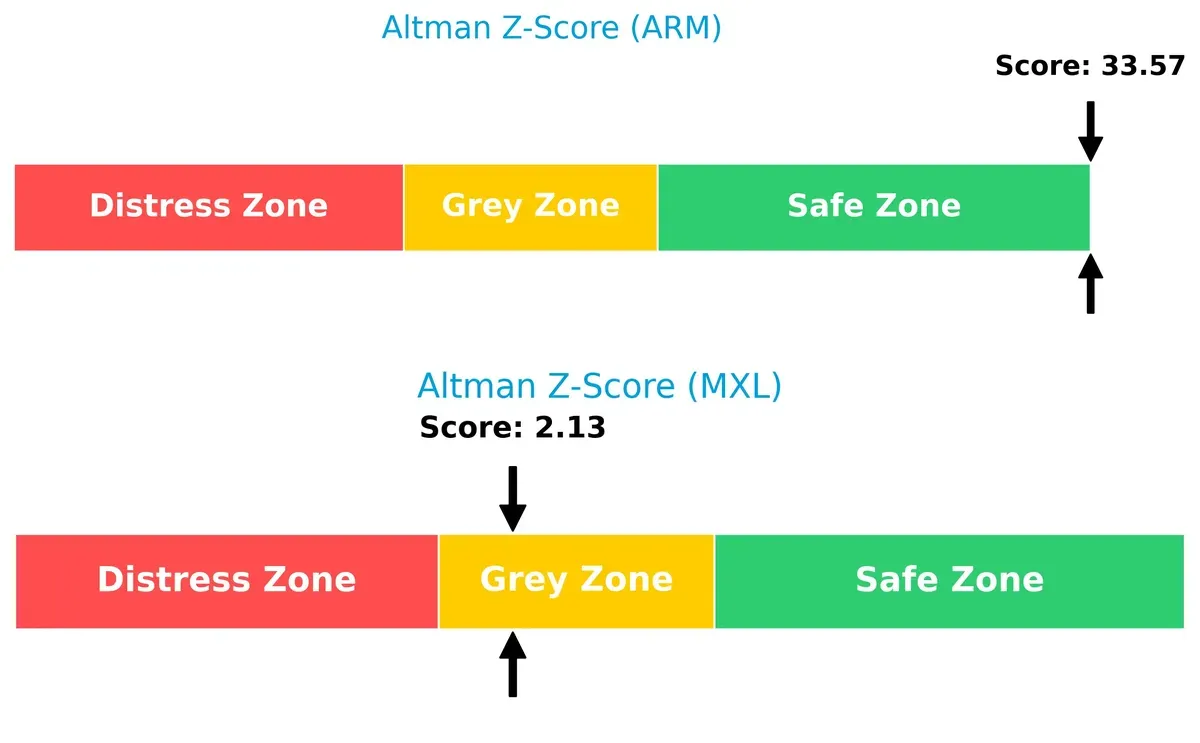
Bankruptcy Risk: Solvency Showdown
Arm’s Altman Z-Score (33.6) far exceeds MaxLinear’s (2.13), signaling clear financial resilience versus moderate distress risk for MaxLinear in this cycle:
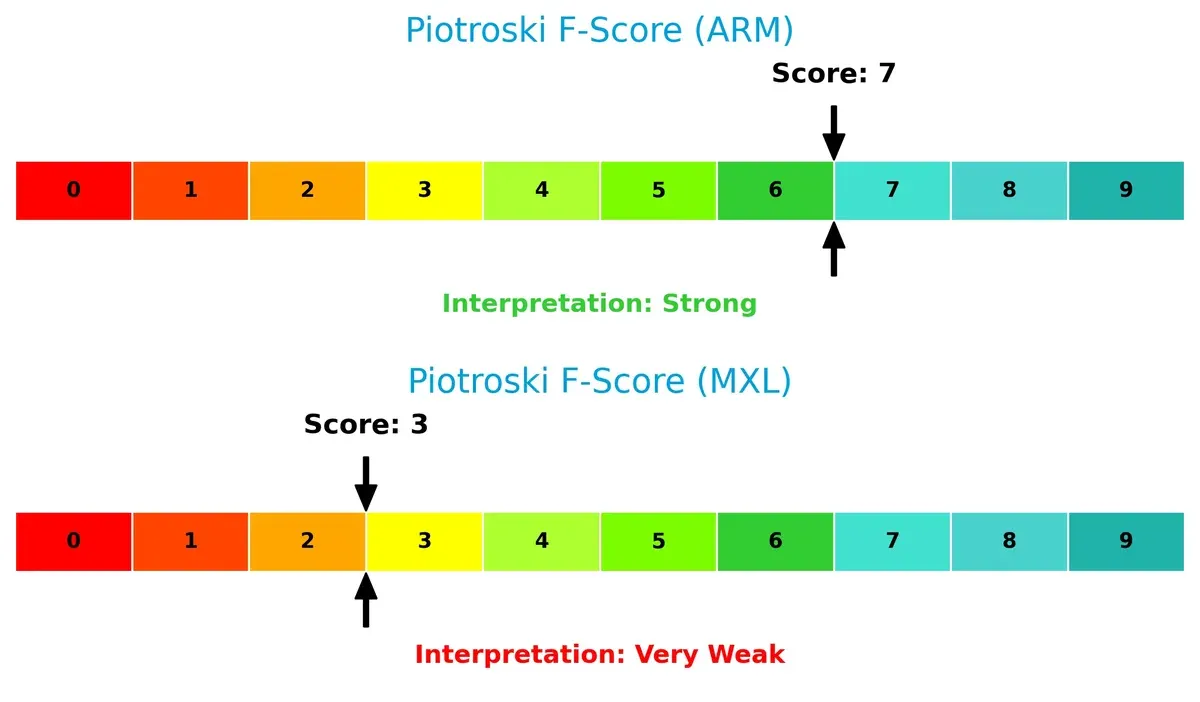
Financial Health: Quality of Operations
Arm scores a robust 7 on the Piotroski F-Score, indicating strong internal financial health. MaxLinear’s 3 signals red flags, with weak operational quality and potential value traps:
How are the two companies positioned?
This section dissects the operational DNA of Arm and MaxLinear by comparing their revenue distribution and internal dynamics. The goal is to confront their economic moats to identify the most resilient, sustainable competitive advantage today.
Revenue Segmentation: The Strategic Mix
This visual comparison dissects how Arm Holdings and MaxLinear diversify their income streams and where their primary sector bets lie:
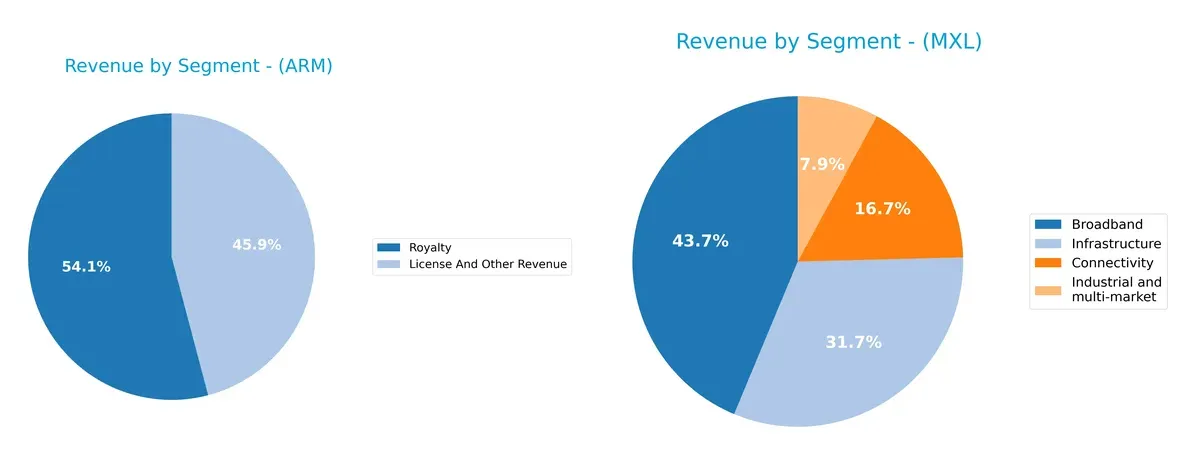
Arm Holdings anchors its revenue in two dominant segments: $2.17B in Royalty and $1.84B in License and Other Revenue. MaxLinear displays a more diversified mix across Broadband ($204M), Infrastructure ($148M), Connectivity ($78M), and Industrial ($37M). Arm’s model pivots on ecosystem lock-in via royalties, exposing less segment risk. MaxLinear’s spread cushions against sector shocks but lacks the scale to dominate infrastructure or connectivity.
Strengths and Weaknesses Comparison
This table compares the Strengths and Weaknesses of Arm Holdings plc and MaxLinear, Inc.:
Arm Strengths
- High net margin of 19.77%
- Very low debt-to-assets at 3.99%
- Strong quick ratio at 5.2
- Robust fixed asset turnover of 5.61
- Diverse revenue streams from licensing and royalties
- Significant global presence with large US and Asian markets
MaxLinear Strengths
- Favorable current and quick ratios at 1.77 and 1.28
- Moderate debt-to-assets at 17.23%
- Favorable price-to-earnings despite losses
- Revenue diversification across broadband, connectivity, infrastructure, and industrial segments
- Presence in Asia and US markets
- Reasonable fixed asset turnover of 4.65
Arm Weaknesses
- Unfavorable ROIC at 10.28% below WACC of 24.32%
- Very high valuation multiples: PE 141.58, PB 16.4
- Unusually high current ratio may indicate inefficient asset use
- Asset turnover low at 0.45
- No dividend yield
- Slightly unfavorable overall ratio profile
MaxLinear Weaknesses
- Negative profitability ratios: net margin -68%, ROE -47%, ROIC -24%
- Negative interest coverage at -13.01
- Unfavorable asset turnover at 0.42
- PB ratio weak at 3.2
- No dividend yield
- Unfavorable overall financial health
Arm demonstrates strong profitability and conservative leverage but struggles with valuation and capital efficiency. MaxLinear shows revenue diversification and decent liquidity but faces severe profitability and operational challenges. Both companies must address these weaknesses to optimize their strategic positioning.
The Moat Duel: Analyzing Competitive Defensibility
A structural moat is the only thing protecting long-term profits from relentless competition erosion. Let’s dissect the defensive barriers of two semiconductor firms:
Arm Holdings plc: Licensing Network Effects Moat
Arm’s primary moat lies in its extensive licensing model and embedded network effects. This manifests as high gross margins (95%) and stable net margins (~20%), reflecting pricing power. In 2026, expanding into automotive and IoT markets could deepen its moat, but rising competition in chip design poses risks.
MaxLinear, Inc.: Integration and Cost Advantage Moat
MaxLinear’s moat stems from cost-efficient, integrated RF and mixed-signal SoCs, contrasting Arm’s licensing. Despite recent revenue growth, it suffers negative EBIT and net margins, signaling weaker profitability. Opportunities in 5G and data infrastructure exist, but margin pressure and declining ROIC warn of fragility.
Licensing Network Effects vs. Cost Integration Efficiency
Arm’s wider moat leverages strong network effects and licensing scale, delivering consistent profitability. MaxLinear’s moat is narrower, challenged by shrinking ROIC and negative margins. Arm stands better equipped to defend and grow market share in 2026.
Which stock offers better returns?
The past year shows notable price declines for both stocks, with Arm Holdings experiencing sharper drops and MaxLinear showing a recent rebound in trading dynamics.
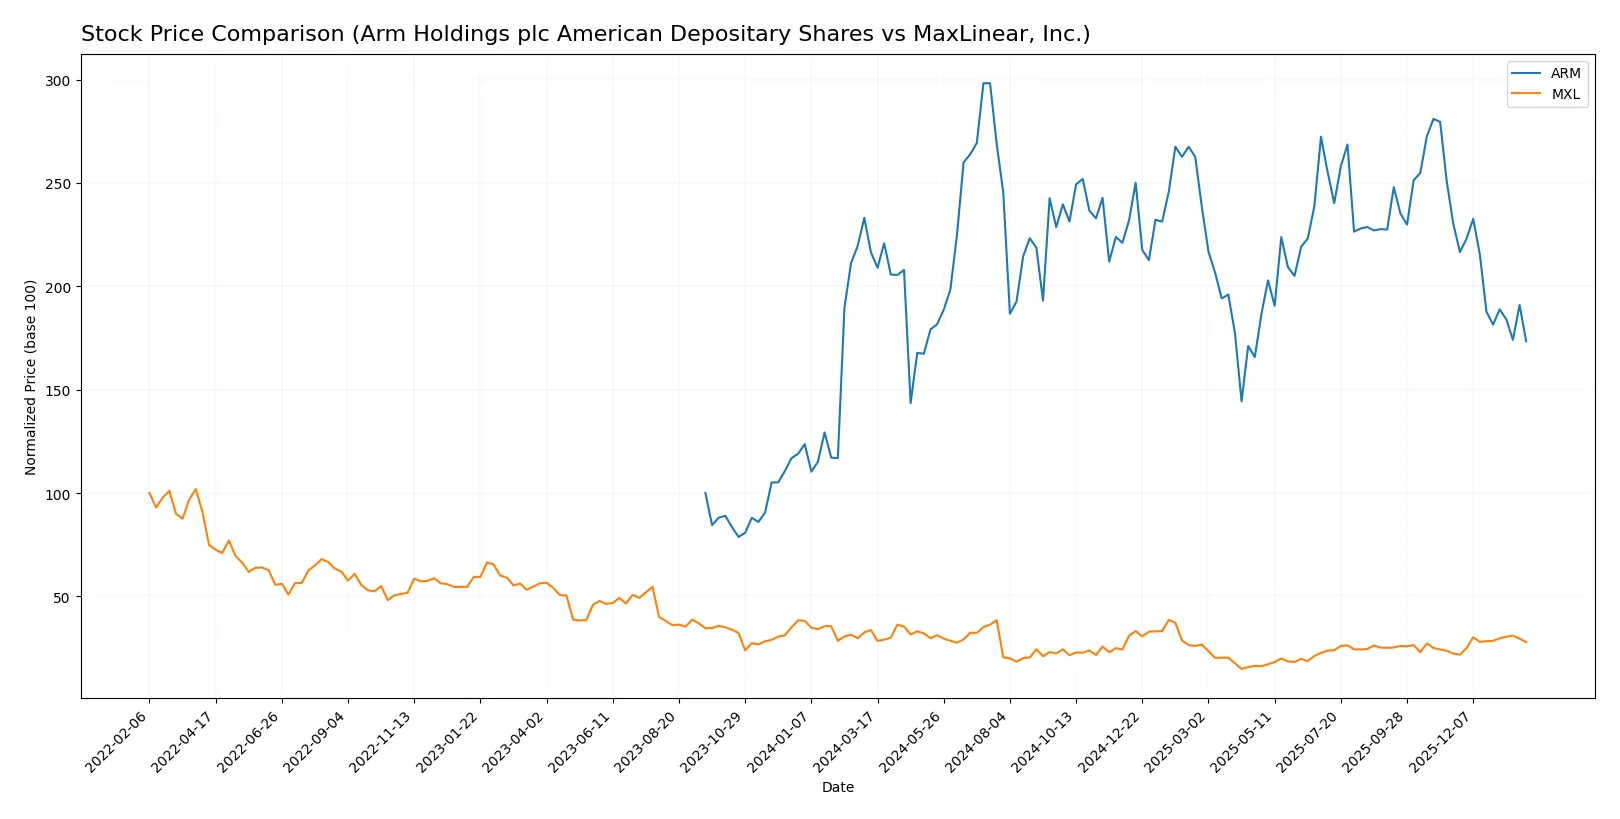
Trend Comparison
Arm Holdings plc’s stock fell 19.87% over the last 12 months, marking a bearish trend with deceleration in price decline and high volatility at 19.62%. The stock peaked at 181.19 and bottomed at 87.19.
MaxLinear’s stock dropped 17.26% over the same period, also bearish, but the trend recently accelerated positively. Volatility remains low at 3.37%, with prices ranging from 9.31 to 24.05.
MaxLinear outperformed Arm Holdings recently, posting a 24.82% gain from November 2025 to February 2026, while Arm declined further by 24.62%, delivering stronger market performance.
Target Prices
Analysts present a clear consensus on target prices for Arm Holdings plc and MaxLinear, Inc.
| Company | Target Low | Target High | Consensus |
|---|---|---|---|
| Arm Holdings plc American Depositary Shares | 120 | 170 | 145 |
| MaxLinear, Inc. | 15 | 25 | 21 |
The consensus target for Arm Holdings is 145, well above its current 105.36 price, indicating strong upside potential. MaxLinear’s 21 consensus also exceeds its current 17.35 price, suggesting moderate growth expectations.

Don’t Let Luck Decide Your Entry Point
Optimize your entry points with our advanced ProRealTime indicators. You’ll get efficient buy signals with precise price targets for maximum performance. Start outperforming now!
How do institutions grade them?
This section compares the recent grades from major financial institutions for both companies:
Arm Holdings plc American Depositary Shares Grades
The following table summarizes Arm Holdings plc’s recent grades from reputable institutions.
| Grading Company | Action | New Grade | Date |
|---|---|---|---|
| UBS | Maintain | Buy | 2026-01-26 |
| Wells Fargo | Maintain | Overweight | 2026-01-26 |
| Morgan Stanley | Maintain | Overweight | 2026-01-23 |
| Susquehanna | Upgrade | Positive | 2026-01-21 |
| B of A Securities | Downgrade | Neutral | 2026-01-13 |
| B of A Securities | Maintain | Buy | 2025-12-16 |
| Goldman Sachs | Downgrade | Sell | 2025-12-15 |
| Loop Capital | Maintain | Buy | 2025-11-12 |
| Benchmark | Maintain | Hold | 2025-11-06 |
| Needham | Maintain | Hold | 2025-11-06 |
MaxLinear, Inc. Grades
The following table presents MaxLinear, Inc.’s recent grades from established financial firms.
| Grading Company | Action | New Grade | Date |
|---|---|---|---|
| Wells Fargo | Maintain | Equal Weight | 2026-01-30 |
| Benchmark | Maintain | Buy | 2026-01-16 |
| Benchmark | Maintain | Buy | 2025-10-24 |
| Benchmark | Maintain | Buy | 2025-10-17 |
| Benchmark | Maintain | Buy | 2025-09-02 |
| Loop Capital | Maintain | Hold | 2025-08-04 |
| Susquehanna | Maintain | Neutral | 2025-07-24 |
| Wells Fargo | Maintain | Equal Weight | 2025-07-24 |
| Benchmark | Maintain | Buy | 2025-07-24 |
| Susquehanna | Maintain | Neutral | 2025-07-22 |
Which company has the best grades?
Arm Holdings shows a broader range of opinions, with several “Buy” and “Overweight” ratings but also notable downgrades including a “Sell.” MaxLinear maintains mostly “Buy” and “Equal Weight” grades with fewer downgrades. Investors may view Arm’s mixed grades as higher volatility in outlook, while MaxLinear’s consistent “Buy” ratings suggest steadier institutional confidence.
Risks specific to each company
The following categories identify critical pressure points and systemic threats facing both firms in the 2026 market environment:
1. Market & Competition
Arm Holdings plc American Depositary Shares
- Dominates semiconductor licensing with a strong IP portfolio but faces high valuation risk.
MaxLinear, Inc.
- Faces declining profitability and intense competition in mixed-signal communications SoCs.
2. Capital Structure & Debt
Arm Holdings plc American Depositary Shares
- Maintains very low debt-to-equity (0.05) and strong interest coverage, signaling robust financial stability.
MaxLinear, Inc.
- Higher debt ratio (0.29) with negative interest coverage, indicating leverage stress and refinancing risk.
3. Stock Volatility
Arm Holdings plc American Depositary Shares
- Exhibits high beta of 4.36, reflecting significant market sensitivity and price swings.
MaxLinear, Inc.
- Beta at 1.77, less volatile but still exposed to semiconductor sector cyclicality.
4. Regulatory & Legal
Arm Holdings plc American Depositary Shares
- Operates globally including China, facing potential export controls and IP protection challenges.
MaxLinear, Inc.
- Primarily US-based, with regulatory risk concentrated in telecommunications standards and compliance.
5. Supply Chain & Operations
Arm Holdings plc American Depositary Shares
- Complex global supply chain with exposure to semiconductor manufacturing bottlenecks.
MaxLinear, Inc.
- Relies on component suppliers for RF and analog chips, vulnerable to supply disruptions.
6. ESG & Climate Transition
Arm Holdings plc American Depositary Shares
- Increasing pressure to enhance ESG disclosures and reduce carbon footprint in semiconductor operations.
MaxLinear, Inc.
- ESG efforts less transparent, facing growing investor scrutiny on sustainability practices.
7. Geopolitical Exposure
Arm Holdings plc American Depositary Shares
- Significant exposure to UK, China, and Taiwan geopolitical tensions affecting supply and licensing.
MaxLinear, Inc.
- Primarily US-focused but impacted by global trade tensions in telecom markets.
Which company shows a better risk-adjusted profile?
Arm’s most impactful risk is its sky-high valuation combined with elevated beta, exposing investors to market shocks. MaxLinear suffers from severe profitability erosion and leverage strain, risking financial distress. Despite volatility, Arm’s stronger balance sheet and safe Altman Z-score position it better risk-adjusted. MaxLinear’s grey-zone Z-score and weak Piotroski score signal fragile financial health.
Final Verdict: Which stock to choose?
Arm Holdings excels as a powerhouse of innovation with unmatched operational efficiency and strong cash flow generation. Its high current ratio signals ample liquidity, but the sky-high valuation multiples warrant caution. Arm fits well in aggressive growth portfolios seeking exposure to cutting-edge semiconductor technology.
MaxLinear’s strategic moat lies in its niche market specialization and recurring revenue streams, offering a defensive edge. Despite recent profitability challenges, its more reasonable valuation and moderate leverage provide a safety cushion. MaxLinear suits investors focused on GARP—growth at a reasonable price—with a tolerance for turnaround risk.
If you prioritize innovation leadership and can stomach valuation premiums, Arm outshines with its robust income growth and liquidity. However, if you seek relative stability with potential value upside amid operational headwinds, MaxLinear offers better downside protection and a more attractive entry point. Both present distinct analytical scenarios depending on your risk appetite and investment horizon.
Disclaimer: Investment carries a risk of loss of initial capital. The past performance is not a reliable indicator of future results. Be sure to understand risks before making an investment decision.
Go Further
I encourage you to read the complete analyses of Arm Holdings plc American Depositary Shares and MaxLinear, Inc. to enhance your investment decisions: