Home > Comparison > Technology > LRCX vs ARM
The strategic rivalry between Lam Research Corporation and Arm Holdings plc shapes the semiconductor industry’s innovation and growth dynamics. Lam Research, a capital-intensive leader in semiconductor processing equipment, contrasts sharply with Arm Holdings, a high-margin IP licensor specializing in CPU architecture. This head-to-head encapsulates a battle between manufacturing might and intellectual property leadership. This analysis will assess which company’s trajectory offers superior risk-adjusted returns for a diversified portfolio in 2026.
Table of contents
Companies Overview
Lam Research Corporation and Arm Holdings plc dominate critical segments of the semiconductor industry with distinct business models and innovation strategies.
Lam Research Corporation: Semiconductor Equipment Powerhouse
Lam Research Corporation designs and manufactures semiconductor processing equipment essential for integrated circuit fabrication. Its core revenue comes from advanced systems like ALTUS for tungsten metallization and SABRE for copper interconnects. In 2026, it emphasizes expanding high-precision deposition and etching technologies to enhance wafer yields globally, reinforcing its competitive advantage in equipment innovation.
Arm Holdings plc: Semiconductor IP Architect
Arm Holdings plc architects and licenses CPU products and related technologies to semiconductor companies worldwide. Its revenue engine relies on licensing microprocessors, graphics IP, and software to diverse markets including automotive and IoT. In 2026, Arm sharpens focus on expanding its IP portfolio and software tools, underpinning its strategic position as a global semiconductor IP leader.
Strategic Collision: Similarities & Divergences
Lam Research pursues a hardware-centric, capital-intensive model, while Arm focuses on licensing and intellectual property. Both compete indirectly in semiconductor innovation but target different value chain stages—equipment manufacturing versus chip design. This divergence creates distinct investment profiles: Lam offers exposure to semiconductor capital equipment cycles, whereas Arm taps into scalable IP royalties and software growth.
Income Statement Comparison
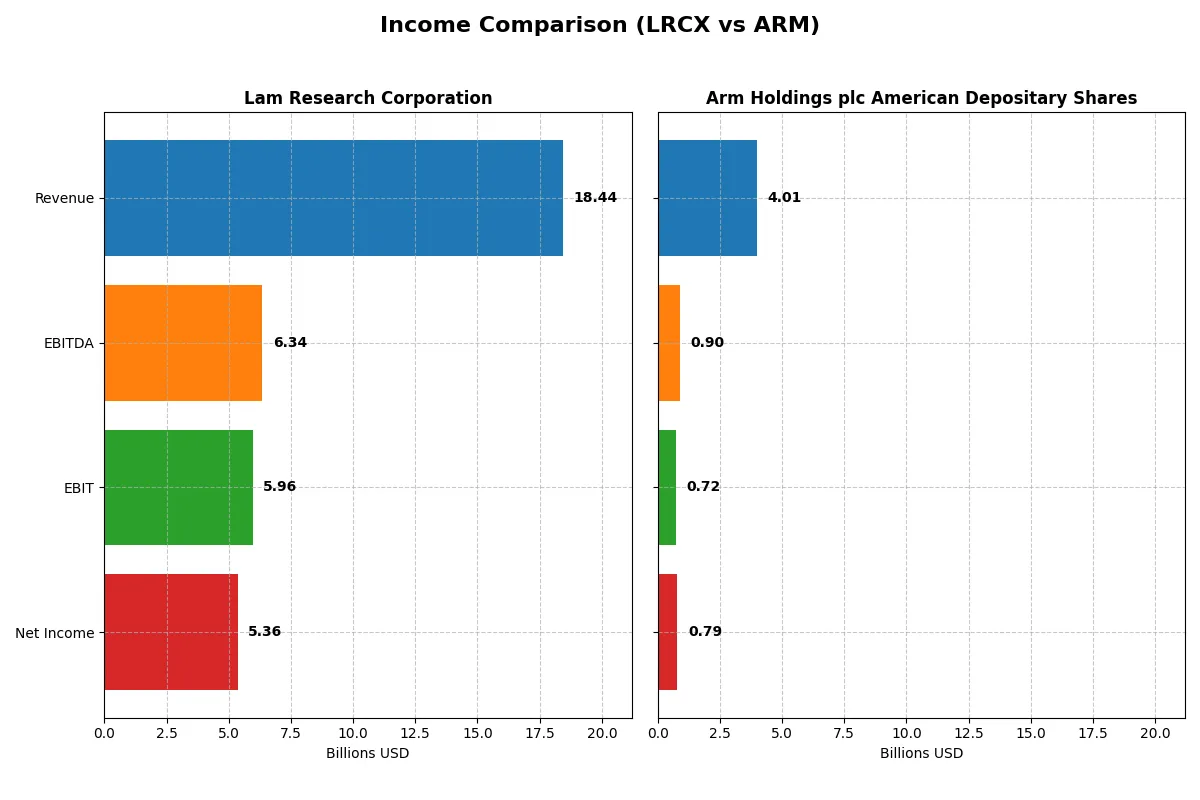
This data dissects the core profitability and scalability of both corporate engines to reveal who dominates the bottom line:
| Metric | Lam Research Corporation (LRCX) | Arm Holdings plc ADS (ARM) |
|---|---|---|
| Revenue | 18.4B | 4.01B |
| Cost of Revenue | 9.46B | 206M |
| Operating Expenses | 3.08B | 2.97B |
| Gross Profit | 8.98B | 3.8B |
| EBITDA | 6.34B | 903M |
| EBIT | 5.96B | 720M |
| Interest Expense | 178M | 0 |
| Net Income | 5.36B | 792M |
| EPS | 4.17 | 0.75 |
| Fiscal Year | 2025 | 2025 |
Income Statement Analysis: The Bottom-Line Duel
This income statement comparison exposes each company’s operational efficiency and profit-generation power through recent financial trends.
Lam Research Corporation Analysis
Lam Research shows a strong upward trajectory in revenue, growing from $14.6B in 2021 to $18.4B in 2025. Net income advanced from $3.9B to $5.4B over the same period. The gross margin remains robust at 48.7%, reflecting efficient cost control. In 2025, Lam’s net margin of 29.1% underlines solid profitability and operational momentum.
Arm Holdings plc American Depositary Shares Analysis
Arm Holdings nearly doubled revenue from $2.0B in 2021 to $4.0B in 2025. Net income tripled from $388M to $792M. Its exceptionally high gross margin of 94.9% highlights a strong moat in cost structure. Despite a lower net margin of 19.8%, Arm’s 2025 results show accelerating EBIT growth of 240%, signaling improving operational leverage.
Margin Strength vs. Growth Velocity
Lam Research delivers superior net margins and consistent earnings growth, showcasing disciplined capital allocation. Arm posts explosive revenue and EBIT growth, with unparalleled gross margins but lower net profitability. For investors, Lam offers stable, margin-rich returns, while Arm appeals with rapid expansion and scalability potential.
Financial Ratios Comparison
These vital ratios act as a diagnostic tool to expose the underlying fiscal health, valuation premiums, and capital efficiency of the companies compared below:
| Ratios | Lam Research Corporation (LRCX) | Arm Holdings plc ADS (ARM) |
|---|---|---|
| ROE | 54.3% | 11.6% |
| ROIC | 34.0% | 10.3% |
| P/E | 23.4 | 141.6 |
| P/B | 12.7 | 16.4 |
| Current Ratio | 2.21 | 5.20 |
| Quick Ratio | 1.55 | 5.20 |
| D/E | 0.48 | 0.05 |
| Debt-to-Assets | 22.3% | 4.0% |
| Interest Coverage | 33.1 | N/A |
| Asset Turnover | 0.86 | 0.45 |
| Fixed Asset Turnover | 7.59 | 5.61 |
| Payout ratio | 21.5% | 0% |
| Dividend yield | 0.92% | 0% |
| Fiscal Year | 2025 | 2025 |
Efficiency & Valuation Duel: The Vital Signs
Financial ratios act as a company’s DNA, uncovering hidden operational strengths and potential risks investors must weigh carefully.
Lam Research Corporation
Lam Research demonstrates strong profitability with a 54.33% ROE and healthy 29.06% net margin, indicating operational excellence. Its P/E of 23.36 suggests a fairly valued stock, neither stretched nor cheap. Despite a modest 0.92% dividend yield, Lam efficiently balances shareholder returns with substantial reinvestment in R&D, fueling growth.
Arm Holdings plc American Depositary Shares
Arm shows a lower ROE of 11.58% and a 19.77% net margin, reflecting moderate profitability but less efficiency than Lam. Its valuation appears stretched, with a P/E of 141.58 and elevated price-to-book of 16.4. Arm pays no dividend, instead heavily reinvesting in R&D, though its overall financial ratios lean toward a less favorable risk profile.
Balanced Profitability vs. Premium Valuation
Lam Research offers a superior blend of operational efficiency and reasonable valuation, minimizing risk while supporting growth. Arm’s premium multiples and weaker returns signal higher risk. Investors seeking stability and profitability will find Lam’s profile more aligned with prudent capital allocation.
Which one offers the Superior Shareholder Reward?
I compare Lam Research Corporation (LRCX) and Arm Holdings plc (ARM) on dividends, buybacks, and growth reinvestment. LRCX pays a 0.92% dividend yield with a sustainable 21% payout, supported by strong free cash flow (4.2B FCF/share), and runs consistent buybacks. ARM pays no dividends, focusing on R&D and acquisitions to fuel its high-margin growth, but free cash flow is modest (0.17B/share) and buyback activity is negligible. Historically, LRCX’s balanced distribution with dividends plus buybacks delivers steady shareholder returns. ARM’s reinvestment strategy offers growth potential but with elevated valuation risk (PE ~142). For 2026, I favor LRCX for superior total return due to its sustainable cash returns and disciplined capital allocation.
Comparative Score Analysis: The Strategic Profile
The radar chart reveals the fundamental DNA and trade-offs of Lam Research Corporation and Arm Holdings plc American Depositary Shares:
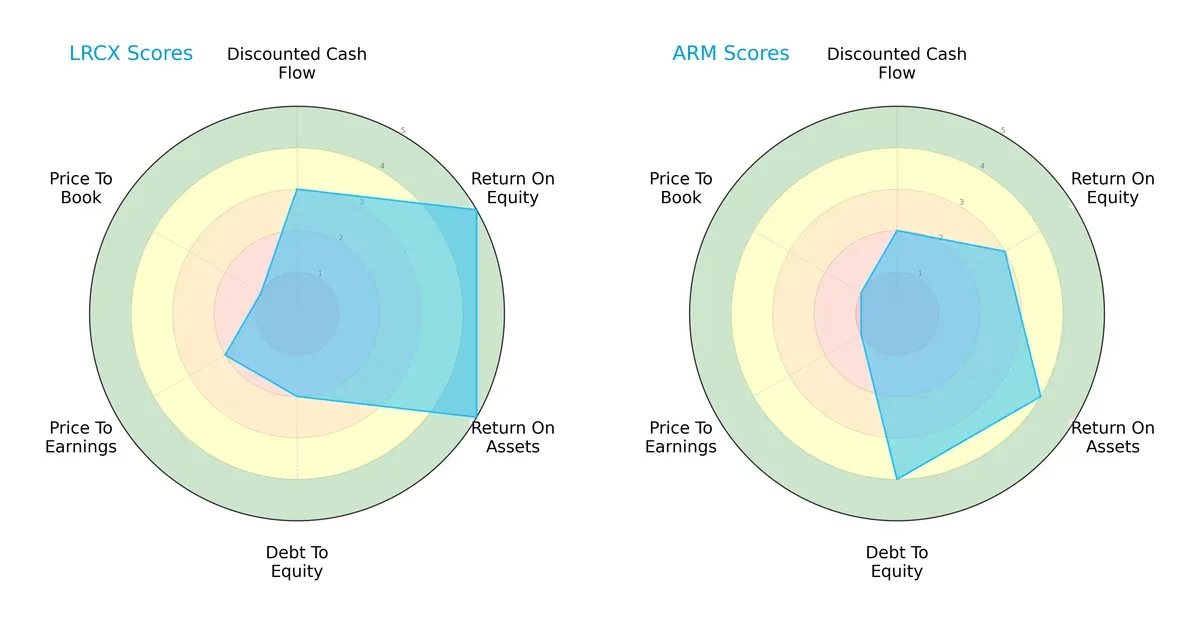
Lam Research demonstrates superior profitability with very favorable ROE and ROA scores (5 each), while Arm shows moderate to favorable returns (ROE 3, ROA 4). Arm holds a stronger balance sheet with a debt-to-equity score of 4 versus Lam’s weaker 2. Both firms share moderate DCF scores, but Lam’s valuation metrics lag, especially in price-to-book (score 1), indicating potential overvaluation risks. Overall, Lam relies on operational efficiency, whereas Arm offers a more balanced financial risk profile.
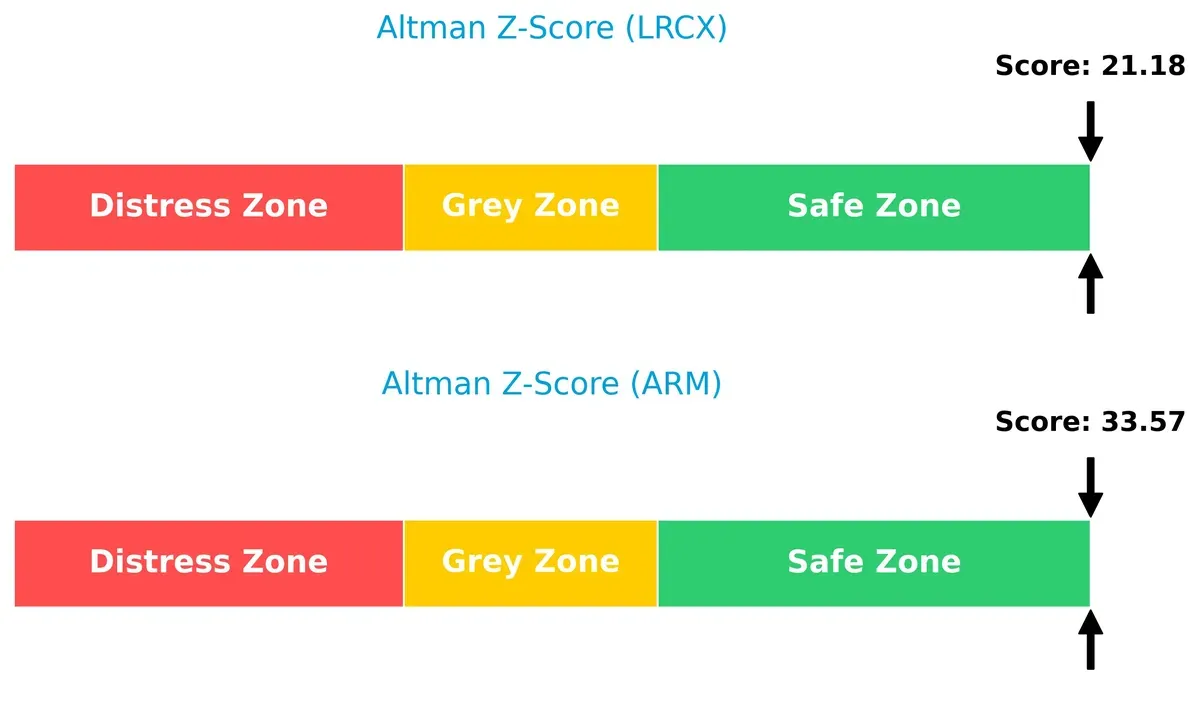
Bankruptcy Risk: Solvency Showdown
Lam Research’s Altman Z-Score of 21.18 versus Arm’s 33.57 confirms both companies operate well within the safe zone, signaling robust long-term solvency and low bankruptcy risk in this cycle:
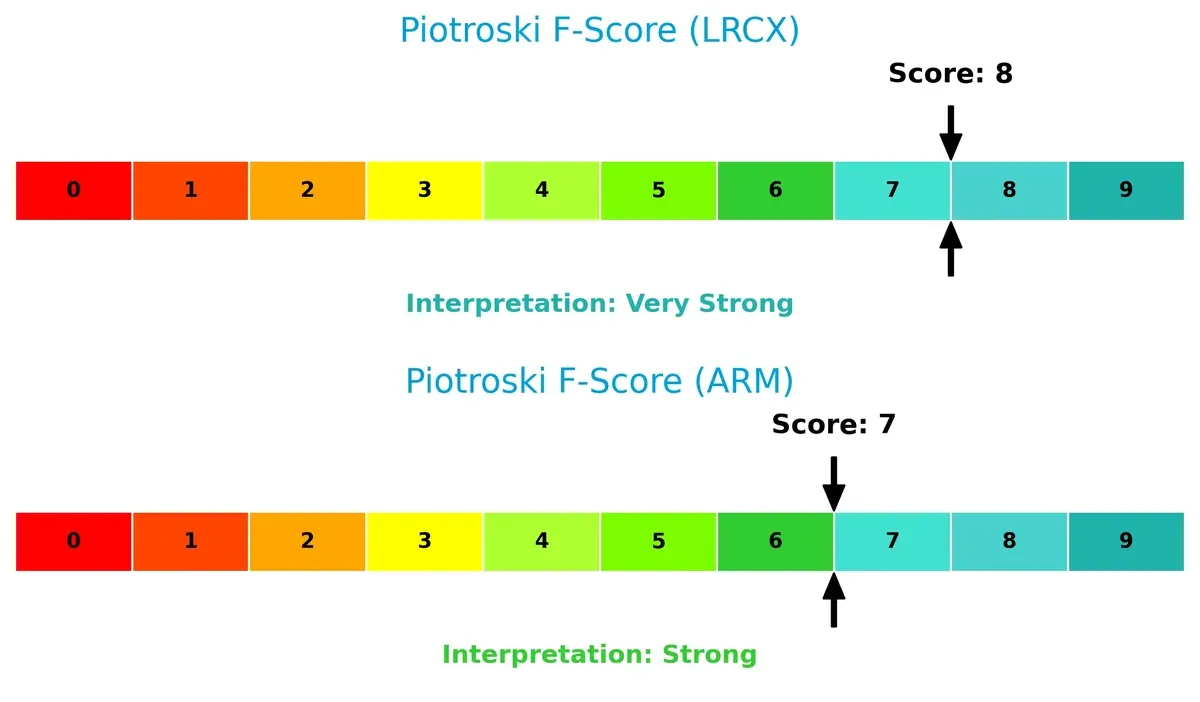
Financial Health: Quality of Operations
Lam Research’s Piotroski F-Score of 8 outperforms Arm’s 7, indicating superior internal financial health and operational quality. Lam’s higher score suggests fewer red flags and stronger fundamentals compared to Arm:
How are the two companies positioned?
This section dissects the operational DNA of Lam Research and Arm by comparing their revenue distribution and internal dynamics. The goal is to confront their economic moats to identify which model offers the most resilient competitive advantage today.
Revenue Segmentation: The Strategic Mix
This visual comparison dissects how Lam Research and Arm Holdings diversify income streams and highlights their primary sector bets:
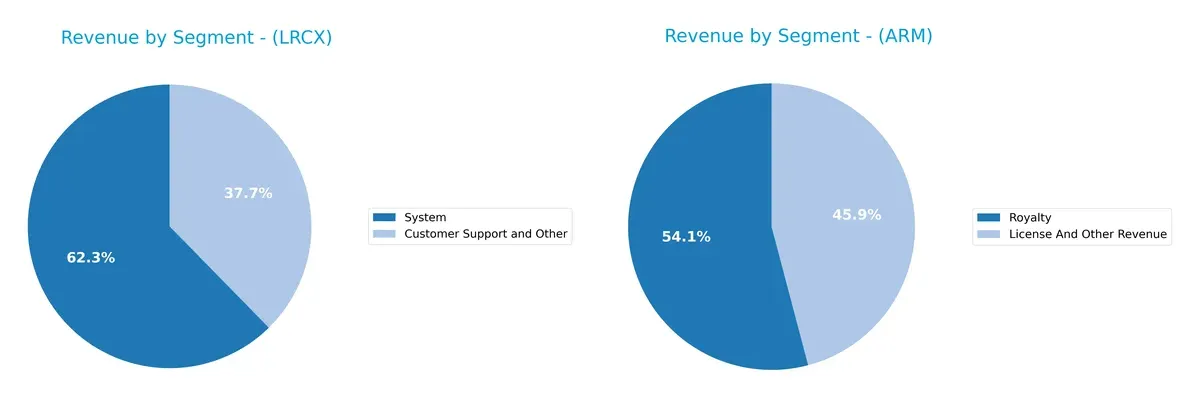
Lam Research anchors revenue in its System segment with $11.5B in 2025, complemented by $6.9B from Customer Support. Arm Holdings shows a more balanced split: $2.2B in Royalties and $1.8B from Licensing. Lam’s reliance on Systems signals infrastructure dominance but higher concentration risk. Arm’s mix reflects ecosystem lock-in, earning steady royalties and licenses, which supports predictable, recurring cash flow.
Strengths and Weaknesses Comparison
This table compares the strengths and weaknesses of Lam Research Corporation and Arm Holdings plc American Depositary Shares:
Lam Research Corporation Strengths
- Strong net margin at 29.06%
- High ROE of 54.33%
- Favorable ROIC at 34% exceeding WACC
- Solid current and quick ratios above 1.5
- Moderate debt levels with good interest coverage
- Diversified global revenue across Asia and US
Arm Holdings plc Strengths
- Favorable net margin at 19.77%
- Very low debt-to-assets ratio at 3.99%
- Infinite interest coverage ratio
- Favorable quick ratio of 5.2
- Significant US revenue base at $1.7B
- Steady royalty and licensing revenue streams
Lam Research Corporation Weaknesses
- WACC higher than ROE at 12.05%
- High price-to-book ratio at 12.69
- Dividend yield under 1%
- Neutral asset turnover at 0.86
- Exposure concentrated in Asia, especially China and Korea
Arm Holdings plc Weaknesses
- Unfavorable WACC at 24.32% exceeding ROIC
- Very high P/E ratio at 141.58
- Unfavorable current ratio at 5.2
- Lower ROIC at 10.28%
- Asset turnover weak at 0.45
- Zero dividend yield
Lam Research shows strong profitability and balance sheet metrics, but faces valuation and WACC concerns. Arm displays financial conservatism and stable revenue streams, offset by high valuation and weaker capital efficiency. Both companies’ strategies reflect trade-offs between growth, risk, and capital structure.
The Moat Duel: Analyzing Competitive Defensibility
A structural moat shields long-term profits by fending off competition’s relentless erosion. Let’s dissect how two semiconductor leaders defend their turf:
Lam Research Corporation: Manufacturing Precision with Cost Advantage
Lam Research leverages a cost advantage in advanced semiconductor equipment. Its high ROIC above WACC at 22% confirms efficient capital use and strong value creation. Expanding wafer cleaning and etch tech in 2026 could deepen this moat.
Arm Holdings plc American Depositary Shares: Intellectual Property Licensing Power
Arm’s moat centers on intangible assets—its CPU architecture licenses dominate mobile and IoT sectors. Unlike Lam, Arm’s ROIC lags below WACC, signaling value erosion despite soaring revenue growth. New markets in automotive AI pose expansion opportunities but also risk margin pressure.
Capital Efficiency vs. IP Dominance: Which Moat Holds Stronger?
Lam’s durable cost advantage yields superior capital returns and margin stability, outpacing Arm’s unstable value creation. I see Lam better equipped to defend market share amid semiconductor cycle volatility, while Arm faces challenges turning growth into profit.
Which stock offers better returns?
Over the past year, Lam Research Corporation’s stock surged significantly, displaying strong upward momentum. Arm Holdings plc’s price declined steadily, reflecting persistent selling pressure and a bearish dynamic.
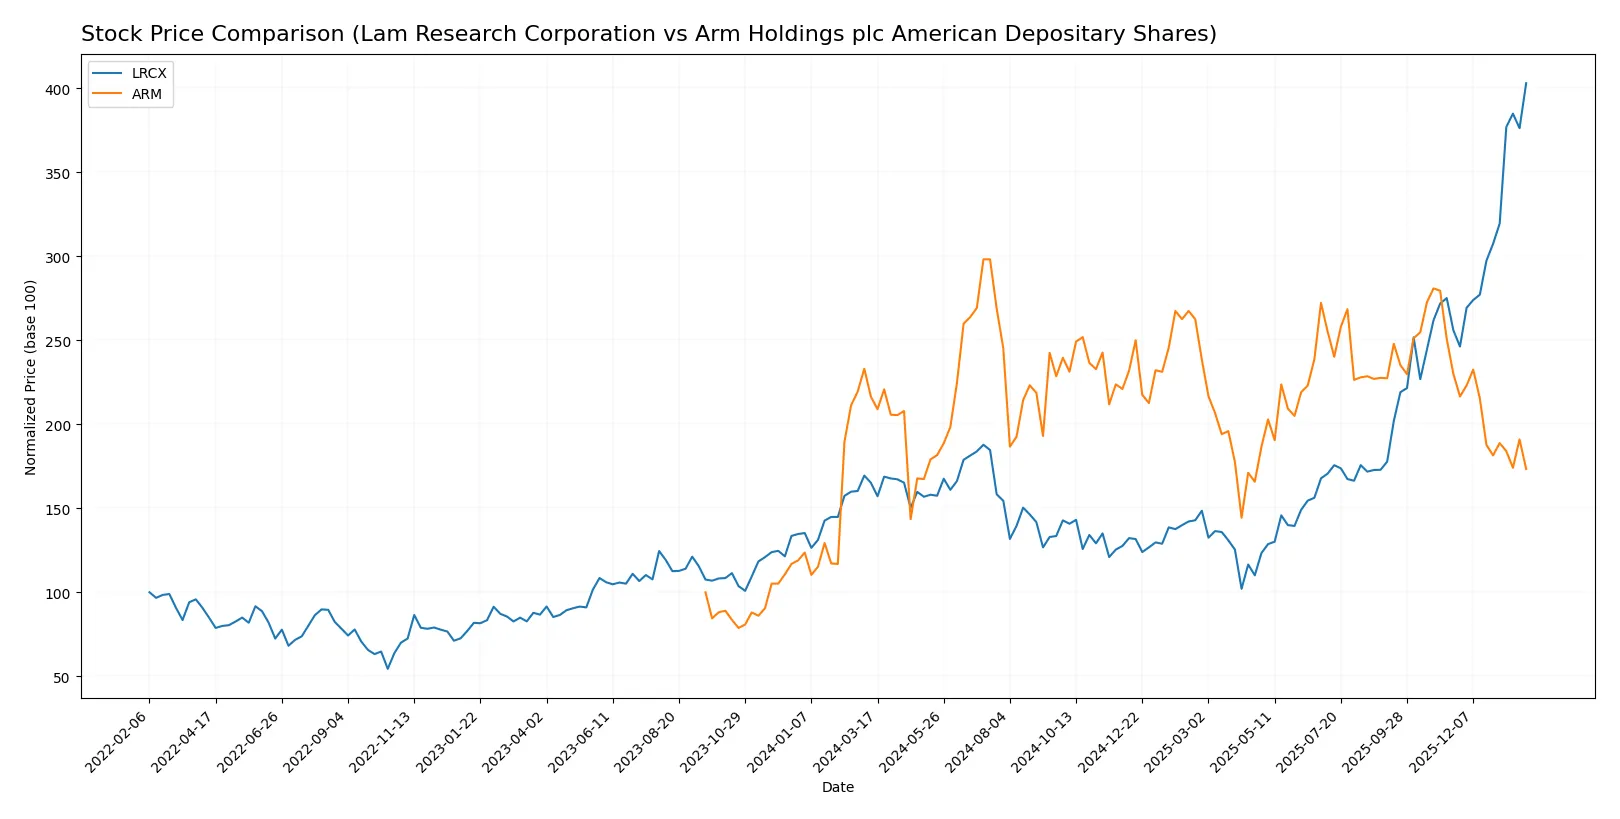
Trend Comparison
Lam Research’s stock rose 144.03% over the past 12 months, marking a bullish trend with accelerating gains and a high volatility of 36.82%. The price peaked at 233.46 and bottomed at 59.09.
Arm Holdings’ stock fell 19.87% over the same period, signaling a bearish trend with decelerating losses and lower volatility at 19.62%. Its highest price was 181.19, and the lowest was 87.19.
Lam Research outperformed Arm Holdings, delivering the highest market return with clear acceleration, while Arm’s trend remained negative with deceleration.
Target Prices
Analysts present a wide but constructive target price consensus for Lam Research and Arm Holdings.
| Company | Target Low | Target High | Consensus |
|---|---|---|---|
| Lam Research Corporation | 127 | 325 | 266.76 |
| Arm Holdings plc American Depositary Shares | 120 | 170 | 145 |
Lam Research’s consensus target stands about 14% above its current 233.46 price, signaling upside potential in a cyclical semiconductor environment. Arm Holdings shows a more conservative 38% upside from 105.36, reflecting growth expectations but higher volatility risks.

Don’t Let Luck Decide Your Entry Point
Optimize your entry points with our advanced ProRealTime indicators. You’ll get efficient buy signals with precise price targets for maximum performance. Start outperforming now!
How do institutions grade them?
The following tables summarize recent institutional grades for Lam Research Corporation and Arm Holdings plc American Depositary Shares:
Lam Research Corporation Grades
This table shows the latest grades from major financial institutions for Lam Research Corporation.
| Grading Company | Action | New Grade | Date |
|---|---|---|---|
| Susquehanna | Maintain | Positive | 2026-01-29 |
| Citigroup | Maintain | Buy | 2026-01-29 |
| RBC Capital | Maintain | Outperform | 2026-01-29 |
| Needham | Maintain | Buy | 2026-01-29 |
| UBS | Maintain | Buy | 2026-01-29 |
| Cantor Fitzgerald | Maintain | Overweight | 2026-01-29 |
| Goldman Sachs | Maintain | Buy | 2026-01-29 |
| Morgan Stanley | Maintain | Equal Weight | 2026-01-29 |
| Wells Fargo | Maintain | Overweight | 2026-01-29 |
| Stifel | Maintain | Buy | 2026-01-29 |
Arm Holdings plc American Depositary Shares Grades
This table presents recent institutional grades for Arm Holdings plc American Depositary Shares.
| Grading Company | Action | New Grade | Date |
|---|---|---|---|
| UBS | Maintain | Buy | 2026-01-26 |
| Wells Fargo | Maintain | Overweight | 2026-01-26 |
| Morgan Stanley | Maintain | Overweight | 2026-01-23 |
| Susquehanna | Upgrade | Positive | 2026-01-21 |
| B of A Securities | Downgrade | Neutral | 2026-01-13 |
| B of A Securities | Maintain | Buy | 2025-12-16 |
| Goldman Sachs | Downgrade | Sell | 2025-12-15 |
| Loop Capital | Maintain | Buy | 2025-11-12 |
| Benchmark | Maintain | Hold | 2025-11-06 |
| Needham | Maintain | Hold | 2025-11-06 |
Which company has the best grades?
Lam Research consistently receives more favorable ratings, including several Buy and Outperform grades. Arm shows mixed signals with downgrades and a recent Sell grade, indicating greater uncertainty for investors.
Risks specific to each company
The following categories identify the critical pressure points and systemic threats facing both firms in the 2026 market environment:
1. Market & Competition
Lam Research Corporation
- Faces fierce competition in semiconductor equipment manufacturing with pressure on innovation cycles.
Arm Holdings plc American Depositary Shares
- Operates in highly competitive semiconductor IP licensing with risks from rapid technological shifts.
2. Capital Structure & Debt
Lam Research Corporation
- Maintains moderate leverage with a debt-to-equity ratio of 0.48, supporting financial flexibility.
Arm Holdings plc American Depositary Shares
- Extremely low leverage at 0.05 debt-to-equity ratio, indicating conservative capital structure.
3. Stock Volatility
Lam Research Corporation
- Exhibits beta of 1.779 reflecting moderate volatility typical for tech sector.
Arm Holdings plc American Depositary Shares
- Shows very high beta of 4.363, indicating extreme stock price swings and investor risk.
4. Regulatory & Legal
Lam Research Corporation
- Exposed to export controls and IP regulations in U.S. and China semiconductor markets.
Arm Holdings plc American Depositary Shares
- Faces scrutiny over international licensing agreements and geopolitical tech restrictions.
5. Supply Chain & Operations
Lam Research Corporation
- Complex global supply chain vulnerable to disruptions in Asia and material shortages.
Arm Holdings plc American Depositary Shares
- Relies heavily on partners’ manufacturing, exposing it to operational risks outside direct control.
6. ESG & Climate Transition
Lam Research Corporation
- Increasing regulatory pressure to reduce emissions and improve sustainable manufacturing practices.
Arm Holdings plc American Depositary Shares
- ESG risks from reliance on energy-intensive data centers and global IP licensing footprint.
7. Geopolitical Exposure
Lam Research Corporation
- Significant exposure to U.S.-China tensions affecting sales and supply chain logistics.
Arm Holdings plc American Depositary Shares
- High geopolitical risk due to UK/US base and extensive China market dependency.
Which company shows a better risk-adjusted profile?
Lam Research’s most impactful risk is geopolitical exposure, which could disrupt supply chains and sales. Arm’s greatest risk lies in its extreme stock volatility, reflecting uncertain investor sentiment and speculative trading. I see Lam Research as having a better risk-adjusted profile, supported by stronger balance sheet metrics and more stable operational control. Arm’s sky-high beta and elevated valuation multiples highlight its vulnerability to market shocks, warranting cautious allocation despite growth potential.
Final Verdict: Which stock to choose?
Lam Research’s superpower lies in its robust value creation, demonstrated by a very favorable moat with ROIC well above WACC. It operates as a cash-generating machine with accelerating revenue and profit growth. A point of vigilance is its premium valuation metrics, which may pressure returns if growth slows. It fits best in aggressive growth portfolios seeking durable competitive advantages.
Arm Holdings benefits from a strong strategic moat rooted in its intellectual property and recurring licensing revenues, offering steady income streams. While its profitability metrics and ROIC trail Lam Research, it carries a safer balance sheet with minimal debt. This profile suits GARP investors who favor growth tempered by financial stability.
If you prioritize robust capital efficiency and accelerating earnings growth, Lam Research outshines with its clear value creation and market momentum. However, if you seek more stability and recurring revenue safety within growth, Arm Holdings offers better downside protection despite its elevated valuation. Both present distinct analytical scenarios depending on your risk tolerance and investment horizon.
Disclaimer: Investment carries a risk of loss of initial capital. The past performance is not a reliable indicator of future results. Be sure to understand risks before making an investment decision.
Go Further
I encourage you to read the complete analyses of Lam Research Corporation and Arm Holdings plc American Depositary Shares to enhance your investment decisions: