Home > Comparison > Technology > KLAC vs ARM
The strategic rivalry between KLA Corporation and Arm Holdings plc shapes the semiconductor industry’s future. KLA operates as a capital-intensive process control and yield management leader, while Arm focuses on licensing cutting-edge CPU designs and system IPs. This clash highlights the contrast between manufacturing-driven precision and intellectual property innovation. This analysis will clarify which company’s strategic pathway offers a superior risk-adjusted return for a diversified technology portfolio.
Table of contents
Companies Overview
KLA Corporation and Arm Holdings shape key segments in the semiconductor industry with distinct technological roles and global footprints.
KLA Corporation: Precision Process Control Leader
KLA Corporation dominates semiconductor process control. It generates revenue by selling yield management and inspection solutions for IC manufacturers. In 2026, KLA focuses strategically on expanding wafer defect inspection and metrology technologies to enhance production precision and customer yield.
Arm Holdings plc American Depositary Shares: Chip Design Innovator
Arm Holdings leads in semiconductor IP licensing. Its core revenue comes from licensing CPU designs and related technologies to chipmakers worldwide. In 2026, Arm emphasizes broadening its architecture adoption across automotive and IoT sectors, strengthening its role as an essential chip design partner.
Strategic Collision: Similarities & Divergences
KLA and Arm occupy adjacent but distinct semiconductor niches: KLA offers hardware process control solutions while Arm provides chip architecture IP. Both compete indirectly for influence over semiconductor production, with KLA targeting manufacturers and Arm focusing on design clients. Their investment profiles differ sharply—KLA as a high-precision equipment provider and Arm as an intellectual property powerhouse.
Income Statement Comparison
This data dissects the core profitability and scalability of both corporate engines to reveal who dominates the bottom line:
| Metric | KLA Corporation (KLAC) | Arm Holdings plc ADS (ARM) |
|---|---|---|
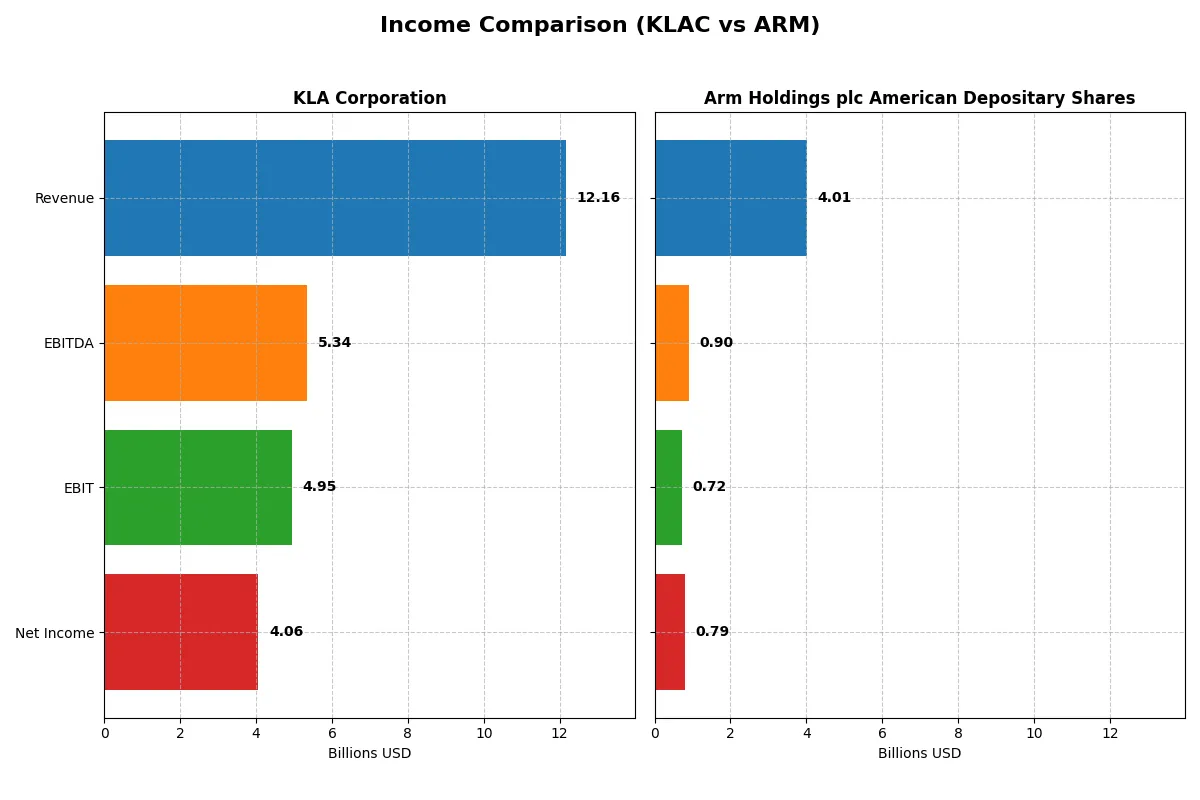
| Revenue | 12.2B | 4.0B |
| Cost of Revenue | 4.6B | 206M |
| Operating Expenses | 2.3B | 2.97B |
| Gross Profit | 7.6B | 3.8B |
| EBITDA | 5.3B | 903M |
| EBIT | 4.9B | 720M |
| Interest Expense | 302M | 0 |
| Net Income | 4.1B | 792M |
| EPS | 30.53 | 0.75 |
| Fiscal Year | 2025 | 2025 |
Income Statement Analysis: The Bottom-Line Duel
This income statement comparison reveals which company’s business model delivers superior efficiency and profitability in a competitive market.
KLA Corporation Analysis
KLA’s revenue grew 24% year-over-year to 12.2B in 2025, with net income surging nearly 47% to 4.1B. Gross and net margins remain robust at 62% and 33% respectively, reflecting disciplined cost management. The strong EBIT margin of 41% underscores outstanding operating efficiency and momentum in expanding profitability.
Arm Holdings plc American Depositary Shares Analysis
Arm’s revenue rose 24% to 4.0B in 2025, with net income more than doubling to 792M. The company boasts an exceptional gross margin near 95%, though net margin lags at 20%, indicating higher operating costs. EBIT margin improved sharply to 18%, signaling rapid operational leverage and margin expansion despite lower absolute scale.
Margin Dominance vs. Growth Momentum
KLA leads with superior absolute profits and margin breadth, delivering consistent double-digit net margin and EBIT growth. Arm impresses with explosive earnings growth and industry-leading gross margin, but its lower net margin reflects ongoing investment and cost absorption. KLA’s profile suits investors prioritizing stable, high-efficiency earnings; Arm appeals to those favoring high-growth potential with improving profitability.
Financial Ratios Comparison
These vital ratios act as a diagnostic tool to expose the underlying fiscal health, valuation premiums, and capital efficiency of the companies analyzed below:
| Ratios | KLA Corporation (KLAC) | Arm Holdings plc ADS (ARM) |
|---|---|---|
| ROE | 86.6% | 11.6% |
| ROIC | 38.0% | 10.3% |
| P/E | 29.3 | 141.6 |
| P/B | 25.4 | 16.4 |
| Current Ratio | 2.62 | 5.20 |
| Quick Ratio | 1.83 | 5.20 |
| D/E (Debt to Equity) | 1.30 | 0.05 |
| Debt-to-Assets | 37.9% | 4.0% |
| Interest Coverage | 17.3 | 0 |
| Asset Turnover | 0.76 | 0.45 |
| Fixed Asset Turnover | 9.70 | 5.61 |
| Payout ratio | 22.3% | 0% |
| Dividend yield | 0.76% | 0% |
| Fiscal Year | 2025 | 2025 |
Efficiency & Valuation Duel: The Vital Signs
Ratios serve as a company’s financial DNA, exposing hidden risks and operational strengths that shape investor confidence and valuation.
KLA Corporation
KLA shows robust profitability with an 86.6% ROE and a strong 33.4% net margin, signaling exceptional operational efficiency. However, its P/E ratio of 29.3 and P/B of 25.4 suggest a stretched valuation. The company returns value through a modest 0.76% dividend yield, balancing shareholder payouts with ongoing R&D investments.
Arm Holdings plc American Depositary Shares
Arm displays moderate profitability with an 11.6% ROE and a 19.8% net margin, reflecting steady but less efficient operations. Its valuation is highly stretched, with a P/E at 141.6 and P/B at 16.4. The firm pays no dividend, instead prioritizing heavy reinvestment in R&D, which accounts for over 50% of revenue, fueling growth potential.
Premium Valuation vs. Operational Safety
KLA offers superior profitability and operational efficiency but trades at a high valuation with moderate shareholder returns. Arm’s valuation is far more stretched, justified by its growth focus but marked by weaker returns. Risk-tolerant investors seeking growth may prefer Arm, while those valuing stable profitability may favor KLA.
Which one offers the Superior Shareholder Reward?
I find KLA Corporation’s shareholder reward more compelling than Arm Holdings’ in 2026. KLA pays a modest but sustainable dividend yield near 0.76% with a conservative 22% payout ratio, well-covered by strong free cash flow (28B FCF). Its robust buyback program amplifies total returns, reflecting prudent capital allocation. Arm, in contrast, pays no dividend and reinvests heavily in growth, but its buybacks are minimal and free cash flow coverage weakens sustainability. Historically in tech, steady dividends plus buybacks outperform pure growth bets. For income and total return, KLA leads the pack.
Comparative Score Analysis: The Strategic Profile
The radar chart reveals the fundamental DNA and trade-offs of both firms, highlighting their financial strengths and vulnerabilities across key metrics:
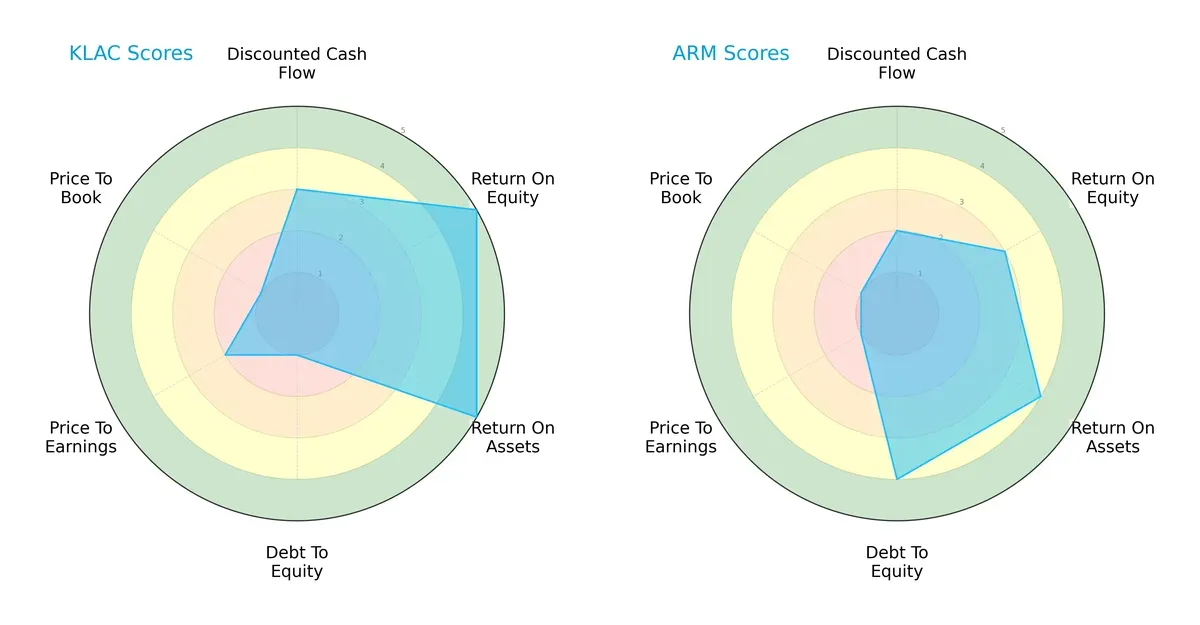
KLA Corporation excels in profitability with top-tier ROE and ROA scores of 5, but struggles with a very unfavorable debt-to-equity position at 1. Arm Holdings shows more financial stability with a favorable debt-to-equity score of 4 and solid asset utilization. However, Arm’s valuation metrics lag, both scoring very unfavorable at 1. Overall, KLA presents a profit-focused but leveraged profile, while Arm offers a more balanced financial risk stance with moderate profitability.
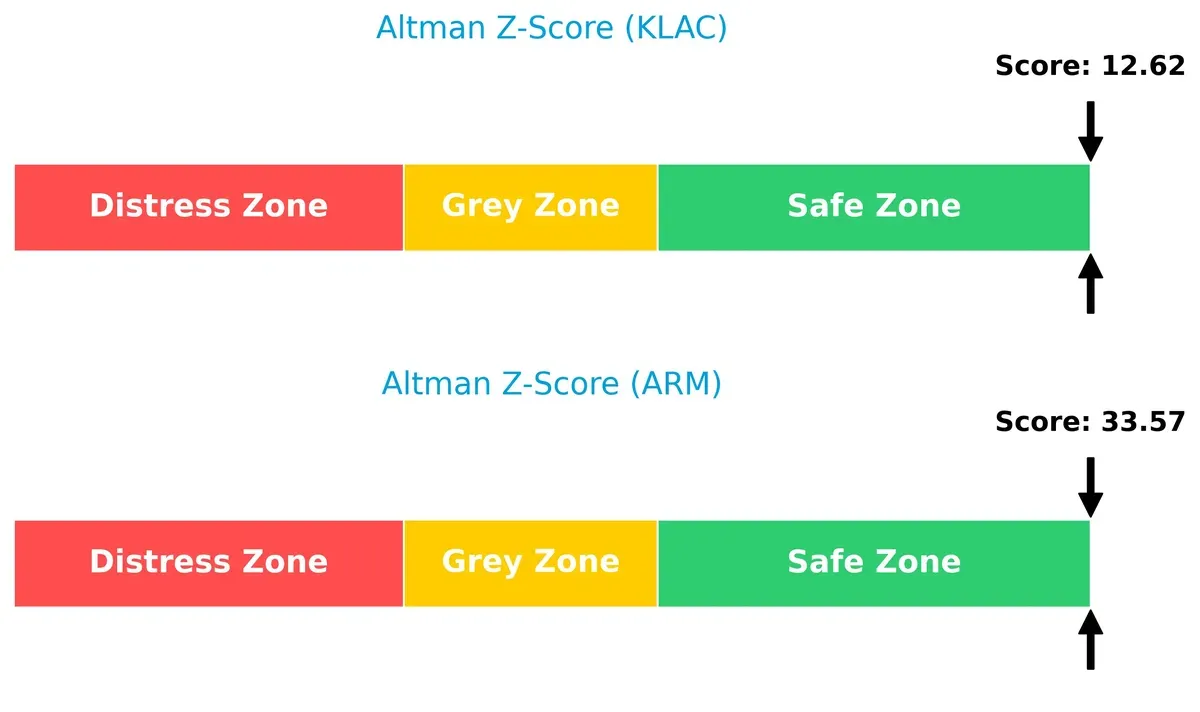
Bankruptcy Risk: Solvency Showdown
The Altman Z-Score delta strongly favors Arm, with 33.6 versus KLA’s 12.6; both remain safely above distress thresholds, but Arm’s score signals superior long-term solvency in this market cycle:
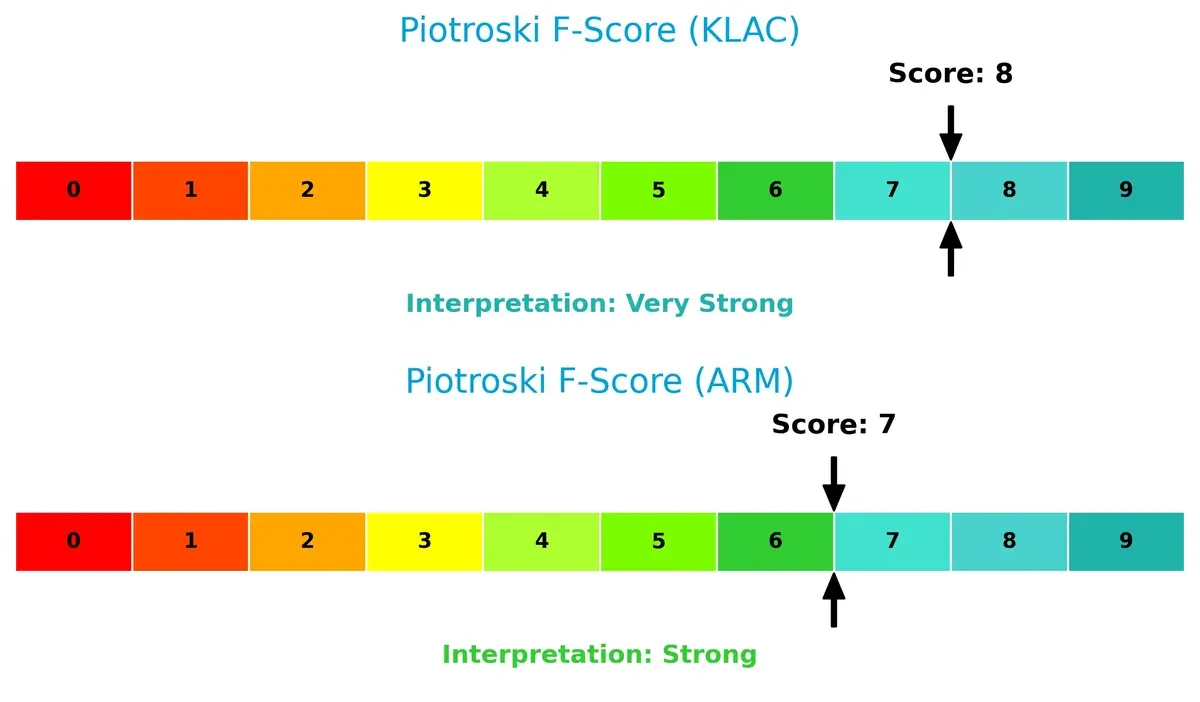
Financial Health: Quality of Operations
KLA’s Piotroski F-Score of 8 indicates very strong financial health, slightly outperforming Arm’s strong 7, suggesting KLA maintains a marginally better quality of operations and fewer internal red flags:
How are the two companies positioned?
This section dissects KLAC and ARM’s operational DNA by comparing revenue distribution and internal dynamics. The goal is to confront their economic moats to reveal which model delivers the most resilient advantage today.
Revenue Segmentation: The Strategic Mix
This visual comparison dissects how KLA Corporation and Arm Holdings diversify their income streams and where their primary sector bets lie:
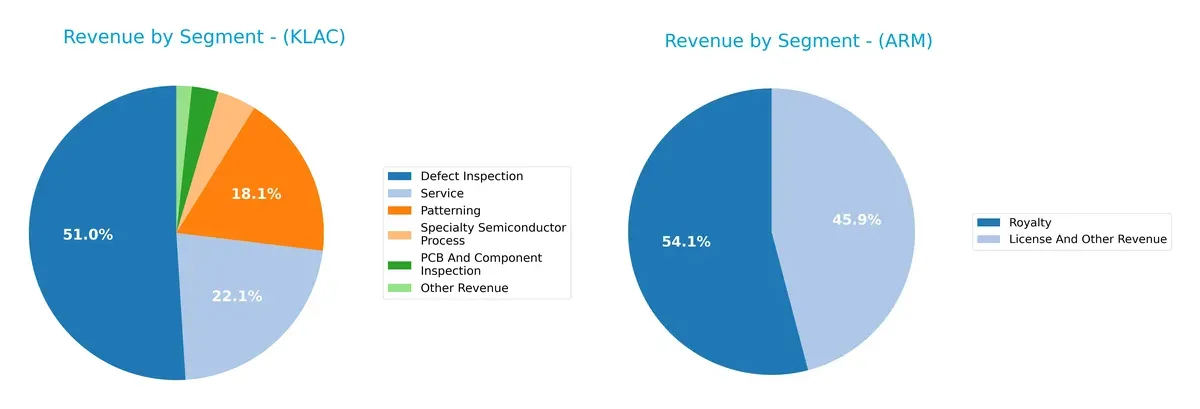
KLA leans heavily on Defect Inspection, anchoring $6.2B in 2025, dwarfing other segments like Patterning ($2.2B) and Service ($2.7B). This concentration reflects a strategic lock-in in semiconductor process control. In contrast, Arm balances License and Other Revenue ($1.8B) with a slightly larger Royalty stream ($2.2B), showing a more balanced but still focused model on IP monetization. KLA faces concentration risk; Arm pivots on ecosystem licensing.
Strengths and Weaknesses Comparison
This table compares the Strengths and Weaknesses of KLA Corporation and Arm Holdings plc American Depositary Shares:
KLA Corporation Strengths
- High net margin at 33.41%
- Strong ROE of 86.56%
- ROIC well above WACC at 37.97%
- Solid current and quick ratios indicating liquidity
- Wide product diversification across semiconductor segments
- Significant revenue from China, Taiwan, and Korea
Arm Holdings plc Strengths
- Favorable net margin at 19.77%
- Low debt-to-equity ratio at 0.05
- High interest coverage with infinite value
- Strong quick ratio at 5.2
- Wide geographic presence including US and China
- Revenue balanced between licensing and royalty streams
KLA Corporation Weaknesses
- Unfavorable high WACC at 10.42%
- Elevated PE and PB ratios indicating expensive valuation
- Debt-to-equity ratio of 1.3 signals leverage risk
- Dividend yield low at 0.76%
- Moderate asset turnover at 0.76
- Some revenue dependency on volatile Asian markets
Arm Holdings plc Weaknesses
- High WACC at 24.32% signals costly capital
- Very high PE ratio of 141.58 suggests overvaluation
- Unfavorable current ratio at 5.2 may indicate asset inefficiency
- ROIC below WACC at 10.28% shows weak capital returns
- Lower asset turnover at 0.45
- Zero dividend yield may deter income investors
Both companies demonstrate strong profitability and international reach but face valuation and capital efficiency challenges. KLA’s leverage and valuation multiples require monitoring, while Arm’s capital cost and asset utilization need strategic focus.
The Moat Duel: Analyzing Competitive Defensibility
A structural moat is the only reliable shield protecting long-term profits from relentless competitive erosion in dynamic markets:
KLA Corporation: Precision Process Control Moat
KLA dominates with high switching costs from its specialized semiconductor process control solutions. Its 27.5% ROIC premium over WACC confirms strong value creation. Expansion into advanced packaging inspection deepens this moat in 2026.
Arm Holdings plc: IP Licensing Ecosystem Moat
Arm’s moat hinges on intellectual property licensing, contrasting KLA’s hardware focus. Despite high gross margins (95%), Arm sheds value with ROIC below WACC. Its ecosystem growth could unlock opportunities but also faces margin pressure.
Value Creation vs. Value Destruction in Semiconductor Moats
KLA’s wide and growing moat outperforms Arm’s unstable value creation. KLA’s proven capital efficiency equips it better to defend market share amid intensifying competition in 2026. Arm needs to improve ROIC to sustain its IP licensing edge.
Which stock offers better returns?
KLA Corporation’s stock surged over the past year, showing strong price appreciation and accelerating momentum, while Arm Holdings plc ADS declined with a decelerating bearish trend.
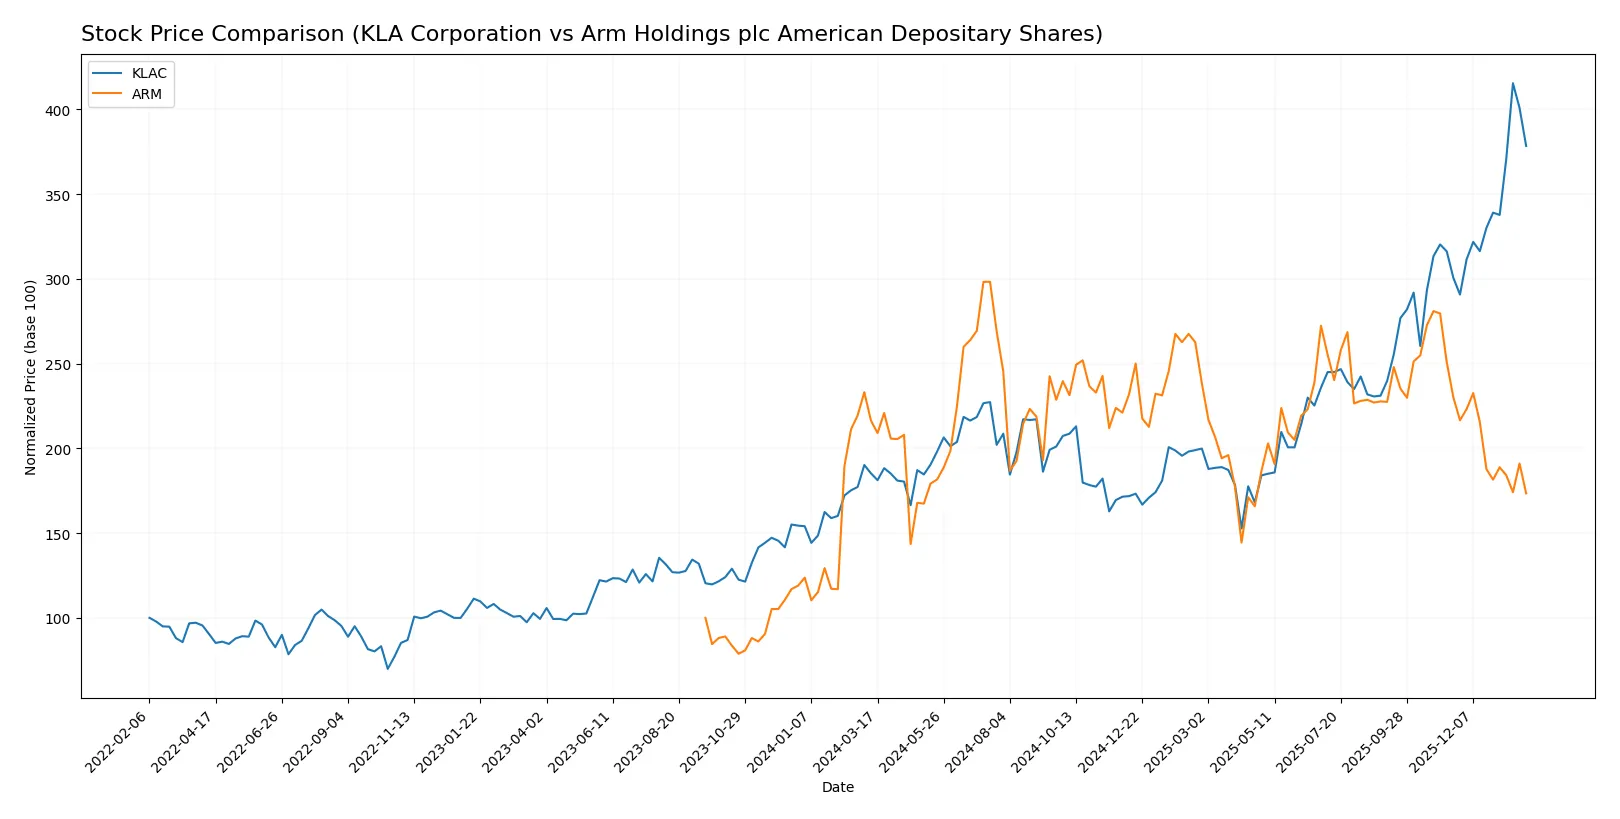
Trend Comparison
KLA’s stock price rose 104.22% over the last 12 months, indicating a robust bullish trend with acceleration and a high volatility level (std dev 213.25). The price ranged from 576.53 to 1567.82.
Arm Holdings’ stock fell 19.87% in the same period, reflecting a bearish trend with deceleration and low volatility (std dev 19.62). The stock’s price fluctuated between 87.19 and 181.19.
KLA significantly outperformed Arm Holdings, delivering the highest market return with strong upward momentum, contrasting with Arm’s declining and decelerating stock trend.
Target Prices
Analysts project solid upside potential for both KLA Corporation and Arm Holdings plc.
| Company | Target Low | Target High | Consensus |
|---|---|---|---|
| KLA Corporation | 1400 | 1900 | 1672.25 |
| Arm Holdings plc American Depositary Shares | 120 | 170 | 145 |
KLA’s consensus target sits about 17% above its current price of 1427.94 USD, signaling moderate optimism. Arm’s 145 USD consensus target implies roughly 38% upside from its 105.36 USD trading level, reflecting strong growth expectations.

Don’t Let Luck Decide Your Entry Point
Optimize your entry points with our advanced ProRealTime indicators. You’ll get efficient buy signals with precise price targets for maximum performance. Start outperforming now!
How do institutions grade them?
KLA Corporation Grades
The following table summarizes recent institutional grades for KLA Corporation:
| Grading Company | Action | New Grade | Date |
|---|---|---|---|
| RBC Capital | maintain | Sector Perform | 2026-01-30 |
| Jefferies | maintain | Buy | 2026-01-30 |
| Oppenheimer | maintain | Outperform | 2026-01-30 |
| Needham | maintain | Buy | 2026-01-30 |
| Barclays | maintain | Overweight | 2026-01-30 |
| Stifel | maintain | Buy | 2026-01-30 |
| Cantor Fitzgerald | maintain | Overweight | 2026-01-30 |
| Wells Fargo | maintain | Overweight | 2026-01-30 |
| Deutsche Bank | maintain | Hold | 2026-01-21 |
| Needham | maintain | Buy | 2026-01-20 |
Arm Holdings plc American Depositary Shares Grades
The following table summarizes recent institutional grades for Arm Holdings plc American Depositary Shares:
| Grading Company | Action | New Grade | Date |
|---|---|---|---|
| UBS | maintain | Buy | 2026-01-26 |
| Wells Fargo | maintain | Overweight | 2026-01-26 |
| Morgan Stanley | maintain | Overweight | 2026-01-23 |
| Susquehanna | upgrade | Positive | 2026-01-21 |
| B of A Securities | downgrade | Neutral | 2026-01-13 |
| B of A Securities | maintain | Buy | 2025-12-16 |
| Goldman Sachs | downgrade | Sell | 2025-12-15 |
| Loop Capital | maintain | Buy | 2025-11-12 |
| Benchmark | maintain | Hold | 2025-11-06 |
| Needham | maintain | Hold | 2025-11-06 |
Which company has the best grades?
KLA Corporation consistently receives Buy, Overweight, and Outperform ratings, indicating strong institutional confidence. Arm Holdings shows more mixed grades including downgrades and a Sell rating, reflecting greater analyst caution. This variation may affect investor sentiment and perceived risk.
Risks specific to each company
The following categories identify the critical pressure points and systemic threats facing both firms in the 2026 market environment:
1. Market & Competition
KLA Corporation
- Strong semiconductor process control niche but faces intense competition and market cyclicality.
Arm Holdings plc American Depositary Shares
- Licensor in CPU architecture with high dependency on semiconductor industry demand and fierce IP competition.
2. Capital Structure & Debt
KLA Corporation
- Higher leverage with debt-to-equity at 1.3 and moderate debt-to-assets at 37.9%. Interest coverage solid at 16.4x.
Arm Holdings plc American Depositary Shares
- Very conservative balance sheet with debt-to-equity at 0.05 and almost negligible debt-to-assets at 4%. Interest coverage effectively infinite.
3. Stock Volatility
KLA Corporation
- Beta of 1.44 indicates above-average market volatility but less extreme risk.
Arm Holdings plc American Depositary Shares
- Elevated beta at 4.36 signals very high stock volatility and sensitivity to market swings.
4. Regulatory & Legal
KLA Corporation
- US-based with exposure to semiconductor export controls and IP regulations.
Arm Holdings plc American Depositary Shares
- UK-based with global licensing, faces complex cross-border IP and trade regulation risks, including US-China tensions.
5. Supply Chain & Operations
KLA Corporation
- Relies on advanced manufacturing equipment supply chains, sensitive to global chip supply fluctuations.
Arm Holdings plc American Depositary Shares
- Operates largely on IP licensing model; less direct supply chain risk but dependent on licensees’ manufacturing stability.
6. ESG & Climate Transition
KLA Corporation
- Exposed to environmental regulations impacting manufacturing processes and resource usage.
Arm Holdings plc American Depositary Shares
- ESG risks linked to governance and global operations, with pressure on reducing carbon footprint in data centers using its IP.
7. Geopolitical Exposure
KLA Corporation
- Significant US-China tech tensions affect business and export control risks.
Arm Holdings plc American Depositary Shares
- High geopolitical risk from UK-US-China relations, given global licensing and international operations.
Which company shows a better risk-adjusted profile?
KLA’s primary risk lies in its debt leverage and exposure to semiconductor cyclicality. Arm’s greatest risk is extreme stock volatility and regulatory complexity across multiple jurisdictions. Despite KLA’s higher leverage, its stable operating cash flows and moderate beta present a more balanced risk profile. Arm’s very high beta and regulatory exposure create a more volatile investment environment. KLA’s strong operational metrics and safer Altman Z-score underscore a better risk-adjusted position in 2026.
Final Verdict: Which stock to choose?
KLA Corporation’s superpower lies in its exceptional capital efficiency and consistent value creation. Its growing ROIC well above WACC signals a durable competitive advantage. However, its relatively high debt-to-equity ratio is a point of vigilance. This stock suits an aggressive growth portfolio seeking robust profitability and market leadership.
Arm Holdings commands a strategic moat through its dominant intellectual property and recurring licensing revenue model. It offers a safer balance sheet with minimal debt, appealing to risk-averse investors. Yet, its negative value creation and sky-high valuation multiples temper enthusiasm. Arm fits a GARP (Growth at a Reasonable Price) portfolio focused on innovation and long-term potential.
If you prioritize durable capital efficiency and proven value creation, KLA Corporation outshines with superior profitability and accelerating momentum. However, if you seek exposure to cutting-edge technology with a strong balance sheet and lower leverage, Arm Holdings offers better stability despite its challenging valuation. Both represent distinct analytical scenarios aligned with different investor profiles and risk tolerances.
Disclaimer: Investment carries a risk of loss of initial capital. The past performance is not a reliable indicator of future results. Be sure to understand risks before making an investment decision.
Go Further
I encourage you to read the complete analyses of KLA Corporation and Arm Holdings plc American Depositary Shares to enhance your investment decisions: